U-shaped relationship between birth weight and childhood blood pressure in China
Bạn đang xem bản rút gọn của tài liệu. Xem và tải ngay bản đầy đủ của tài liệu tại đây (818.8 KB, 11 trang )
Lai et al. BMC Pediatrics
(2019) 19:264
/>
RESEARCH ARTICLE
Open Access
U-shaped relationship between birth
weight and childhood blood pressure in
China
Chong Lai1, Yiyan Hu2, Di He2, Li Liang3, Feng Xiong4, Geli Liu5, Chunxiu Gong6, Feihong Luo7, Shaoke Chen8,
Chunlin Wang3 and Yimin Zhu2*
Abstract
Background: The relationship between birth weight and blood pressure has not been well explored in Chinese
children and adolescents. The aim of this study was to investigate the relationship between birth weight and
childhood blood pressure in China.
Methods: A total of 15324 children and adolescents (7919 boys and 7405 girls) aged 7–17 years were stratified into
six birth weight groups. Analysis of covariance and binary logistic regression were used to analyse the relationship
between birth weight and blood pressure while controlling for potential confounding factors, including age,
gestational age, season of birth and area of residence.
Results: The group with birth weights from 2500 to 2999 g had the lowest prevalence of hypertension (8.9%).
Lower birth weight children (< 2000 g) had significantly higher systolic blood pressure (SBP) (106.00 ± 0.72, P =
0.017), and children with heavier birth weights also had higher SBP (3500–3999 g, 105.13 ± 0.17, P < .001; ≥ 4000 g,
105.96 ± 0.27, P < .001). No significant relationship was found between birth weight and diastolic blood pressure
(DBP). The overall rate of hypertension was 10.8% (12.1% in boys and 9.4% in girls). The median weight group
(2500–2999 g) had the lowest rate of hypertension (8.9%). Compared with children in the median weight group,
children with lower birth weight had a higher prevalence of hypertension (< 2000 g, OR = 1.85, 95% CI = 1.25–2.74;
2000–2499 g, OR = 1.57, 95% CI = 1.15–2.13), and groups with higher birth weights also had higher risks of
hypertension (3500–3999 g, OR = 1.22, 95% CI = 1.02–1.45; ≥ 4000 g, OR = 1.42, 95% CI = 1.16–1.74).
Conclusions: Excluding the confounding effect of obesity, a U-shaped relationship between birth weight and risk
of hypertension was found in children and adolescents in Chinese cities. Birth weight significantly influences SBP
but has a minimal effect on DBP. Further basic research on foetal development and programming may shed light
on this phenomenon.
Keywords: Birth weight, Obesity, Childhood blood pressure, Systolic blood pressure, Diastolic blood pressure,
Hypertension
* Correspondence:
2
Department of Epidemiology & Biostatistics, Zhejiang University School of
Public Health, Hangzhou, China
Full list of author information is available at the end of the article
© The Author(s). 2019 Open Access This article is distributed under the terms of the Creative Commons Attribution 4.0
International License ( which permits unrestricted use, distribution, and
reproduction in any medium, provided you give appropriate credit to the original author(s) and the source, provide a link to
the Creative Commons license, and indicate if changes were made. The Creative Commons Public Domain Dedication waiver
( applies to the data made available in this article, unless otherwise stated.
Lai et al. BMC Pediatrics
(2019) 19:264
Background
There is a consensus that cardiovascular function and
blood pressure are determined during childhood and
continue into adulthood [1]. Childhood hypertension
has been considered a strong predicative factor for
hypertension in adulthood. In the Beijing blood pressure
cohort study, by measuring the inter-vessel parameters,
Liang et al. followed 1259 subjects (6–18 years old) over
24 years and found that children with elevated blood
pressure had accelerated remodelling of both cardiac
and arterial systems in early and middle adulthood [2].
Targeted organ damage, especially damage to the heart,
was detectable in some hypertensive children [3]. Therefore, childhood hypertension should now be considered
a public health concern in younger generations both in
developed countries and in developing countries with
rapid development.
Childhood blood pressure is affected both by genetic
and environmental factors, including factors at birth
(birth weight) and factors after birth (dietary structure,
weight, physical activity) [4–6]. Poor weight management and childhood metabolic syndrome have been
demonstrated as some of the leading causes of abnormal
blood pressure in children [7]. China is experiencing a
huge increase in the prevalence of obesity among children and adolescents. Cao et al. first observed that the
incidence of hypertension was 3.1% among teenagers
(12–17 years old) in Changsha, and the risk of hypertension increased three- to four-fold once BMI reached
above the 95th percentile [8]. Dong et al. explored the
relationship between BMI and blood pressure in Chinese
children. After statistical adjustment for BMI, the mean
increase in SBP was reduced by 40.5%, which indicated
that obesity was one of the leading determinants of high
SBP [9]. Moreover, the residual increase suggested that
some other important factors also contributed to childhood hypertension.
The developmental origins of health and disease
(DOHaD) theory and the life course theory (LCT) lead
to the hypothesis that nutritional status in utero may
permanently change the body’s structure, function and
metabolism in ways that cause chronic diseases in later
life [10–12]. There is some evidence showing that people
born with high birth weight are at higher risk of developing cardiovascular diseases in later life [13]. Xie et al.
collected cross-sectional data from 1253 female nurses
aged 35–65 years and found a J-shaped relationship
between birth weight and blood pressure in adulthood
[14]. Launer et al. found that both low birth weight and
high birth weight infants had a higher risk of elevated
blood pressure [15]. However, the results from Chinese
studies were quite inconsistent with the previous
conclusions. When Zhai et al. analysed 18920 students
aged 6–11 years, they found that elevated blood pressure
Page 2 of 11
in children and teenagers was associated only with BMI
but not with birth weight [16]. Li et al. selected 1435
pairs of children with high or normal birth weight from
a birth cohort between 1993 and 1995 in Wuxi and
followed them until 2005 to 2007. They found no statistically significant relationship between high birth weight
and blood pressure [17].
In the present study, we analysed data from a metabolic syndrome investigation among children and adolescents in six cities across China and adjusted for the
influence of BMI and other confounders. We finally
demonstrated the potential influence of birth weight on
childhood blood pressure. The purpose of the current
study was first to investigate the prevalence of hypertension in children and adolescents in China. Second and
more importantly, we aimed to reveal the association between birth weight and childhood hypertension.
Methods
Subjects
Subjects were recruited from a school-based cluster investigation of metabolic syndrome among children and
adolescents in six provincial capitals in China in September 2010 [18]. The initial aim of this cross-sectional
study was to investigate the incidence and prevalence of
metabolic syndrome and obesity among children and
adolescents. A total of 17035 participants, aged 7–17
years, were recruited for this study. A total of 121
subjects with cancer, chronic diseases (heart, lung, and
kidney) or severe acute infections were excluded. Of the
participants, 1590 lacked information about birth weight
for personal reasons. Therefore, 15324 subjects with
complete information on birth weight and blood
pressure were analysed. The protocol of this study was
proved by the Research Ethics Committee of the School
of Public Health and the Medical Ethics Committees at
the Children’s Hospital and the First Affiliated Hospital
of the Zhejiang University College of Medicine.
Data collection and measurements
Well-trained investigators measured anthropometric
indices, including weight and height, following a standard protocol, referring to a previous study [18]. Information on demographic variables, including sex, date of
birth, gestational age, area of residence and parental
information, was collected through face-to-face interviews with the simultaneous presence of the participants
and their parents. Blood pressure was measured three
times in a sitting position with a cuff haemadynamometer after sitting quietly for 5 min. Parents were asked
to provide the official birth certificates of their children
for the record of birth weight and gestational age.
Lai et al. BMC Pediatrics
(2019) 19:264
Definitions and potential confounding factors
Body mass index (BMI) was calculated as body
weight in kilograms divided by height in metres
squared (kg/m2). The BMI reference material issued
by the World Health Organization (WHO) in 2007
(for individuals 5–19 years old) was adopted to establish the BMI Z-scores (BAZ) [19]. Systolic blood
pressure (SBP) was defined by the first Korotkoff
sound and diastolic blood pressure (DBP) by the
fourth Korotkoff sound. The values of SBP and DBP
were calculated by the average of three repeated
measurements. Gestational age was determined as
the number of completed weeks of gestation from
the last menstrual period (LMP) to the date of birth.
If there was a significant difference between gestational age estimated by LMP and the ultrasound results, the ultrasound estimate was used. We used the
final data on the birth records of the subjects, which
were recorded by obstetricians. Hypertension was defined as being above the 95th percentile of each category based on different ages and sexes, according
to the cut-offs of the Beijing standards for Chinese
children and adolescents (3–17 years old) [20]. Either
outlier SBP or outlier DBP was defined as hypertension. Subjects were divided into six categories by
birth weight in grams with 500 g intervals: < 2000 g,
2000–2499 g, 2500–2999 g, 3000–3499 g, 3500–3999
g, and ≥ 4000 g.
Statistical analyses
Normally distributed variables are expressed as the
mean ± standard deviation (SD) and were compared
by Student’s t test. Categorical variables are
expressed by frequencies (percentages) and were
compared by χ2 tests. The analysis of covariance was
used to correct the covariate effects and to compare
differences in blood pressure among birth weight
groups. The group with birth weights of 2500–2999
g was chosen as a reference because this group of
children had the lowest blood pressures and lowest
prevalence of hypertension. A Dunn-Bonferroni test
was applied for post hoc comparisons. Binary logistic
regression analysis was used to explore the influence
of birth weight on high blood pressure or hypertension. Age, gestational age, BAZ, season of birth and
area of residence were regarded as confounding factors, which were adjusted for in the comparisons (as
footnoted under the tables). Because BMI or BAZ
have long been recognized as core and volatile factors influencing blood pressure, a two-step adjustment was conducted. Confounding factors excluding
BAZ were first adjusted (estimated marginal mean1 ±
SE1), and BAZ was subsequently adjusted for along
with the other factors (estimated marginal mean2 ±
Page 3 of 11
SE2). The quadratic and cubic models were used as
simulators of curve estimation. All tests were twosided, and the results were considered significant
when the p-value was ≤0.05. Statistical analyses were
performed using SPSS for Windows (SPSS 17.0 Inc.,
Chicago, IL).
Results
Basic characteristics of the subjects
The demographic data and anthropometric variables
of the subjects were stratified by sex and are listed
in Table 1. The information of 15324 subjects aged
7–17 years was analysed, and among the subjects,
7919 were boys and 7405 were girls. Subjects were
recruited from six advanced Chinese cities, Chongqing (20.2%), Hangzhou (20.8%), Nanning (16.9%),
Beijing (11.9%), Shanghai (10.1%) and Tianjin
(20.1%). The sex distribution at each age was not
significantly different. There was no notable difference between boys and girls in gestational age or
season of birth. Boys had higher birth weight, weight
and height (P < .001). The prevalence of hypertension
in boys was significantly higher than in girls (12.1%
vs. 9.2%, P < .001).
Birth weight and systolic blood pressure
Table 2 presents the associations between birth weight and
blood pressure. After adjustment for confounders, for the
whole population, the median birth weight group (2500–
2999 g) had the lowest blood pressure (SBP: 103.56 ± 0.23;
DBP: 64.55 ± 0.16), and therefore, we set this group as the
reference. Low birth weight subjects (< 2000 g) had a significantly higher SBP (106.00 ± 0.72, P = .017), while children
with birth weights over 3500 g also had higher SBP (3500–
3999 g, 105.13 ± 0.17, P < .001; ≥ 4000 g, 105.96 ± 0.27,
P < .001). The additional adjustment for BAZ did not change
the association between birth weight and blood pressure.
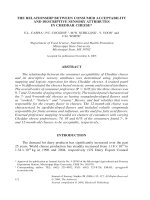
The quadratic or cubic model estimated a U-shaped
association between birth weight and SBP, even after the
adjustment for BAZ (Fig. 1). When stratified by sex, we
found a J-shaped association between birth weight and SBP
for each gender group. Boys with birth weights over 4000 g
had higher SBP (107.18 ± 0.34, P < .001). Girls with birth
weights over 3500 g also had higher SBP (3500–3999 g,
103.97 ± 0.26, P < .001; ≥ 4000 g, 104.72 ± 0.45, P < .001).
Boys or girls with extremely low birth weight did not show
significant SBP differences when compared with the reference group. However, the adjusted mean was higher than
that of the normal group, suggesting that the statistical insignificance might be due to the small sample size.
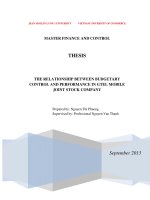
Birth weight and diastolic blood pressure
The association between birth weight and DBP was
also U-shaped among the different birth weight
Lai et al. BMC Pediatrics
(2019) 19:264
Page 4 of 11
Table 1 Demographic data and anthropometric variables of the subjectsa
Variables
Total
Age (y), n (%)
7
Pb
Boys
Girls
N = 15,324
N = 7919
N = 7405
11.54 ± 2.59
11.49 ± 2.60
11.59 ± 2.58
.579
938 (6.1)
506 (6.4)
432 (5.8)
.220
8
1444 (9.4)
763 (9.6)
681 (9.2)
9
1571 (10.3)
818 (10.3)
753 (10.2)
10
1843 (12.0)
957 (12.1)
886 (12.0)
11
1618 (10.6)
861 (10.9)
757 (10.2)
12
1734 (11.3)
908 (11.5)
826 (11.2)
13
1998 (13.0)
979 (12.4)
1019 (13.8)
14
2059 (13.4)
1042 (13.2)
1017 (13.7)
15
1358 (8.9)
695 (8.8)
663 (9.0)
16
576 (3.8)
288 (3.6)
288 (3.9)
17
185 (1.2)
102 (1.3)
83 (1.1)
Weight (kg)
41.42 ± 14.40
42.54 ± 15.63
40.21 ± 12.84
Height (cm)
147.07 ± 15.49
147.89 ± 16.73
146.20 ± 13.99
< 0.001
BMI (kg/m2)
18.58 ± 3.68
18.82 ± 3.89
18.33 ± 3.43
< 0.001
< 0.001
BAZ
< 0.001 ± 1.00
0.06 ± 1.05
−0.07 ± 0.93
< 0.001
Birthweight (g)
3281.0 ± 522.9
3338.9 ± 534.8
3219.2 ± 502.7
< 0.001
Gestational age (wk)
38.44 ± 4.70
38.44 ± 4.81
38.43 ± 4.59
Systolic blood pressure (mmHg)
104.61 ± 12.10
106.08 ± 12.46
103.04 ± 11.51
< 0.001
Diastolic blood pressure (mmHg)
65.12 ± 8.25
65.56 ± 8.62
64.64 ± 8.01
< 0.001
Normal
13666 (89.2)
6958 (87.9)
6708 (90.6)
Abnormal
1658 (10.8)
961 (12.1)
697 (9.4)
< 2000
236 (1.5)
124 (1.6)
112 (1.5)
2000–2499
490 (3.2)
217 (2.7)
273 (2.7)
2500–2999
2398 (15.6)
1066 (13.5)
1332 (18.0)
3000–3499
6445 (42.1)
3084 (38.9)
3361 (45.4)
Hypertension, n (%)
.391
< 0.001
Birth weight category (g), n (%)
< 0.001
3500–3999
4095 (26.7)
2350 (29.7)
1745 (23.6)
≥ 4000
1660 (10.8)
1078 (13.6)
582 (7.9)
3094 (20.2)
1550 (19.6)
1544 (20.8)
Area of residence, n (%)
Chongqing
.890
Hangzhou
3185 (20.8)
1842 (23.6)
1343 (18.1)
Nanning
2592 (16.9)
1328 (16.8)
1264 (17.1)
Beijing
1832 (11.9)
928 (11.7)
904 (12.2)
Shanghai
1545 (10.1)
771 (9.7)
774 (10.4)
Tianjin
3076 (20.1)
1500 (18.9)
1576 (21.3)
3563 (23.3)
1866 (23.6)
1697 (22.9)
Season of Birth, n (%)
Spring
.322
Summer
3834 (25.0)
1976 (25.0
1858 (25.1)
Autumn
4050 (26.4)
2097 (26.5)
1953 (26.4)
Winter
3877 (25.3)
1980 (25.0)
1897 (25.6)
Season of birth: spring = infants born in March, April and May; summer = infants born in June, July and August; autumn = infants born in September,
October and November; winter = infants born in December, January and February
SD Standard deviation
a
Quantitative data are expressed as the mean ± SD (standard deviation), and qualitative data are expressed as frequency (%)
b
P for t tests or χ2 tests
groups when BAZ was controlled (Fig. 2). The low
birth weight group (< 2000 g) had a higher DBP
(66.08 ± 0.52, P = .075), while those with a birth
weight over 3500 g also had a higher DBP (3500–
3999 g, 65.41 ± 0.13, P = .001; ≥ 4000 g, 65.86 ± 0.20,
P < .001). When stratified by sex, the association
Lai et al. BMC Pediatrics
(2019) 19:264
Page 5 of 11
Table 2 The association between birth weight and blood pressure based on the analysis of covariance
Birth weight, N
g
Systolic blood pressure (SBP)
Total <
2000
236
2000– 490
2499
Estimated
marginal
means 2b
SE2 P2d
Mean SD
104.01 12.26 105.54
0.74 .038
106.00
0.72 .017
65.12 8.27 65.82
103.88 12.04 103.90
0.51 1.000 104.43
0.50 1.000 64.64 8.47 64.65
0.37 1.000 64.95
0.36 1.000
2500– 2398 102.99 11.87 103.19
2999
0.23 Ref
103.56
0.23 Ref
64.28 8.28 64.34
0.17 Ref
64.55
0.16 Ref
3000– 6445 104.15 11.86 104.19
3499
0.14 .004
104.28
0.14 .092
64.87 8.30 64.87
0.10 .092
64.93
0.10 .755
3500– 4095 105.37 12.32 105.37
3999
0.18 <
105.13
0.001
0.17 <
65.52 8.33 65.55
0.001
0.13 <
65.41
0.001
0.13 0.001
≥
4000
1660 107.16 12.33 106.49
0.28 <
105.96
0.001
0.27 <
66.40 8.44 66.16
0.001
0.20 <
65.86
0.001
0.20 <
0.001
124
105.18 12.28 106.97
1.04 .598
1.00 .219
65.40 9.02 66.20
0.76 1.000 66.61
0.74 1.000
2000– 217
2499
105.28 12.54 105.25
0.79 1.000 105.88
0.76 1.000 64.62 8.47 64.64
0.57 1.000 64.99
0.56 1.000
2500– 1066 104.60 12.22 104.70
2999
0.36 Ref
105.14
0.34 Ref
0.26 Ref
0.25 Ref
3000– 3084 105.78 12.36 105.70
3499
0.21 .226
105.83
0.20 1.000 65.41 8.63 65.38
0.15 1.000 65.44
0.15 1.000
3500– 2350 106.39 12.61 106.52
3999
0.24 <
106.27
0.001
0.23 .087
65.69 8.54 65.73
0.17 .350
65.60
0.17 1.000
≥
4000
1078 107.98 12.44 107.64
0.35 <
107.18
0.001
0.34 <
66.50 8.55 66.38
0.001
0.26 .003
66.12
0.25 .253
<
2000
112
102.72 12.16 103.92
1.04 .573
1.02 .638
0.74 .415
65.53
0.73 .462
2000– 273
2499
102.78 11.53 102.52
0.67 1.000 102.96
0.65 1.000 64.66 8.48 64.56
0.48 1.000 64.83
0.47 .972
2500– 1332 101.70 11.42 101.67
2999
0.30 Ref
101.97
0.29 Ref
63.71 7.85 63.70
0.22 Ref
63.89
0.21 Ref
3000– 3361 102.65 11.18 102.60
3499
0.19 .140
102.66
0.19 .719
64.38 7.95 64.35
0.14 .152
64.39
0.13 .639
3500– 1745 104.00 11.79 104.20
3999
0.26 <
103.97
0.001
0.26 <
65.29 8.03 65.39
0.001
0.19 <
65.25
0.001
0.18 <
0.001
≥
4000
0.46 <
104.72
0.001
0.45 <
66.21 8.23 66.05
0.001
0.33 <
65.68
0.001
0.32 <
0.001
Boys <
2000
Girls
Diastolic blood pressure (DBP)
SE1 P1c
582
Mean
SD
Estimated
marginal
means 1a
105.64 11.98 105.32
107.72
104.12
Estimated
marginal
means 1a
64.99 8.75 65.03
64.80 7.39 65.40
SE1 P1c
Estimated
marginal
means 2b
SE2 P2d
0.53 .120
66.08
0.52 .075
65.27
SD Standard deviation, SE Standard error, Ref Reference
a
Calculated in the analysis of covariance after adjusting for age, gestational age, area of residence, and season of birth
b
Additional adjustment for BAZ
c
based on estimated marginal means 1; reference: birth weight 2500–2999 g
d
based on estimated marginal means 2; reference: birth weight 2500–2999 g
became nonsignificant. Girls with birth weights over
3500 g had higher DBP (3500–3999 g, 65.25 ± 0.18,
P < .001; ≥ 4000 g, 65.68 ± 0.32, P < .001).
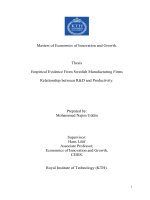
Birth weight and hypertension
The prevalence of hypertension in different birth
weight groups is shown in Table 3. The overall rate
of hypertension was 10.8% (12.1% in boys and 9.4%
in girls) in the target population. A U-shaped association was found between birth weight and the
prevalence of hypertension (Fig. 3). The median
birth weight group (2500–2999 g) had the lowest
prevalence of hypertension (8.9%). Subjects with
birth weights lower than 2500 g had a higher prevalence of hypertension (< 2000 g, OR = 1.85, 95% CI =
1.25–2.74; 2000–2499 g, OR = 1.57, 95% CI = 1.15–
2.13). Subjects with birth weights higher than 3500 g
also had a higher risk of hypertension (3500–3999 g,
OR = 1.22, 95% CI = 1.02–1.45; ≥ 4000 g, OR = 1.45,
95% CI = 1.16–1.74). When separated by sex, the
Lai et al. BMC Pediatrics
(2019) 19:264
Page 6 of 11
Fig. 1 Curve estimation of the association between birth weight and SBP (the quadratic and the cubic modelling both showed a
U-shaped association)
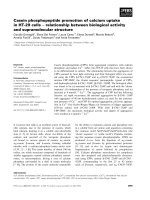
results were consistent with the trend of the whole
population. High SBP and high DBP were subsequently analysed. The low birth weight group (≤
2500 g) had a higher prevalence of high SBP (<
2000 g, OR = 2.33, 95% CI = 1.53–3.50; 2000–2499 g,
OR = 1.53, 95% CI = 1.08–2.15), and subjects with
birth weights greater than 3500 g also had higher
risks of high SPB (3500–3999 g, OR = 1.28, 95% CI =
1.06–1.55; ≥ 4000 g, OR = 1.42, 95% CI = 1.14–1.77)
(Fig. 4). However, no significant differences were
found among birth weight groups when considering
the prevalence of high DBP after performing the
Fig. 2 Curve estimation of the association between birth weight and DBP (the quadratic and the cubic modelling both showed a
U-shaped association)
1.04 (0.87–
1.25)
Ref
1.47 (1.05–
2.05)
2.17 (1.46–
3.23)
1.01 (0.79–
1.29)
Ref
1.42 (0.89–
2.26)
1.69 (0.96–
2.96)
69 (11.9)
157 (9.0)
210 (6.2)
78 (5.9)
24 (8.8)
18 (16.1)
2.11 (1.50–
2.97)
1.59 (1.20–
2.11)
1.08 (0.82–
1.41)
Ref
1.56 (0.96–
2.53)
3.06 (1.73–
5.41)
131 (12.2) 1.40 (1.06–
1.85)
259 (11.0) 1.29 (1.01–
1.65)
270 (8.8)
94 (8.8)
26 (12.0)
17 (13.7)
200 (14.8) 1.65 (1.33–
2.05)
416 (10.2) 1.42 (1.18–
1.71)
480 (7.4)
172 (7.2)
50 (10.2)
35 (14.8)
Abnormal
OR1 (95%
CI)a
<
0.001
.001
1.81 (1.28–
2.57)
1.46 (1.10–
1.95)
.001
.009
.830
1.03 (0.79–
1.35)
.594
–
Ref
–
.054
<
0.001
.185
.288
1.62 (0.99–
2.64)
3.14 (1.76–
5.60)
1.21 (0.91–
1.62)
1.15 (0.89–
1.48)
.596
–
.117
.033
.002
.010
.835
–
.015
<
0.001
P2d
.069
<
0.001
.019
.045
0.93 (0.73–
1.20)
Ref
–
.956
1.47 (0.91–
2.38)
1.87 (1.05–
3.33)
1.42 (1.14–
1.77)
1.28 (1.06–
1.55)
.136
.098
<
0.001
<
0.001
0.98 (0.82–
1.18)
Ref
–
.675
1.53 (1.08–
2.15)
2.33 (1.53–
3.50)
OR2 (95%
CI)b
.024
<
0.001
P1c
548
(94.2)
1659
(95.1)
3221
(95.8)
1285
(96.5)
257
(94.1)
105
(93.8)
1016
(94.2)
2207
(93.9)
2923
(94.8)
34 (5.8)
86 (4.9)
140 (4.2)
47 (3.5)
16 (5.9)
7 (6.2)
62 (5.8)
143 (6.1)
161 (5.2)
57 (5.3)
14 (6.5)
203
(93.5)
1009
(94.7)
6 (4.8)
96 (5.8)
229 (5.6)
301 (4.7)
104 (4.3)
30 (6.1)
13 (5.5)
Abnormal
118
(95.2)
1564
(94.2)
3866
(94.4)
6114
(95.3)
2294
(95.7)
460
(93.9)
223
(94.5)
Normal
High DBP, n (%)
1.42 (0.89–
2.25)
1.38 (0.96–
1.98)
1.19 (0.85–
1.67)
Ref
1.74 (0.96–
3.13)
1.50 (0.65–
3.48)
1.10 (0.76–
1.60)
1.14 (0.83–
1.57)
0.98 (0.72–
1.34)
Ref
1.23 (0.67–
2.25)
0.77 (0.32–
1.86)
1.31 (0.98–
1.75)
1.25 (0.98–
1.59)
1.08 (0.86–
1.36)
Ref
1.46 (0.96–
2.23)
1.07 (0.58–
1.96)
OR1 (95%
CI)a
OR2 (95%
CI)b
Ref
Ref
Ref
.023 1.42 (0.90–
2.26)
.087 1.26 (0.87–
1.82)
.311 1.13 (0.81–
1.60)
–
.066 1.73 (0.96–
3.13)
.359 1.51 (0.65–
3.51)
.618 0.95 (0.65–
1.38)
.405 1.02 (0.74–
1.41)
.914 0.92 (0.67–
1.26)
–
.511 1.24 (0.67–
2.30)
.567 0.83 (0.34–
2.01)
.064 1.12 (0.84–
1.50)
.067 1.13 (0.89–
1.44)
.499 1.02 (0.81–
1.29)
–
.077 1.46 (0.96–
2.24)
.832 1.10 (0.60–
2.03)
P1c
Normal
2184
(91.1)
955
(89.6)
1229
(92.3)
.135 503
(86.4)
.215 1558
(89.3)
.473 3084
(91.8)
–
.069 241
(88.3)
.338 93 (83.0)
.781 915
(84.9)
.903 2048
(87.1)
.608 2747
(89.1)
–
.497 186
(85.7)
.682 107
(86.3)
.429 1418
(85.4)
.323 3606
(88.1)
.864 5831
(90.5)
–
.079 427
(87.1)
1.08 (0.91–
1.27)
Ref
1.51 (1.12–
2.04)
1.75 (1.19–
2.58)
OR1 (95%
CI)a
1.45 (0.94–
2.23)
1.39 (0.80–
2.41)
1.08 (0.85–
1.36)
Ref
1.62 (1.05–
2.45)
2.33 (1.34–
4.02)
79 (13.6)
1.84 (1.35–
2.51)
187 (10.7) 1.43 (1.11–
1.84)
277 (8.2)
103 (7.7)
32 (11.7)
19 (17.0)
163 (15.1) 1.53 (1.18–
1.98)
302 (12.9) 1.28 (1.01–
1.61)
337 (10.9) 1.07 (0.85–
1.34)
111 (10.4) Ref
31 (14.3)
17 (13.7)
242 (14.6) 1.64 (1.35–
2.00)
489 (11.9) 1.34 (1.13–
1.59)
614 (9.5)
214 (8.9)
63 (12.9)
36 (15.3)
Abnormal
Hypertension, n (%)
.750 200
(84.7)
P2d
<
0.001
.006
.541
–
.029
.003
.001
.040
.550
–
.093
.251
<
0.001
.001
.375
–
.007
.005
P1c
1.58 (1.15–
2.18)
1.32 (1.02–
1.70)
1.03 (0.81–
1.31)
Ref
1.66 (1.08–
2.54)
2.37 (1.36–
4.12)
1.32 (1.02–
1.72)
1.14 (0.90–
1.45)
1.00 (0.80–
1.27)
Ref
1.51 (0.96–
2.35)
1.51 (0.86–
2.66)
1.42 (1.16–
1.74)
.004
.035
.794
–
.022
.002
.038
.266
.973
–
.072
.155
.001
.025
.823
1.02 (0.86–
1.20)
1.22 (1.02–
1.45)
–
.004
.002
P2d
Ref
1.57 (1.15–
2.13)
1.85 (1.25–
2.74)
OR2 (95%
CI)b
(2019) 19:264
SBP Systolic blood pressure, DBP Diastolic blood pressure, SD Standard deviation, SE Standard error, OR Odds ratio, CI Confidence interval, Ref Reference
a
Calculated in the binary logistic regression analysis after adjusting for age, gestational age, area of residence, season of birth
b
Additional adjustment for BAZ.
c
based on OR1; reference: birth weight at 2500–2999 g
d
based on OR2; reference: birth weight at 2500–2999 g
513
(88.1)
≥4000
947
(87.8)
≥4000
1588
(91.0)
2091
(89.0)
3500–
3999
3500–
3999
2814
(91.2)
3000–
3499
3151
(93.8)
972
(91.2)
2500–
2999
3000–
3499
191
(88.0)
2000–
2499
1254
(94.1)
107
(86.3)
Boys < 2000
2500–
2999
1460
(88.0)
≥4000
249
(91.2)
3679
(89.8)
3500–
3999
2000–
2499
5965
(92.6)
3000–
3499
94 (83.9)
2226
(92.8)
2500–
2999
< 2000
440
(89.8)
2000–
2499
Girls
201
(85.2)
Normal
High SBP, n (%)
Total < 2000
Birth weight, g
Table 3 The association between birth weight and hypertension based on binary logistic regression
Lai et al. BMC Pediatrics
Page 7 of 11
Lai et al. BMC Pediatrics
(2019) 19:264
Page 8 of 11
Fig. 3 Odds ratios of different birth weight groups for hypertension
adjustments. Neither the low birth weight group nor
the high birth weight group showed any disparities.
Discussion
The current study examined the association between
birth weight and childhood blood pressure by collecting
school-based data from six Chinese cities. This study is
also the first, to the best of our knowledge, to investigate
Fig. 4 Odds ratios of different birth weight groups for high SBP
the relationship between birth weight and childhood
hypertension using a large census from urban areas in
China. In summary, birth weight had a profound impact
on childhood blood pressure and the prevalence of primary hypertension in Chinese children and adolescents.
Moreover, the association between birth weight and
blood pressure remained U-shaped after adjusting for
various confounding factors, including BAZ, season of
Lai et al. BMC Pediatrics
(2019) 19:264
birth and area of residence. Children with birth weights
from 2500 to 2999 g had the lowest blood pressure and
lowest risk for childhood hypertension. Birth weight significantly influenced systolic blood pressure. However,
its effect on diastolic blood pressure remains unknown.
Some of the previous studies suggested an inverse relationship between birth weight and childhood blood pressure, while others showed a positive relationship or no
association at all. In 2012, Edvardsson et al. reviewed the
existing studies and listed several reasons that might
drive the results apart. They believed that inadequate adjustment for potential confounders, failure to use standard blood pressure values, and disparities in the target
populations together contributed to the discrepant results [21]. The results from the current study verified a
U-shaped relationship between birth weight and childhood blood pressure. The associations between birth
weight and childhood blood pressure were not unidirectional, and this, to some extent, explained why neither
the inverse nor the positive modelling was adequate to
explain the true relationship in reality.
The proposed mechanisms linking birth weight and
childhood hypertension have been widely studied. As
has been shown in animal models and partly in
humans, the hyperfiltration theory suggests that the
reduction in nephron number, a decreased kidney
mass and a reduction in renal reserve in low birth
weight children enhance salt sensitivity and increase
the risk of hypertension [22–24]. The mechanism
linking high birth weight to childhood hypertension
was buried within the correlation between birth
weight and current weight. Metabolic syndrome and
obesity play important roles in the development of
arterial stiffness and endothelial dysfunction [7, 25,
26]. However, as presented in this study, current
weight or BAZ is not adequate to explain the increase in blood pressure. The Barker theory posits
that cardiovascular diseases originate during intrauterine development and that undernutrition in
utero permanently changes the organ structure, function and systematic metabolism in ways that lead to
cardiovascular events in later life [10]. Pietrobelli et
al. further expanded the Barker hypothesis and suggested that intra-uterine nutritional status should be
intervened upon artificially to avoid childhood obesity and coronary artery diseases in the future [27].
Hence, foetal programming needs to be studied more
extensively to determine the underlying pathophysiological mechanisms. Of interest was that DBP was
not influenced by birth weight, emphasizing the possibility of different mechanisms behind high SBP and
high DBP in children and adolescents. Traditionally,
DBP is considered the most important component of
blood pressure. However, there are no studies on
Page 9 of 11
isolated DBP levels in either adults or children. In
studies of the ageing population, SBP and pulse
pressure (SBP - DBP) have been considered to be
better predictors of cardiac risks [28]. The results
here showed that BMI and birth weight influenced
DBP but failed to explain its elevation above the
normal range.
As even small increases in blood pressure are
known to increase the long-term risk of cardiovascular diseases and hypertensive nephropathy, it is crucial
to understand the aetiology of primary childhood
hypertension and to look for potential precautions. Li
et al. reported that the prevalence of abnormal blood
pressure, together with obesity, dramatically increased
from 1993 to 2013 in China [29]. Paediatric hypertension is usually asymptomatic, difficult to recognize by
parents and can easily be missed by health professionals. Moreover, even pre-hypertension is not completely benign, and its rate of progression to
hypertension is approximately 7% per year over a 2year interval [3]. The relationship between birth
weight and hypertension increases from childhood to
adulthood [30]. According to the conclusions of this
study, the prevention of primary hypertension may require more insight into foetal development and birth
weight control in a reasonable range. In the era of
precise medicine, it is promising to intervene in the
risk factors during the gestational stage or early childhood. Prevention of cardiovascular diseases should
begin in childhood by regularly screening for hypertension, counselling for healthy lifestyle habits and
avoiding preventable risk factors.
In this work, the study population was well defined,
and we used Chinese-specific standardized methods to
collect data. The effects of main potential confounders,
especially BAZ, were controlled in the analysis of covariance. However, the present study had limitations. This
was a cross-sectional study, and there might be some recall bias in the interview results. Second, information on
growth patterns was not collected. An increasing
amount of evidence is available showing that birth
weight can influence childhood growth velocity and influence blood pressure [31, 32]. Third, a lack of information on physical activity and the socioeconomic status of
each family was collected. Researchers have found socioeconomic status to be an important risk factor both for
birth weight and blood pressure [33, 34]. For the reasons
mentioned above, well-designed prospective studies are
urgently needed to examine infants and track their blood
pressure into adulthood to verify the causal effect of
birth weight on hypertension. Information about family
history, physical exercise, pubertal development and socioeconomic status should be clearly recorded and taken
into analysis.
Lai et al. BMC Pediatrics
(2019) 19:264
Conclusions
This study revealed that birth weight was associated
with blood pressure levels and the risk of hypertension in Chinese children and adolescents. Both low
and high birth weight increased the risk of hypertension. Birth weight influenced SBP but had a minimal
effect on DBP.
Abbreviations
BAZ: BMI Z-scores; BMI: Body mass index; CI: Confidence interval;
DBP: Diastolic blood pressure; DOHaD: The developmental origins of health
and disease theory; LCT: Life course theory; OR: Odds ratio; Ref: Reference;
SBP: Systolic blood pressure; SD: Standard deviation; SE: Standard error;
WHO: World Health Organization
Acknowledgements
We would like to thank all the participants and investigators that took part in
this study.
Authors’ contributions
YMZ performed the study design, data analysis and drafted the manuscript.
CL performed data analysis and drafted the manuscript. YYH and DH
performed data analysis. LL, CLW, FX, GLL, CXG, FHL and SKC contributed to
the study design and data collection. All authors have read and approved
the final version of the manuscript.
Funding
This study was supported by National Key Technology R&D Program of
China under Grant (2017YFC0907004, 2012BAI02B03 and 2009BAI80B02),
Zhejiang Provincial Program for the Cultivation of High-Level Innovative
Health Talents.
Availability of data and materials
All data generated or analysed during this study are included in this
published article:
Zhou D, Yang M, Yuan Z, Zhang D, Liang L, Wang C, et al. Waist-to-Height
Ratio: a simple, effective and practical screening tool for childhood obesity
and metabolic syndrome. Prev Med. 2014;37:35–40.
Ethics approval and consent to participate
Consents were signed by participants and their parents. The protocol of this
study was proved by the Research Ethics Committee at School of Public
Health, Medical Ethics Committees at the Children’s Hospital and the First
Affiliated Hospital of the Zhejiang University College of Medicine.
Consent for publication
Not applicable.
Competing interests
The authors declare that they have no competing interests.
Author details
1
Department of Surgery, The First Affiliated Hospital, Zhejiang University
School of Medicine, Hangzhou, China. 2Department of Epidemiology &
Biostatistics, Zhejiang University School of Public Health, Hangzhou, China.
3
Department of Pediatrics, The First Affiliated Hospital, Zhejiang University
School of Medicine, Hangzhou, China. 4Department of Endocrinology,
Chongqing Medical University Affiliated Children’s Hospital, Chongqing,
China. 5Department of Pediatrics, Tianjin Medical University General Hospital,
Tianjin, China. 6Department of Pediatrics, Beijing Children’s Hospital Affiliated
to Capital Medical University, Beijing, China. 7Department of Pediatric
Endocrinology and Genetic Metabolic Diseases, Children’s Hospital of Fudan
University, Shanghai, China. 8Department of Pediatrics Endocrinology,
Maternal and Child Health Hospital of Guangxi Zhuang Autonomous Region,
Nanning, China.
Page 10 of 11
Received: 18 September 2018 Accepted: 18 July 2019
References
1. Miersch A, Vogel M, Gausche R, Siekmeyer W, Pfäffle R, Dittrich K, et al.
Blood pressure tracking in children and adolescents. Pediatr Nephrol. 2013;
28(12):2351–9.
2. Liang Y, Hou D, Shan X, Zhao X, Hu Y, Jiang B, et al. Cardiovascular
remodeling relates to elevated childhood blood pressure: Beijing blood
pressure cohort study. Int J Cardiol. 2014;177(3):836–9.
3. Flynn J, Daniels S, Hayman L, Maahs D, McCrindle B, Mitsnefes M, et al.
Update: ambulatory blood pressure monitoring in children and adolescents:
a scientific statement from the American Heart Association. Hypertension.
2014;63(5):1116–35.
4. Muntner P, He J, Cutler J, Wildman R, Whelton P. Trends in blood pressure
among children and adolescents. JAMA. 2004;291(17):2107–13.
5. Knowles G, Pallan M, Thomas G, Ekelund U, Cheng K, Barrett T, et al.
Physical activity and blood pressure in primary school children: a
longitudinal study. Hypertension. 2013;61(1):70–5.
6. Ayer J, Harmer J, Xuan W, Toelle B, Webb K, Almqvist C, et al. Dietary
supplementation with n-3 polyunsaturated fatty acids in early childhood:
effects on blood pressure and arterial structure and function at age 8 y. Am
J Clin Nutr. 2009;90(2):438–46.
7. Flynn J. The changing face of pediatric hypertension in the era of the
childhood obesity epidemic. Pediatr Nephrol. 2013;28(7):1059–66.
8. Cao Z, Zhu L, Zhang T, Wu L, Wang Y. Blood pressure and obesity among
adolescents: a school-based population study in China. Am J Hypertens.
2012;25(5):576–82.
9. Dong B, Wang H, Wang Z, Liu J, Ma J. Trends in blood pressure and body
mass index among Chinese children and adolescents from 2005 to 2010.
Am J Hypertens. 2013;26(8):997–1004.
10. Barker D. The origins of the developmental origins theory. J Intern Med.
2007;261(5):412–7.
11. Silveira P, Portella A, Goldani M, Barbieri M. Developmental origins of health
and disease (DOHaD). J Pediatr. 2007;83(6):494–504.
12. Barnes M, Heaton T, Goates M, Packer J. Intersystem implications of the
developmental origins of health and disease: advancing health promotion
in the 21st century. Healthcare (Basel). 2016;4(3):E45.
13. Skilton M, Siitonen N, Würtz P, Viikari J, Juonala M, Seppälä I, et al. High
birth weight is associated with obesity and increased carotid wall thickness
in young adults: the cardiovascular risk in young Finns study. Arterioscler
Thromb Vasc Biol. 2014;34(5):1064–8.
14. Xie Y, Ho S, Liu Z, Hui S. Birth weight and blood pressure: ‘J’ shape or linear
shape? Findings from a cross-sectional study in Hong Kong Chinese
women. BMJ Open. 2014;4(9):e005115.
15. Launer L, Hofman A, Grobbee D. Relation between birth weight and blood
pressure: longitudinal study of infants and children. BMJ. 1993;307(6917):1451–4.
16. Zhai Y, Li W, Shen C, Zhao W, Shi X. Relationship between birth weight and
elevated blood pressure among children aged 6-11 years in China (in
Chinese). Zhonghua Er Ke Za Zhi. 2014;52(1):11–5.
17. Li Y, Wu J, Yu J, Rong F, Ren J, Gao E, et al. The influence of high birth
weight on the blood pressure during childhood - a cohort study (in
Chinese). Zhonghua Liu Xing Bing Xue Za Zhi. 2012;33(12):1213–7.
18. Zhou D, Yang M, Yuan Z, Zhang D, Liang L, Wang C, et al. Waist-to-height
ratio: a simple, effective and practical screening tool for childhood obesity
and metabolic syndrome. Prev Med. 2014;37:35–40.
19. Organization WH. WHO growth reference 5–19 years. 2007. Nutrition Do,
editor.
20. Mi J, Wang T, Meng L, Zhu G, Han S, Zhong Y, et al. Development of blood
pressure reference standards for Chinese children and adolecents (in
Chinese). Chin J Evid Based Pediatr. 2010;5(1):4–14.
21. Edvardsson V, Steinthorsdottir S, Eliasdottir S, Indridason O, Palsson R. Birth
weight and childhood blood pressure. Curr Hypertens Rep. 2012;14(6):596–602.
22. Simonetti G, Raio L, Surbek D, Nelle M, Frey F, Mohaupt M. Salt sensitivity of
children with low birth weight. Hypertension. 2008;52(4):625–30.
23. Brenner B, Garcia D, Anderson S. Glomeruli and blood pressure. Less of one,
more the other? Am J Hypertens. 1988;1(4 pt 1):335–47.
24. Schreuder M, van Wijk J, Delemarre-van de Waal H. Increased blood
pressure variability in aging rats after intrauterine growth restriction.
Hypertension. 2007;50(5):e158.
Lai et al. BMC Pediatrics
(2019) 19:264
25. Gurnani M, Birken C, Hamilton J. Childhood obesity: causes, consequences,
and management. Pediatr Clin N Am. 2015;62(4):821–40.
26. DeMarco V, Aroor A, Sowers J. The pathophysiology of hypertension in
patients with obesity. Nat Rev Endocrinol. 2014;10(6):364–76.
27. Pietrobelli A, Agosti M, Zuccotti G, Group TM. Putting the Barker theory into
the future: time to act on preventing pediatric obesity. Int J Environ Res
Public Health. 2016;13(11):E1151.
28. Strandberg T, Pitkala K. What is the most important component of
blood pressure: systolic, diastolic or pulse pressure? Curr Opin Nephrol
Hypertens. 2003;12(3):293–7.
29. Li S, Ma C, Xi B. Trends in elevated blood pressure among Chinese children
and adolescents (in Chinese). Chin J Schi Health. 2016;37(10):1449–52.
30. Moore V, Cockington R, Ryan P, Robinson J. The relationship between birth
weight and blood pressure amplifies from childhood to adulthood. J
Hypertens. 1999;17(7):883–8.
31. Bruno R, Faconti L, Taddei S, Ghiadoni L. Birth weight and arterial
hypertension. Curr Opin Cardiol. 2015;30(4):398–402.
32. Halldorsson T, Gunnarsdottir I, Birgisdottir B, Gudnason V, Aspelund T,
Thorsdottir I. Childhood growth and adult hypertension in a population of
high birth weight. Hypertension. 2011;58(1):8–15.
33. Filler G, Yasin A, Kesarwani P, Garg A, Lindsay R, Sharma A. Big mother or
small baby: which predicts hypertension? J Clin Hypertens (Greenwich).
2011;13(1):35–41.
34. Bouthoorn S, Van Lenthe F, De Jonge L, Hofman A, Van Osch-Gevers L,
Jaddoe V, et al. Maternal educational level and blood pressure, aortic
stiffness, cardiovascular structure and functioning in childhood: the
generation R study. Am J Hypertens. 2014;27(1):89–98.
Publisher’s Note
Springer Nature remains neutral with regard to jurisdictional claims in
published maps and institutional affiliations.
Page 11 of 11