Parental support in promoting children’s health behaviours and preventing overweight and obesity – a long-term follow-up of the cluster-randomised healthy school start study II trial
Bạn đang xem bản rút gọn của tài liệu. Xem và tải ngay bản đầy đủ của tài liệu tại đây (846.57 KB, 11 trang )
Norman et al. BMC Pediatrics
(2019) 19:104
/>
RESEARCH ARTICLE
Open Access
Parental support in promoting children’s
health behaviours and preventing
overweight and obesity – a long-term
follow-up of the cluster-randomised
healthy school start study II trial
Åsa Norman1* , Zangin Zeebari1,2, Gisela Nyberg1,3 and Liselotte Schäfer Elinder1,4
Abstract
Background: Effects of obesity prevention interventions in early childhood are only meaningful if they are
sustained over time, but long-term follow-up studies are rare. The school-based cluster-randomised Healthy School
Start (HSS) trial aimed at child health promotion and obesity prevention through parental support was carried out
in 31 pre-school classes (378 families) in disadvantaged areas in Sweden during 2012–2013. Post-intervention results
showed intervention effects on intake of unhealthy foods and drinks, and lower BMI-sds in children with obesity at
baseline. This study aimed to evaluate the long-term effectiveness 4 years post-intervention.
Methods: Data were collected from 215 children in March–June 2017. Child dietary intake, screen time, and
physical activity were measured through parental-proxy questionnaires. Child height and weight were measured by
the research group. Group effects were examined using Poisson, linear, logistic, and quantile regression for data on
different levels. Analyses were done by intention to treat, per protocol, and sensitivity analyses using multiple
imputation.
Results: No between-group effects on dietary intake, screen time, physical activity, or BMI-sds were found for the
entire group at the four-year follow-up. In girls, a significant subgroup-effect was found favouring intervention
compared to controls with a lower intake of unhealthy foods, but this was not sustained in the sensitivity analysis.
In boys, a significant sub-group effect was found where the boys in the intervention group beyond the 95th
percentile had significantly higher BMI-sds compared to boys in the control group. This effect was sustained in the
sensitivity analysis. Analyses per protocol showed significant intervention effects regarding a lower intake of
unhealthy foods and drinks in the children with a high intervention dose compared to controls.
Conclusions: Four years after the intervention, only sub-group effects were found, and it is unlikely that the HSS
intervention had clinically meaningful effects on the children. These results suggest that school-based prevention
programmes need to be extended for greater long-term effectiveness by e.g. integration into school routine
practice. In addition, results showed that children with a high intervention dose had better long-term outcomes
compared to controls, which emphasises the need for further work to increase family engagement in interventions.
(Continued on next page)
* Correspondence:
1
Department of Public Health Sciences, Karolinska Institutet, 171 77
Stockholm, Sweden
Full list of author information is available at the end of the article
© The Author(s). 2019 Open Access This article is distributed under the terms of the Creative Commons Attribution 4.0
International License ( which permits unrestricted use, distribution, and
reproduction in any medium, provided you give appropriate credit to the original author(s) and the source, provide a link to
the Creative Commons license, and indicate if changes were made. The Creative Commons Public Domain Dedication waiver
( applies to the data made available in this article, unless otherwise stated.
Norman et al. BMC Pediatrics
(2019) 19:104
Page 2 of 11
(Continued from previous page)
Trial registration: ISRCTN, ISRCTN39690370, retrospectively registered March 1, 2013, />ISRCTN39690370.
Keywords: BMI-sds, Diet, Intervention, Motivational interviewing, Physical activity, Quantile regression, School,
Screen time, Sedentary behaviour, Socio-economic position
Introduction
Overweight and obesity comprise serious threats to health,
causing increased morbidity and mortality globally [1]. In
Sweden, a strong socioeconomic gradient in obesity is
seen among both adults [2] and children [3, 4]. Obesity
tracks to some extent from childhood to adolescence and
adulthood [5], which points to the importance of prevention early in life through the promotion of healthy dietary
habits and physical activity, and a reduction in sedentary
behaviour. Research has shown that parents constitute an
important target group for obesity prevention interventions in younger children. Therefore, parental involvement
has been strongly emphasised in interventions to promote
health and prevent unhealthy weight development in children [6, 7]. Based on this, the Healthy School Start (HSS)
intervention was developed in Sweden in 2010 [8] with
the aim through school-based parental support of promoting healthy behaviours and preventing unhealthy weight
development among children. The intervention was specifically developed for children starting school (5 to 7
years old) in disadvantaged areas and included a follow-up
measurement 5 months post-intervention. The HSS intervention was evaluated in two cluster-randomised trials, in
2010–2011 with 243 children in families with low to middle socioeconomic position (SEP), and in 2012–2013 with
378 children in families with low SEP. The results of the
first trial showed significantly higher vegetable intake in
the intervention group compared to the control group
post-intervention, and higher total physical activity among
girls at weekends [9]. The effect on vegetable intake was
sustained for boys at the five-month follow-up [9].
Post-intervention results from the second trial showed a
significantly lower intake of unhealthy foods and drinks in
the intervention group compared to controls, and a decrease in BMI-sds in children who were obese at baseline
[10]. The effect on unhealthy foods was sustained in boys
in the intervention group at the five-month follow-up.
Important public health gains from health promotion
and prevention interventions, such as an increase in the
proportion of individuals with normal weight, take time
to develop, and it is therefore recommended to do
long-term follow-up of trials [11, 12]. Delayed effects
have been seen after 1 to 2 years in some child obesity
prevention interventions [13, 14]. Unfortunately,
long-term follow-up studies including a time period of
more than 1 year are scarce for reasons such as the
wait-list control groups being offered the intervention
after the trial, the limited funding of trials, and/or difficulties in locating participants after several years.
This study aims to evaluate the long-term effectiveness
after 4 years of the Healthy School Start II intervention,
a parental support programme to promote health and
prevent obesity in children in the school setting.
Methods
The HSS II intervention was carried out during 2012–
2013 in three disadvantaged areas in Stockholm County
with a high prevalence of overweight and obesity among
children in the county [15]. The intervention was evaluated as a parallel group cluster-randomised controlled
wait-list trial in pre-school classes (five- to
seven-year-old children) with school class as the unit of
randomisation [10]. The control group was offered the
intervention after the five-month follow-up measurements. Thirteen schools with 31 pre-school classes participated at baseline with a total of 378 children.
Outcome measurements regarding children’s diet, physical activity, screen time, height, and weight were taken
at baseline in August and September 2012 (T1),
post-intervention in April and May 2013 (T2), at a
five-month follow-up in September and October 2013
(T3) [10], and during March to June in 2017 (T4) for
this four-year follow-up study.
The Healthy School Start intervention.
The HSS is based on Social Cognitive Theory [16] with
a published study protocol [8] and includes three intervention components:
Health information to parents
A brochure developed specifically for the intervention
containing evidence-based advice regarding healthy dietary, physical activity, screen, and sleeping habits for
six-year-old children. The brochure is written in basic,
easy-to-read Swedish and also available in Arabic and
Somali, which were common languages in the intervention areas. As a booster to the information in the brochure, an information group meeting was offered in
each of the intervention schools.
Motivational interviewing (MI) with parents
One to two sessions of MI per family were offered,
where parents had the opportunity to focus on a target
Norman et al. BMC Pediatrics
(2019) 19:104
behaviour regarding their child’s diet or physical activity
in the home environment that they wanted to change.
Two counsellors, with documented MI competence
prior to the intervention, conducted the MI sessions.
Classroom activities with home assignments
Ten 30-min sessions were conducted by the teachers with
support from a programme-specific teachers’ manual and
tool-box. Classroom sessions were complemented by
home assignments to be completed by the child and
parents together in a workbook.
Fidelity to the intervention components was monitored during implementation [10].
Participation in intervention by the control group
In line with the wait-list design, control classes were offered to take part in the intervention components after
the five-month follow-up measurements were completed
in October 2013 as follows: Component 1: The brochure
was sent home to all parents in the control group who
had consented to participate in the trial (n = 193), but
the parents of only one child (less than 1% of the control
group) participated in the information meeting offered.
As sending home information in itself has a very limited
effect on behavioural change [17, 18], this was not seen
as an obstacle to a long-term follow-up.
Component 2: Only two (1%) of the 193 control parents chose to participate in the MI session.
Component 3: All teachers in the 15 control classes
were offered the classroom material and workbooks to be
used in class from November 2013 until May 2014. Three
of the 15 classes did not conduct any of the lessons; five
classes gave two of the lessons, two classes gave six lessons, and two classes gave all ten lessons. Teachers in
three of the 15 classes did not respond to the queries
about whether the material had been used or not.
Page 3 of 11
Children’s health behaviours
Children’s diet, physical activity, and screen time were
measured by means of a parent report consistent with
the previous assessments [10] using the Eating and Physical Activity Questionnaire (EPAQ) [19]. Regarding diet,
parents responded to their child’s dietary intake during
the previous weekday. Items included fruits and vegetables, snacks, sweets/chocolate, ice-cream, cakes/buns/
cookies, soft drink, flavoured milk and fruit juice in
order to capture indicators corresponding to healthy and
unhealthy dietary intake, respectively. The response scale
included whole servings in the categories: 0, 1, 2, 3, 4, or
5 or more servings for food items, and 0, 1, 2, 3, 4, 5, 6
or more servings for drink items. Servings were defined
as: drinks = 1.5 dl, vegetables = e.g. 2 dl grated carrots/
cabbage or a large tomato or 2–3 broccoli heads, fruit =
e.g. a small apple or about 10 grapes, snacks = 1.5 dl
crisps or cheese doodles, sweets = about 1.5 dl of sweets
or 4 pieces from a chocolate bar, cakes = a small bun or
5 small biscuits, ice-cream = a small ice cream bar or 1
dl of ice-cream. Aggregated dietary indicator variables
were created as the sum of either healthy foods (fruit
and vegetables), unhealthy foods (snacks, sweets/chocolate, ice-cream, cakes/buns/cookies), or unhealthy
drinks (soft drink, flavoured milk and fruit juice above
one serving). Dietary items of EPAQ have been validated
against 24-h recall in an Australian context with significant correlations between the two methods for different
items ranging from r = 0.57 to r = 0.88 [19].
In addition, the questionnaire measured whether the
child was active in organised activity, i.e. a member of,
and active participant in an organisation delivering organised activity such as swimming, basketball, or capoeira,
for children, (yes or no), and minutes of screen time in
front of the television or computer during the previous
weekday. The questionnaire was available in Swedish
and distributed via a web-link.
Children’s anthropometry
Data collection
All 378 families from the baseline measurements were
targeted for inclusion in the four-year measurement
(T4). Contact with the families was re-established
through several steps. First, schools were contacted and
reminded about the planned data collection and asked
to provide contact details for parents in the families included. In some cases, we had difficulties in establishing
contact with schools due to staff turn-over, including
school principals, which also made it difficult to get into
contact with parents. Classes had been reorganised and
children had changed school class. In addition, two of
the schools had merged into one and several children
had moved to schools not included in the HSS II study.
Height and weight were measured in school according
to standardised procedures [8] by two trained research
assistants. The standardised procedure included measuring the child’s weight where the child was wearing light
clothing (t-shirt and trousers) to the nearest 0.1 kg (kg)
using a digital scale (SECA Robusta 813).Height was
measured using a SECA stadiometer (214) to the nearest
0.001 m (m). The child was instructed to take off shoes,
stand with the feet apart, having the calves, back and
shoulders touching the stadiometer, and the heels and
back touching the wall and looking straight forward.
The research assistants were trained in the measurement
procedures to the level of reliability where they differed
0.1 kg in the weight measurement and 0.002 m in the
height measurements, when measuring the same person,
Norman et al. BMC Pediatrics
(2019) 19:104
before they started the T4 measurements in this study.
The assistants measured both intervention and control
group to an equal extent. BMI was calculated as weight
(kg) divided by height (m) squared, and BMI standard
deviation score (BMI-sds) was calculated according to a
Swedish reference standard [20]. The International
Obesity Task Force cut-off points were used to define
children’s weight status (underweight, normal weight,
overweight, and obesity) [21].
Socio-economic position
Parental educational level and area of residence were
used as indicators of SEP [22, 23]. The study setting
comprised three areas in Stockholm County with low
employment and low educational level that were specifically targeted by the government in order to increase
socio-economic development [24]. Furthermore, the
highest self-reported educational level attained by either
parent in the family at T1 was used as an indicator of
SEP. The SEP variable was dichotomised: low education
as equal to primary and secondary school (≤12 years of
schooling) and high education (> 12 years of schooling)
equal to third level education.
Page 4 of 11
sessions, as the MI sessions were hypothesized as
being the main intervention component. In total,
this analysis included 88 to103 families depending
on the outcome.
3. A multilevel analysis with two levels (individual and
school class) was performed in order to adjust for
between-school class differences (school class constituting the original unit of randomization, n = 31).
In these analyses, a random intercept for school
class clustering was estimated using the maximum
likelihood estimation method. A likelihood ratio test
was used to compare model fit between the models
with and without the random intercept.
4. A sensitivity analysis was undertaken for significant
outcomes (unhealthy foods, and BMI-sds) in order
to detect whether effects were sustained when missing data was accounted for. For the sensitivity analysis multiple imputation was performed using five
imputed datasets including all available variables regarding demographics, diet, activity, and anthropometry to include the total sample at T1 (n = 378).
As the missing data had a random pattern, the fully
conditional specification method was used to generate imputed data [26].
Region of birth
Parents reported their country of birth at T1. The family
was categorised as originating from outside the Nordic
region (Sweden, Norway, Finland, Denmark, and Iceland)
if one or both parents were born outside the region.
Statistical analyses
Baseline differences between intervention and control
group of individuals who were included in measurements at T4 were examined using an independent sample t-test for continuous data and Chi-square for
categorical data. Long-term effectiveness of the intervention was evaluated using the same procedure as in the
previous study [10]. Thus, values at T4 were compared
to values at T1. Only individuals with valid values at T2
were included in the analyses in order to obtain a sample comparable to our previous effectiveness evaluation
post-intervention. Analyses of long-term effectiveness
were undertaken in several steps, as has been recommended by Little et al. [25]. The analyses were performed as follows:
1. Complete cases intention to treat (ITT) analysis
was performed with individuals that had valid data
at T1, T2 and T4 (n = 215) regardless of their
degree of participation in the intervention activities.
This analysis represents the main analysis and is
presented in Tables 2, and 3, and Figs. 1, 2, and 3.
2. A per protocol analysis, which included children
from families who had participated in both MI
To determine long-term intervention effects a crude
model was first tested for all outcomes at T4 using
the group as the predictor with adjustment for baseline values. Second, the main model including group,
sex of the child, parental education, and baseline
values, was tested. Third, interactions between group
and sex, or group and parental education were tested.
Analyses were stratified if significant interaction terms
were found. For the continuous outcome (screen
time), linear regression was performed. For count outcomes (single and aggregated food, and drink variables), Poisson regression was performed. For the
binary outcome (child active in organised activity yes/
no), logistic regression was performed. To analyse the
effect of the intervention on a wide spectrum of
BMI-sds, quantile regression was applied. The conditional quantiles of the BMI-sds at T4 (conditioned on
the BMI-sds at T1) were modelled for a wide range
of percentiles (as far as the estimable percentiles
below the 5th and above the 95th percentiles).
In addition to the regression analyses, differences in
changes between the intervention and control group regarding the prevalence of weight status (underweight,
normal weight, overweight, and obesity) between T1 and
T4 were examined using a difference in difference approach and tested for statistical significance using independent samples t-test.
All analyses were performed using the SPSS 23.0
software package (Chicago, Illinois, USA), except for
Norman et al. BMC Pediatrics
(2019) 19:104
Page 5 of 11
Table 1 Descriptive characteristics at baseline (T1) categorised by intervention and control group
Total
Intervention
Control
n = 215
n = 97
n = 118
p
n
Mean (SD)
Mean (SD)
Mean (SD)
Girls (%)
49.3
53.6
45.8
0.25
215
Age (years)
6.3 (0.3)
6.3 (0.3)
6.3 (0.3)
0.93
215
Parental low education per family (%)
51.2
50.0
52.3
0.74
203
Parents born outside the Nordic region (%)
87.9
85.3
90.2
0.3
207
Waist circumference (cm)
56.7 (5.9)
56.7 (6.2)
56.6 (5.1)
0.91
215
Body mass index (kg/m2)
16.9 (2.5)
17.0 (2.6)
16.9 (2.5)
0.75
215
Anthropometry
a
BMI sds
0.71 (1.41)
0.75 (1.39)
0.67 (1.43)
0.71
215
Normal weightb (%)
67.0
69.1
65.3
0.56
215
Overweightb (%)
15.3
15.5
15.3
0.97
215
Obese b (%)
11.6
11.3
11.9
0.90
215
6.0
4.1
7.6
0.28
215
129 (71)
127 (74)
130 (68)
0.75
178
47.3
52.4
42.2
0.26
129
Fruit juice1
0.61 (0.73)
0.62 (0.79)
0.6 (0.66)
0.73
148
Soft drink1
0.28 (0.54)
0.24 (0.49)
0.33 (0.58)
0.45
138
0.30 (0.60)
0.21 (0.41)
0.39 (0.73)
0.21
139
1.07 (0.80)
1.01 (0.82)
1.12 (0.77)
0.63
168
Fruits
1.67 (1.0)
1.6 (0.88)
1.76 (1.08)
0.67
175
Snacks (crisps and cheese doodles)1
0.33 (0.66)
0.25 (0.52)
0.41 (0.77)
0.19
157
1
Chocolate/sweets
0.53 (0.74)
0.42 (0.69)
0.64 (0.79)
0.17
165
Ice-cream1
0.52 (0.80)
0.35 (0.59)
0.69 (0.93)
0.08
168
Cake/buns/cookies
0.55 (0.75)
0.48 (0.69)
0.62 (0.79)
0.57
164
Unhealthy foods2
1.77 (2.22)
1.37 (1.94)
2.16 (2.40)
0.05
173
Healthy foods
2.90 (1.56)
2.87 (1.71)
2.92 (1.4)
0.7
177
Unhealthy drinks2
0.61 (1.08)
0.54 (1.15)
0.67 (1.01)
0.37
161
b
Underweight (%)
Screen time
Television/computer time (minutes/day)
Physical activity
Children active in organised activity (%)
Diet (servings the previous day)
Flavoured milk
1
Vegetables1
1
1
2
p = between intervention and control groups
BMI sds: body mass index standard deviation score,
a
Defined according to Karlberg et al. [20]
b
Defined according to Cole et al. [21]
1
Serving sizes (examples below):
Snacks = 1.5 dl of crisps or cheese doodles
Sweets = about 1.5 dl of sweets or 4 pieces from a chocolate bar
Cakes = a small bun or 5 small biscuits
Ice-cream = a small ice cream bar or 1 dl ice-cream
Drinks = 1.5 dl
Vegetables = 2 dl grated carrots/cabbage or a large tomato or 2–3 broccoli heads
Fruits = a small apple or a bunch of grapes (about 10)
2
Aggregated variables: unhealthy foods (snacks, sweets/chocolate, ice-cream, cakes/buns/cookies), healthy foods (fruit and vegetables) and unhealthy drinks (soft
drink, flavoured milk, and fruit juice > 1 serving)
the multilevel analysis where MLwiN (version 2.36,
2014, Bristol University, UK) was used, and the quantile regression analysis where quantreg library of the
statistical package R was used [27]. The level of significance was set to p < 0.05.
Results
The following number of children were included in each
measurement: Baseline (T1) n = 378, post-intervention (T2)
n = 359, five-month follow-up (T3) n = 345, and four-year
follow-up (T4) n = 215. Of the 163 children (intervention
Norman et al. BMC Pediatrics
(2019) 19:104
Page 6 of 11
Table 2 Effects of intervention on dietary intake of indicator foods at T4 (intention to treat analysis)
Dietary intake - Servings1 the previous weekdaya
n
b
p
95% CI
Unadjusted means (SD) at T4 per group
n
Int M (SD)
n
Cont M (SD)
Separate variables
Snacks
109
−0.72
0.09
−1.55 to 0.12
52
0.15 (0.42)
57
0.40 (0.98)
Sweets/Chocolate
118
−0.25
0.41
−0.84 to 0.34
55
0.33 (0.51)
63
0.49 (0.91)
Cakes/Buns/Cookies
116
−0.53
0.07
−1.10 to 0.04
54
0.33 (0.67)
62
0.56 (0.86)
Ice-cream
124
0.03
0.96
−1.22 to 1.28
60
0.08 (0.42)
64
0.09 (0.34)
Soft drink/sugar syrup
87
−0.06
0.90
−0.87 to 0.76
42
0.26 (0.54)
46
0.30 (0.59)
Flavoured milk
84
−0.03
0.90
−1.02 to 0.95
42
0.19 (0.46)
42
0.21 (0.47)
Fruit juice
106
−0.31
0.17
−0.75 to 1.87
52
0.65 (0.84)
54
0.91 (1.17)
Vegetables
124
0.05
0.76
−0.27 to 0.37
60
1.25 (0.88)
64
1.19 (1.07)
Fruits
128
−0.23
0.14
−0.52 to 0.07
60
1.27 (1.13)
68
1.62 (1.21)
60
1.10 (2.12)
66
1.58 (2.0)
58
−0.61
0.03
−1.15 to − 0.61
Aggregated variables2
Unhealthy food
Girls3
Boys3
68
0.09
0.66
−0.31 to 0.49
Unhealthy drink
114
−0.34
0.08
−0.71 to 0.04
56
0.84 (1.33)
58
1.24 (1.62)
Healthy food
133
0.11
0.30
−0.32 to 0.10
64
2.48 (1.59)
69
2.77 (1.90)
Screen timeb
n
b
p
95% CI
63
148.79 (94.26)
70
136.16 (93.51)
Television/computer time (minutes the previous weekday)
132
20.57
0.17
−8.63 to 49.77
Physical activity c
n
OR
p
95% CI
Child active in organised activity
127
1.77
0.16
0.79 to 3.95
a
Results of Poisson regression with adjustment for baseline, sex of child, and parental education (complete cases intention to treat)
b
Results of Linear regression with adjustment for baseline, sex of child, and parental education (complete cases intention to treat)
c
Results of Logistic regression with adjustment for baseline, sex of child, and parental education (complete cases intention to treat)
Subjects are dependent observations between T1 and T4 with valid measurements at T2
Bold - significant p-value < 0.05
b = regression coefficient, estimates of intervention group
OR = odds ratios for the intervention group
1
Serving sizes (examples below):
Snacks = 1.5 dl of crisps or cheese doodles
Sweets = about 1.5 dl of sweets or 4 pieces from a chocolate bar
Cakes = a small bun or 5 small biscuits
Ice-cream = a small ice cream bar or 1 dl ice-cream
Drinks = 1.5 dl
Vegetables = 2 dl grated carrots/cabbage or a large tomato or 2–3 broccoli heads
Fruits = a small apple or a bunch of grapes (about 10)
2
Aggregated variables: unhealthy foods (snacks, sweets/chocolate, ice-cream, cakes/buns/cookies), healthy foods (fruit and vegetables) and unhealthy drinks (soft
drink, flavoured milk, and fruit juice > 1 serving)
3
Stratified analysis due to interaction effect (group × sex)
n = 88, control n = 75) that were lost to follow-up at T4, 20
had moved, 19 declined participation, 11 were not present
at the time of anthropometric measurement, and 113 could
not be contacted or it was not possible to book anthropometric measurements for them. No statistically significant
differences were found regarding characteristics of participants included at T4 (n = 215) and the total sample at (n =
378) at baseline (not shown). Characteristics at baseline for
participants measured at T4 are displayed in Table 1, including the number of respondents for each variable. No
significant differences were found between the intervention
and the control group at T1, but the control group had a
higher intake of unhealthy foods (p = 0.05).
Diet
The parental response rate to the dietary questionnaire
at T4 ranged from 30 to 35% of the total sample at T1
for the different items.
Results of Poisson regression using the complete cases
ITT approach showed a trend towards a healthier intake
of foods and drinks favouring intervention on seven of the
nine single food outcomes and on all aggregated food outcomes, but with no significant effect regarding the entire
intervention group (Table 2). A significant sub-group effect regarding the intake of unhealthy foods was found for
girls in the intervention group who had a lower intake
(b = − 0.61, p = 0.03) at T4 compared to girls in the control
Norman et al. BMC Pediatrics
(2019) 19:104
group. In the sensitivity analysis using multiple imputation
the effect remained in the same direction but was no longer
significant. The multilevel analyses rendered results in the
same direction as the ITT analyses. Analyses per protocol
indicated a stronger, but non-significant, trend favouring
intervention with larger regression coefficients and lower
p-values regarding all food and drink outcomes. In the per
protocol analysis, the intervention effect for girls regarding
unhealthy foods reached statistical significance, as did an
intervention effect on the entire group regarding intake of
unhealthy drinks (n = 88, b = − 0.51, p = 0.04).
Physical activity and screen time
The parental response to the item measuring their
child’s involvement in organised activity at T4 was 34%,
and screen time 35% of the total sample at T1.
Results of linear regression using the complete cases ITT
approach found no significant effects of intervention regarding minutes of screen time per weekday; nor did the
logistic regression find any intervention effects on children’s
involvement in organised activity (Table 2). The multilevel
analyses and per protocol analyses rendered results in the
same direction as the complete cases ITT analyses.
Anthropometry
Height and weight were measured in 57% of the children
at T4 of the sample at T1.
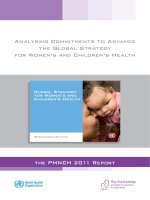
Results of the quantile regression on BMI-sds at T4
compared to T1 are shown in Figs. 1, 2, and 3. The
graphs show the percentiles on the x-axis and the beta
coefficient estimates for the intervention on the y-axis.
A bold line represents the values of the beta coefficient
estimates of the intervention across all the percentiles.
Any point on the bold line above zero expresses a higher
outcome (BMI-sds) for the intervention group compared
to the control group at the corresponding percentile on
the x-axis. The dotted lines are the 95% confidence intervals for the intervention coefficients. For a percentile, the
intervention effect is significant only if the confidence
interval at that percentile does not include the zero-line.
Page 7 of 11
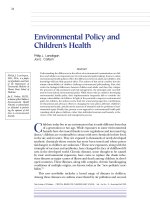
Figure 1 shows the intervention effect for BMI-sds
along all quantiles where no significant effect is seen. A
significant sub-group effect was found where boys in the
intervention group had a higher BMI-sds around the last
deciles compared to boys in the control group (Fig. 2).
The effect remained significant and in the same direction in the sensitivity analysis using multiple imputation.
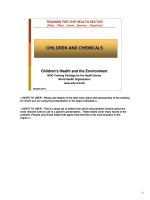
No significant effect was seen among girls (Fig. 3). Analyses per protocol regarding the entire group rendered
effects in the same direction, but somewhat stronger effects with generally greater regression coefficients.
Regarding the difference in prevalence of weight status
(T1–T4), no significant difference was found between
the intervention and control group (Table 3).
Discussion
This long-term follow up of the HSS programme found
no remaining significant intervention effects on dietary,
physical activity, screen time outcomes or proportion of
overweight and obesity 4 years after the intervention.
However, a non-significant trend toward a healthier diet
was found for the intervention group compared to the
control, and a significantly lower intake of unhealthy
food and unhealthy drink was found in the per protocol
analyses. An unfavourable intervention effect was found
regarding BMI-sds for boys over the 95th percentile,
where boys in the intervention group had a significantly
higher BMI-sds compared to boys above the same percentile in the control group. These results indicate that
it is likely that the intervention had a minor influence
on the participants after 4 years. The sub-group effect
on boys previously found regarding a lower intake of unhealthy foods at the five-month follow-up [10] was not
sustained after 4 years. Instead, at T4, a favourable
sub-group effect was found for girls regarding a lower
intake of unhealthy foods, which was not seen at T2 [10]
and nor was it significant in the sensitivity analyses.
However, in the per protocol analysis, the intervention
group showed a significantly healthier dietary intake pattern, suggesting that the intervention had greater
favourable effects in the children whose families had
Fig. 1 Effect of intervention on BMI-sds of the intervention group relative to the control group along the 2th up to the 98th percentiles. Results
of Quantile regression of BMI-sds with adjustment for baseline value, sex of child, and parental education (intention to treat). Subjects are
dependent observations between T1 and T4 with valid measurements at T2. Line represents quantile regression coefficient estimates of
intervention group (with the control group as reference). Grey area represents 95% confidence intervals
Norman et al. BMC Pediatrics
(2019) 19:104
Page 8 of 11
Fig. 2 Effect of intervention on BMI-sds of the intervention group relative to the control group along the 4th up to the 96th percentiles, boys.
Results of Quantile regression of BMI-sds with adjustment for baseline value, sex of child, and parental education (intention to treat). Subjects are
dependent observations between T1 and T4 with valid measurements at T2. Line represents quantile regression coefficient estimates of
intervention group (with the control group as reference). Grey area represents 95% confidence intervals
participated in the intervention to a greater extent. This
finding indicates a positive dose-response relationship
regarding the effects of the intervention. It underlines
the importance of family engagement and compliance
for health promotion and prevention interventions to be
effective in the long term.
There are only a few health promotion or obesity prevention intervention studies with follow-up conducted
as many as 4 years post-intervention with which we can
compare our results. Regarding BMI, a four-year
follow-up was conducted on the randomised controlled
called AVall and was a school-based health education
intervention targeting six-year-old children in Spain
showed a significant BMI reduction with 1.13 kg/m2 for
intervention children compared to controls [28]. The
intervention lasted for 2 years and included health information such as healthy recipes for parents in addition to
health education for children in school. The
six-year-long controlled trial of the Cretan Health and
Nutrition Education Programme, a school-based health
education intervention in Greece, followed children
from the first to the sixth grade [29]. Four years after
the end of the intervention, a favourable intervention effect on BMI was found. In Germany, the school-based
health educational intervention KOPS included five to
seven-year-old children, lasted for 2 to 3 weeks and included an informational group-meeting for parents. The
four-year follow-up study showed no intervention effect
on BMI in the total sample. However, beneficial intervention effects were seen in the group with high SEP
[30], possibly contributing to a greater socioeconomic
gradient in overweight and obesity. A four-year
follow-up was conducted on the 28-month EdAl school-based prevention intervention targeting adolescents (14–
17 years) in Spain. The study found sub-group effects
favouring intervention regarding a lower BMI z-score in
girls and a lower prevalence of obesity in boys [31]. The
intervention included a family component, but targeted
an older age group compared to the HSS study. Regarding
children in Sweden, only one long-term follow-up on a
child obesity prevention intervention has been conducted
to our knowledge. The Swedish PRIMROSE obesity prevention RCT included children at the age of 9 months
and continued until the child was 4 years [32]. The intervention targeted parents, was conducted within the child
health services, and lasted for 39 months. The follow-up
was conducted 1 year after the end of the intervention at
which time no effect on BMI or prevalence of overweight
and obesity was found [32].
Even fewer long-term follow-up studies have included behavioural outcomes regarding physical activity, sedentary
and dietary outcomes. Regarding diet, neither the EdA1,
Cretan Health and Nutrition Education Programme or the
KOPS study found any intervention effects after 4 years
[29–31]. Regarding physical activity, the EdA1 study found
significant intervention effects regarding hours per week in
Fig. 3 Effect of intervention on BMI-sds of the intervention group relative to the control group along the 4th up to the 96th percentiles, girls.
Results of Quantile regression of BMI-sds with adjustment for baseline value, sex of child, and parental education (intention to treat). Subjects are
dependent observations between T1 and T4 with valid measurements at T2. Line represents quantile regression coefficient estimates of
intervention group (with the control group as reference). Grey area represents 95% confidence intervals
Norman et al. BMC Pediatrics
(2019) 19:104
Page 9 of 11
Table 3 Group difference in prevalence of weight status at T4
T1
T4
Intervention (I1) n = 178
Control (C1) n = 181
Intervention (I4) n = 96
Control (C4)n = 113
Difference T1-T4
Weight status (%)
n
%
n
%
n
%
n
%
DD = (I4-I1)-(C4-C1)
Underweight
11
6.2
11
6.1
6
6.3
6
5.3
0.9
0.99
Normal weight
121
67.7
122
67.4
52
54.2
72
63.7
−9,8
0.06
Overweight
30
16.9
25
13.8
26
27.1
24
21.2
2.8
0.71
Obesity
16
9.0
23
12.7
12
12.5
11
9.7
6.5
0.12
a
p
Results of independent samples t-test
DD difference in difference
p = between intervention and control groups
Subjects are dependent observations between T1 and T4 with valid measurements at T2
a
Defined according to Cole et al. [21]
after school physical activity in boys, but the children were
older than those in the HSS study. The Cretan Health and
Nutrition Education Programme found a significantly
higher moderate to vigorous activity in intervention group
boys compared to boys in the control group [33], whereas
no effects were found in the KOPS study [30].
Taken together, previous four-year follow-up studies of
child health promotion and obesity prevention interventions mainly used health education targeting parents or
children, and seldom included behavioural outcomes.
Notably, all interventions showing effects 4 years after
the end of intervention were conducted over several
years [28, 29, 31, 33]. Systematic reviews of successful
health promotion and obesity prevention interventions
for younger children, regardless of long-term measurements, demonstrate active and extensive involvement by
parents [6, 34] including face-to-face counselling [18],
identification of barriers, self-monitoring, restructuring
of the home environment, and goal-setting [34]. This is
particularly true for families with low SEP [35] where
the importance of prevention is greater compared to the
general population. Furthermore, implementation studies have shown that successful adoption of interventions
in clinics or institutions such as schools rely on the
intervention being integrated into routine practice, and
that the intervention activities facilitate the work of
clinicians or teachers, who often experience a stressful
and exacting work day. In addition, it is also important
that the intervention can be adapted to the needs of providers and the target group [36–38]. The HSS intervention included face- to face counselling using MI where
parents had the opportunity to identify barriers, the
need for changes in the home, and setting goals in line
with techniques found in other effective interventions
[18, 34]. However, taken together, the three intervention
components of the HSS intervention had a greater focus
on knowledge about diet and activity, thus health education, than on healthy behaviours related to interaction
and positive parenting around the food and physical activity in the family. A conclusion from a previous
qualitative study on the target group found a need for
increased focus on family interplay to possibly increase
intervention effects [39]. Furthermore, the HSS intervention was limited to pre-school classes with an intervention period of only 5 months and the MI sessions were
conducted by external counsellors, not by the school
staff themselves. Based on extensive research,
school-based parental support interventions are a promising route forward, but there is a need for programmes
like the HSS to be extended over several years, and for
family engagement to be increased, and to be fully integrated into the routine practice of school health care
staff and teachers. Furthermore, future long-term
follow-up studies of such interventions should include
behaviour outcomes in addition to weight-related ones.
Strengths and limitations
The use of quantile regression for analysing the BMI-sds
comprises a strength of the study, since it allows for estimating differential effects for a wide spectrum of the BMI-sds
scale rather than estimating the single point of the mean of
BMI-sds, as is the case with least squares linear regression.
In addition, quantile regression is more robust in the presence of outliers and problems with heteroscedasticity [40].
Furthermore, the inclusion of behavioural outcomes in
addition to BMI constitutes a strength of the study, as this
is rarely reported in long-term follow-up studies.
The main limitation of this study is the high attrition
rate. We tried to compensate for this by performing
various types of analyses including sensitivity analysis.
The difficulty in retaining participants over long measurement periods comprises one of the greatest challenges to long-term follow-up [12]. However, 57% (n =
215) of the original participants, of whom the majority
had a low parental educational level and whose parents
were born outside the Nordic region, were retained,
which is known to be a challenge [41, 42]. In the light of
other long-term follow-up studies targeting families with
low SEP, the retention rate was 59% in a one-year
Norman et al. BMC Pediatrics
(2019) 19:104
Page 10 of 11
follow-up study on children in Israel [13], and 73% on a
two-year follow-up study in children in the USA [14].
Received: 10 January 2019 Accepted: 22 March 2019
Conclusion
Four years after the intervention, only sub-group effects
were found, and it is unlikely that the five-month HSS
intervention had clinically meaningful effects on the children 4 years after its completion. These results suggest that
school-based health promotion and prevention programmes need to be extended in order to be effective
long-term by e.g. integrating activities into school routine
practice. In addition, results indicated that children of parents who had participated in the MI sessions had better
long-term outcomes compared to controls, suggesting a
dose-response relationship. This finding emphasises that
further work to increase family engagement over time is
also needed.
References
1. Afshin A, Forouzanfar MH, Reitsma MB, Sur P, Estep K, Lee A, et al. Health
effects of overweight and obesity in 195 countries over 25 years. N Engl J
Med. 2017;377(1):13–27.
2. Rokholm B, Baker JL, Sorensen TI. The levelling off of the obesity epidemic
since the year 1999--a review of evidence and perspectives. Obes Rev. 2010;
11(12):835–46.
3. Moraeus L, Lissner L, Yngve A, Poortvliet E, Al-Ansari U, Sjoberg A. Multilevel influences on childhood obesity in Sweden: societal factors, parental
determinants and child's lifestyle. Int J Obes. 2012;36(7):969–76.
4. Li X, Memarian E, Sundquist J, Zoller B, Sundquist K. Neighbourhood
deprivation, individual-level familial and socio-demographic factors and
diagnosed childhood obesity: a nationwide multilevel study from Sweden.
Obes Facts. 2014;7(4):253–63.
5. Singh AS, Mulder C, Twisk JW, van Mechelen W, Chinapaw MJ. Tracking of
childhood overweight into adulthood: a systematic review of the literature.
Obes Rev. 2008;9(5):474–88.
6. Van Lippevelde W, Verloigne M, De Bourdeaudhuij I, Brug J, Bjelland M, Lien
N, et al. Does parental involvement make a difference in school-based
nutrition and physical activity interventions? A systematic review of
randomized controlled trials. Int J Public Health. 2012;57(4):673–8.
7. Waters E, de Silva‐Sanigorski A, Burford BJ, Brown T, Campbell KJ, Gao Y,
Armstrong R, Prosser L, Summerbell CD. Interventions for preventing
obesity in children. Cochrane Database Syst Rev. 2011(12):CD001871.
/>8. Nyberg G, Sundblom E, Norman A, Elinder LS. A healthy school start parental support to promote healthy dietary habits and physical activity in
children: design and evaluation of a cluster-randomised intervention. BMC
Public Health. 2011;11:185.
9. Nyberg G, Sundblom E, Norman A, Bohman B, Hagberg J, Elinder LS.
Effectiveness of a universal parental support Programme to promote
healthy dietary habits and physical activity and to prevent overweight and
obesity in 6-year-old children: the healthy school start study, a clusterrandomised controlled trial. PLoS One. 2015;10(2):e0116876. />10.1371/journal.pone.0116876.
10. Nyberg G, Norman A, Sundblom E, Zeebari Z, Elinder LS. Effectiveness of a
universal parental support programme to promote health behaviours and
prevent overweight and obesity in 6-year-old children in disadvantaged
areas, the healthy school start study II, a cluster-randomised controlled trial.
Int J Behav Nutr Phys Act. 2016;13(1):4.
11. Ling J, Robbins LB, Wen F. Interventions to prevent and manage
overweight or obesity in preschool children: a systematic review. Int J Nurs
Stud. 2016;53:270–89.
12. Jones RA, Sinn N, Campbell KJ, Hesketh K, Denney-Wilson E, Morgan PJ, et
al. The importance of long-term follow-up in child and adolescent obesity
prevention interventions. Int J Pediatr Obes. 2011;6(3–4):178–81.
13. Nemet D, Geva D, Pantanowitz M, Igbaria N, Meckel Y, Eliakim A. Long term
effects of a health promotion intervention in low socioeconomic ArabIsraeli kindergartens. BMC Pediatr. 2013;13(1):45.
14. Fitzgibbon ML, Stolley MR, Schiffer L, Van Horn L, KauferChristoffel K, Dyer A.
Two-year follow-up results for hip-hop to health Jr.: a randomized
controlled trial for overweight prevention in preschool minority children. J
Pediatr. 2005;146(5):618–25.
15. Annual report on child health care (In Swedish: Barnhälsovårdens
årsrapport). Stockholm: Stockholm County Council; 2013.
16. Bandura A. Social foundations of thought and action: a social cognitive
theory. Englewood Cliffs: Prentice-Hall, Inc; 1986.
17. Hingle MD, O'Connor TM, Dave JM, Baranowski T. Parental involvement in
interventions to improve child dietary intake: a systematic review. Prev Med.
2010;51(2):103–11.
18. Kader M, Sundblom E, Elinder LS. Effectiveness of universal parental support
interventions addressing children's dietary habits, physical activity and
bodyweight: a systematic review. Prev Med. 2015;77:52–67.
19. Bennett CA, de Silva-Sanigorski AM, Nichols M, Bell AC, Swinburn BA.
Assessing the intake of obesity-related foods and beverages in young
children: comparison of a simple population survey with 24 hr-recall. Int J
Behav Nutr Phys Act. 2009;6:71.
Abbreviations
BMI-sds: Body Mass Index standard deviation score; HSS: Healthy School
Start; ITT: Intention to treat; SEP: Socioeconomic position
Acknowledgements
We wish to thank all the families and teachers who participated in this study.
We would also like to thank Susanne Arnetz Linder and My Sjunnestrand
who collected the data.
Funding
This study was funded by Skandia Insurance, the Martin Rind Foundation,
and the Sven Jerring Foundation.
Availability of data and materials
The datasets used and/or analysed during the current study are available
from the corresponding author on reasonable request.
Authors’ contributions
LSE, ÅN, and GN developed the study design. ÅN and ZZ performed the
statistical analyses. ÅN drafted the manuscript. All authors contributed to the
writing of the manuscript and approved the final manuscript.
Ethics approval and consent to participate
Informed consent was, written consent was collected from all parents of
participating children. Ethical approval has been granted to the study by the
Regional Ethical Review Board in Stockholm, Sweden (2012/877–31/5).
Consent for publication
Not applicable.
Competing interests
The authors declare that they have no competing interests.
Publisher’s Note
Springer Nature remains neutral with regard to jurisdictional claims in
published maps and institutional affiliations.
Author details
1
Department of Public Health Sciences, Karolinska Institutet, 171 77
Stockholm, Sweden. 2Jönköping International Business School, Gjuterigatan
5, Box 1026, 551 11 Jönköping, Sweden. 3The Swedish School of Sport and
Health Sciences, Lidingövägen 1, 114 33 Stockholm, Sweden. 4Centre for
Epidemiology and Community Medicine, Stockholm County Council, Box
1497, 171 29 Solna, Sweden.
Norman et al. BMC Pediatrics
(2019) 19:104
20. Karlberg J, Luo ZC, Albertsson-Wikland K. Body mass index reference values
(mean and SD) for Swedish children. Acta Paediatr. 2001;90(12):1427–34.
21. Cole TJ, Lobstein T. Extended international (IOTF) body mass index cut-offs
for thinness, overweight and obesity. Pediatr Obes. 2012;7(4):284–94.
22. Galobardes B, Shaw M, Lawlor DA, Lynch JW, Davey Smith G. Indicators of
socioeconomic position (part 2). J Epidemiol Community Health. 2006;60(2):95–101.
23. Galobardes B, Shaw M, Lawlor DA, Lynch JW, Davey Smith G. Indicators of
socioeconomic position (part 1). J Epidemiol Community Health. 2006;60(1):7–12.
24. Ministry of Employment Sweden. Urban Development Areas (In Swedish:
Urbana utvecklingsområden. Statistisk uppföljning utifrån sju indikatorer).
Stockholm; 2012. Contract No.: Dnr A2012/4115/IU.
25. Little RJ, D'Agostino R, Cohen ML, Dickersin K, Emerson SS, Farrar JT, et al.
The prevention and treatment of missing data in clinical trials. N Engl J
Med. 2012;367(14):1355–60.
26. Liu Y, De A. Multiple imputation by fully conditional specification for
dealing with missing data in a large epidemiologic study. Int J Stat Med
Res. 2015;4(3):287–95.
27. Koenker RW. Quantreg: Quantile Regression. R Package Version 5·35. 2006.
. Accessed 20 Nov 2018.
28. Mora T, Llargues E, Recasens A. Does health education affect BMI? Evidence
from a school-based randomised-control trial. Econ Hum Biol. 2015;17:190–201.
29. Manios Y, Kafatos A. Health and nutrition education in primary schools in
Crete: 10 years follow-up of serum lipids, physical activity and
macronutrient intake. Br J Nutr. 2006;95(3):568–75.
30. Plachta-Danielzik S, Pust S, Asbeck I, Czerwinski-Mast M, Langnase K, Fischer
C, et al. Four-year follow-up of school-based intervention on overweight
children: the KOPS study. Obesity (Silver Spring, Md). 2007;15(12):3159–69.
31. Llaurado E, Tarro L, Moriea D, Aceves-Martins M, Giralt M, Sola R. Follow-up
of a healthy lifestyle education program (the EdAl study): four years after
cessation of randomized controlled trial intervention. (clinical report). BMC
Public Health. 2018;18:104. />32. Enö Persson J, Bohman B, Tynelius P, Rasmussen F, Ghaderi A. Prevention of
childhood obesity in child health services: follow-up of the PRIMROSE trial.
Childhood Obesity. 2018;14(2):99–105.
33. Manios Y, Kafatos I, Kafatos A. Ten-year follow-up of the Cretan health and
nutrition education program on children's physical activity levels. Prev Med.
2006;43(6):442–6.
34. Golley RK, Hendrie GA, Slater A, Corsini N. Interventions that involve parents
to improve children's weight-related nutrition intake and activity patterns what nutrition and activity targets and behaviour change techniques are
associated with intervention effectiveness? Obes Rev. 2011;12(2):114–30.
35. Laws R, Campbell KJ, van der Pligt P, Russell G, Ball K, Lynch J, et al. The impact
of interventions to prevent obesity or improve obesity related behaviours in
children (0-5 years) from socioeconomically disadvantaged and/or indigenous
families: a systematic review. BMC Public Health. 2014;14:779.
36. Norman A, Nyberg G, Elinder LS, Berlin A. One size does not fit allqualitative process evaluation of the healthy school start parental support
programme to prevent overweight and obesity among children in
disadvantaged areas in Sweden. BMC Public Health. 2016;16(1):37.
37. Damschroder LJ, Aron DC, Keith RE, Kirsh SR, Alexander JA, Lowery JC.
Fostering implementation of health services research findings into practice:
a consolidated framework for advancing implementation science.
Implement Sci. 2009;4:50.
38. Bergström H, Sundblom E, Elinder L, Norman A, Nyberg G. Managing
implementation of a parental support programme for obesity prevention in
the school context – the importance of creating commitment in an
overburdened work situation, a qualitative study. 2018. Under revision in
Child Health.
39. Norman A, Berlin A, Sundblom E, Elinder LS, Nyberg G. Stuck in a vicious
circle of stress. Parental concerns and barriers to changing children's dietary
and physical activity habits. Appetite. 2014;87C:137–42.
40. Koenker R, Bassett G. Robust tests for heteroscedasticity based on
regression quantiles. Econometrica. 1982;50(1):43–61.
41. Zeller M, Kirk S, Claytor R, Khoury P, Grieme J, Santangelo M, et al. Predictors
of attrition from a pediatric weight management program. J Pediatr. 2004;
144(4):466–70.
42. Cui Z, Seburg EM, Sherwood NE, Faith MS, Ward DS. Recruitment and
retention in obesity prevention and treatment trials targeting minority or
low-income children: a review of the clinical trials registration database.
Trials. 2015;16(1):564.
Page 11 of 11