Comparison of various anthropometric indices in predicting abdominal obesity in Chinese children: A cross-sectional study
Bạn đang xem bản rút gọn của tài liệu. Xem và tải ngay bản đầy đủ của tài liệu tại đây (783.35 KB, 7 trang )
Chen et al. BMC Pediatrics
(2019) 19:127
/>
RESEARCH ARTICLE
Open Access
Comparison of various anthropometric
indices in predicting abdominal obesity in
Chinese children: a cross-sectional study
Gengdong Chen1, Huanchang Yan2, Yuting Hao2, Shiksha Shrestha2, Jue Wang2, Yan Li2, Yuanhuan Wei2,
Jialiang Pan3* and Zheqing Zhang2*
Abstract
Background: Former evidence regarding reference values of abdominal fat percentage (AFP) and optimal
anthropometric indicators in predicting abdominal obesity measured by dual-energy X-ray absorptiometry
(DXA) scan in Chinese children were scarce.
Methods: A total of 452 Chinese children aged 6–9 years were included in this cross-sectional study. Abdominal fat
and lean mass were measured by a DXA scan, and AFP were calculated. Anthropometric indicators including body
mass index (BMI), chest circumference (CC), waist circumference (WC) and hip circumference (HC) were measured,
waist-to-hip ratio (WHR), waist-to-height ratio (WHtR) was also calculated.
Results: By defining abdominal obesity as those with an AFP ≥ 85th percentile, the cutoffs values are 24.80, 30.29, 31.58,
31.86% in boys, and 25.02, 30.32, 31.66, 31.79% in girls, for children aged 6, 7, 8, and 9 years old, respectively. All
anthropometric indicators were independently and positively associated with AFP (P all < 0.01). In girls, BMI was
found to be the optimal predictors of childhood abdominal obesity. The values of area under curves (AUCs) were
significantly higher (P all < 0.05) than other anthropometric indicators, except for WHtR (AUCs value: 0.886). However, in
boys, WHtR instead of BMI, provided the largest AUCs value (0.922) in predicting abdominal obesity, followed by BMI
((AUCs value: 0.913).
Conclusion: This study provides reference values of AFP measured by DXA in Chinese children aged 6–9 years.
BMI and WHtR tend to be the optimal anthropometric indicators in predicting abdominal obesity in Chinese girls and
boys, respectively.
Keywords: Abdominal obesity, Fat percentage, Anthropometric indicators, Children, Chinese
Background
Childhood obesity has been increasing with an alarming
rate globally and becoming one of the crucial medical
issues threatening public health [1]. Extensive evidence
indicates that obesity, especially abdominal obesity during childhood was associated with increased risks of metabolism syndrome [2], diabetes [3], and cardiovascular
* Correspondence: ;
3
Department of Hygiene Detection Center, Guangdong Provincial Key
Laboratory of Tropical Disease Research, School of Public Health, Southern
Medical University, Guangzhou 510515, China
2
Department of Nutrition and Food Hygiene, Guangdong Provincial Key
Laboratory of Tropical Disease Research, School of Public Health, Southern
Medical University, Guangzhou 510515, China
Full list of author information is available at the end of the article
disease [4]. In 2015, 107.7 million children were obese
worldwide; the overall prevalence was 5.0% [5]. While in
China, the prevalence had been dramatically increased
for overweight and obesity (from 5.0% to 19.2% during
1985 to 2010) [6], and especially for abdominal obesity
(from 4.9% to 11.7% during 1993 to 2009) in children
and adolescents aged < 18 years [7]. However, most of
the previous studies used anthropometric indicators, like
body mass index (BMI) or waist circumference (WC),
for defining abdominal obesity, which might increase the
possibility of misclassification since these indicators
could not distinguish fat and lean mass precisely.
Dual-energy X-ray absorptiometry (DXA) scans can provide direct and accurate measurement of the abdominal
© The Author(s). 2019 Open Access This article is distributed under the terms of the Creative Commons Attribution 4.0
International License ( which permits unrestricted use, distribution, and
reproduction in any medium, provided you give appropriate credit to the original author(s) and the source, provide a link to
the Creative Commons license, and indicate if changes were made. The Creative Commons Public Domain Dedication waiver
( applies to the data made available in this article, unless otherwise stated.
Chen et al. BMC Pediatrics
(2019) 19:127
fat mass and distribution, and has been validated to
be highly correlated with gold standards, like computed
tomography [8], and magnetic resonance imaging [9].
However, until now, there is still lack of standardized cutoff value assessed by DXA to define abdominal obesity in
Chinese children of early age.
Besides, most of the literature relies on BMI [10, 11], WC
[12], waist-to-hip ratio (WHR) [13, 14] and waist-to-height
ratio (WHtR) [10, 15, 16], to estimate the abdominal fat
distribution. While few studies show relationship between other anthropometric parameters, like chest circumference (CC) and hip circumference (HC), and
abdominal obesity [17, 18]. However, among a variety
of anthropometric indicators, the most optimal one for
predicting abdominal fat in Chinese children was still
less clear.
Therefore, the objective of this study was to investigate the reference percentile curves for abdominal fat
percentage (AFP) and to compare various anthropometric indicators (BMI, CC, WC, HC, WHR, and
WHtR) in predicting abdominal obesity among children
aged 6–9 years in China.
Methods
Study population
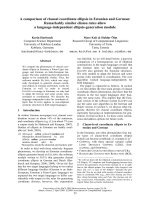
This cross-sectional study included 452-singleton birth
children (255 boys and 197 girls) aged 6–9 years, who were
Fig. 1 Flow chart of study participants
Page 2 of 7
recruited in urban Guangzhou, China, during December
2015 and March 2017. Two different ways were taken for
the recruitment. One was by sending invitation letters with
detailed criteria of inclusion and exclusion to several primary schools. 315 from a total of 1394 children responded
and agreed to participate in the study. Another 206 children
were enrolled through advertisements and referrals,
bringing the total responding number to enroll to 521.
We restricted the study to healthy, full-term singleton
children aged 6–9 years, and subjects with the following
criteria were excluded: twins (12); born pretermly (25);
exposure to related medical conditions (12) that might
have interfered with growth, including digestive tract
disease, kidney stones or nephritis, thyrotoxicosis, hepatitis, anaphylactoid purpura, metabolic bone disease; Core
data unavailable (20); Therefore, a total of 452 children
aged 6–9 years were included in the final analyses (Fig. 1).
All subjects were invited for physical examination.
Anthropometry
Height and weight were measured with subjects in light
clothing and shoes-off in standing position using a
standard stadiometer and a Tanita MC-780A (Tanita
Corporation, Tokyo, Japan) and accurate to 0.1 cm or kg.
CC, WC, and HC were measured using inelastic tape
around the same anatomical sites. Height, CC, WC, HC
were measured to the nearest 0.1 cm and weight to the
(2019) 19:127
Chen et al. BMC Pediatrics
Page 3 of 7
nearest 0.1 kg. All these measurements were operated
twice, or thrice if differences larger than 2 cm was
found, and the averages were calculated. BMI was
calculated as weight (kg)/height square (m2). WHR was
calculated as WC (cm)/HC (cm). WHtR was calculated
as WC (cm)/height (cm).
DXA scans
Abdominal fat and lean mass were measured with a
whole-body DXA scanner (Discovery W; Hologic Inc.,
Waltham, MA, USA), and analyzed by the same experienced technician. Subjects wore only light clothing
without metal or objects with high density, and hold the
standard posture with the guide of technician during the
scan. For quality control, a spine phantom was used for
daily correction before formal scans. The coefficient of
variation between two consecutive measurements with
repositioning among 35 random selected children in the
same day was 2.54% for abdominal fat mass.
Statistical analysis
The data from boys and girls were analyzed separately
and presented as Mean ± standard deviation (SD) for the
continuous variables and as frequencies and percentages
for the categorical variables. Student’s t test was used to
ascertain the significance of the difference in the continuous variables between boys and girls.
We calculated age- and sex-specific Z-scores and established age- and sex-specific reference values for AFP using
LMSChartmaker 2.54 (Medical Research Council, London,
UK). AFP values of each child were compared with corresponding, newly developed age- and sex-specific reference values to estimate Z-scores and percentiles.
Multivariate linear regression models were operated to
examine the agreement between AFP and Z-scores for
BMI, CC, WC, HC, WHR and WHtR after adjusting for
age (six pairs), stratified by sex. Area under the receiver-operating characteristic (ROC) curves were drawn with the
help of MedCalc® version 11.4.2.0 for Windows for estimating the screening of abdominal obesity (AFP ≥ 85th percentile) by using different anthropometric measures,
stratified by sex. Values of area under curve (AUC) were
estimated. Other analyses were operated using IBM SPSS
20.0 (Chicago, IL, USA) and a two-side P value of < 0.05
was considered statistically significant.
Results
Characteristics of subjects
The characteristics of subjects are shown in Table 1. The
study included 255 (56.4%) boys and 197 (43.6%) girls.
The mean ages were 7.97 ± 0.91 years for boys and 8.06 ±
0.95 years for girls. The prevalence of abdominal obesity is
20.4% in boys and 16.8% in girls. Compared with girls,
boys tend to have higher values of weight, BMI, CC, WC,
WHR and WHtR (P all < 0.05). No differences were found
in average age, height, HC and AFP between boys and
girls (P > 0.05).
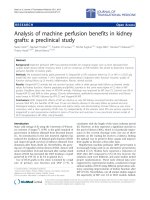
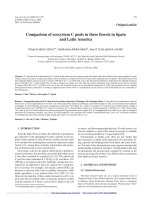
AFP percentile curves
The reference percentile curves derived for AFP for boys
and girls by age are illustrated in Figs. 2 and 3. Growth
curves providing the 5th, 10th, 25th, 50th, 75th, 85th, 90th,
95th centiles for AFP in boys and girls and equivalent percentile values are given in Table 2. The AFP of participants
used to classify as abdominal obesity (AFP ≥ 85th percentile). The cutoff values of AFP in defining abdominal
obesity among children aged 6, 7, 8, 9 years old are 24.80,
30.29, 31.58, and 31.86%, respectively in boys and 25.02,
30.32, 31.66, and 31.79%, respectively in girls.
Table 1 Selected characteristics of the study population
Variables
Boys
Age (years)
Girls
Total
Obesity (n = 52)
Non-obesity (n = 203)
Total
(n = 255)
Obesity (n = 33)
Non-obesity (n = 164)
Total
(n = 197)
P-value
8.17 ± 1.03
7.92 ± 0.88
7.97 ± 0.91
7.88 ± 0.97
8.10 ± 0.95
8.06 ± 0.96
0.285
Height (m)
***
1.34 ± 0.09
1.28 ± 0.08
1.29 ± 0.08
1.30 ± 0.08
1.28 ± 0.08
1.28 ± 0.08
0.679
Weight (kg)
37.1 ± 10.4***
24.8 ± 4.58
27.3 ± 7.93
31.4 ± 6.47***
24.1 ± 4.43
25.3 ± 5.53
0.002
2
BMI (kg/m )
***
20.4 ± 3.77
15.1 ± 1.66
16.2 ± 3.09
***
18.3 ± 2.18
14.6 ± 1.44
15.2 ± 2.10
< 0.001
CC (cm)
70.5 ± 9.59***
59.1 ± 4.05
61.4 ± 7.26
64.8 ± 5.85***
57.5 ± 3.94
58.7 ± 5.10
< 0.001
***
WC (cm)
***
68.8 ± 10.5
54.4 ± 4.58
57.4 ± 8.52
61.5 ± 6.85
52.8 ± 4.16
54.2 ± 5.71
< 0.001
HC (cm)
77.1 ± 9.18***
64.2 ± 5.36
66.8 ± 8.17
72.8 ± 6.30***
64.2 ± 5.16
65.6 ± 6.25
0.07
WHR
***
0.89 ± 0.05
0.85 ± 0.04
0.86 ± 0.04
0.84 ± 0.05
0.82 ± 0.04
0.83 ± 0.05
< 0.001
WHtR
0.51 ± 0.06***
0.42 ± 0.03
0.44 ± 0.05
0.47 ± 0.04***
0.41 ± 0.03
0.42 ± 0.04
< 0.001
23.7 ± 7.43
***
22.8 ± 4.39
24.9 ± 6.48
0.08
AFP (%)
***
35.5 ± 5.07
20.7 ± 4.24
*
35.3 ± 5.15
BMI Body Mass Index, CC Chest Circumference, HC Hip Circumference, WC Waist Circumference, WHR Waist-to-Hip Ratio, WHtR Waist-to-Height Ratio, AFP
Abdominal fat percentage
a
test for differences between boys and girls. *: P < 0.05; **: P < 0.01; ***: P < 0.001 compared with the non-obesity groups
a
Chen et al. BMC Pediatrics
(2019) 19:127
Page 4 of 7
Fig. 2 Reference percentile curves of abdominal fat percentage for boys
Fig. 3 Reference percentile curve of abdominal fat percentage for girls
Table 2 Smoothed percentiles for abdominal fat percentage among boys and girls aged 6–9 years
Age
(years)
Percentile for boys (%)
5th
10th
25th
50th
75th
85th
90th
95th
5th
Percentile for girls (%)
10th
25th
50th
75th
85th
90th
95th
6
17.57
18.12
19.20
20.78
23.06
24.80
26.34
29.57
17.86
18.38
19.42
20.96
23.23
25.02
26.67
30.38
7
16.83
17.95
20.17
23.31
27.46
30.29
32.53
36.46
16.61
17.78
20.09
23.31
27.50
30.32
32.51
36.30
8
16.27
17.69
20.44
24.13
28.69
31.58
33.75
37.30
16.35
17.75
20.45
24.13
28.72
31.66
33.88
37.56
9
16.07
17.61
20.55
24.41
29.02
31.86
33.94
37.29
16.17
17.70
20.60
24.42
28.98
31.79
33.85
37.17
Chen et al. BMC Pediatrics
(2019) 19:127
Page 5 of 7
Relationships between age-adjusted anthropometric
indicators and AFP
Regression coefficient (β) between age-adjusted anthropometric indicators and AFP were shown in Table 3.
All anthropometric indicators were significantly and
positively associated with AFP. BMI tend to provide the
largest coefficients in girls but not in boys. Per one SD
increase of relative anthropometric indicators, AFP
increased by 3.173% to 6.632% in boys and 1.634% to
5.111% in girls.
Performance of anthropometric measures
AUC was used to evaluate the performance of each anthropometric indicator for the screening of abdominal
obesity (AFP ≥ 85th) by sex. As shown in Table 4, BMI
and WHtR exhibited the largest AUC in both boys
(AUC = 0.913 and 0.922) and girls (AUC = 0.925 and
0.886). For other indicators (CC, WC, HC, WHR), AUC
values ranged from 0.744 to 0.898 in boys and from
0.605 to 0.869 in girls. Significant higher AUC were
found for BMI compared to other indicators expect for
WHtR in girls (P < 0.01), and CC and WHR, but not
WC, HC, WHtR in boys. For both boys and girls, WHR
performed were poorest in predicting abdominal obesity
by providing least AUC values (0.744 in boys and 0.605
in girls), which were significantly lesser than those
observed for BMI or WHtR (P < 0.001).
Discussion
According to our knowledge, this is the first study to
develop age- and gender-specific reference percentiles for
AFP measured by DXA for Chinese children. Besides, we
further found that BMI and WHtR, compared with other
indicators, performed optimally in predicting abdominal
obesity in Chinese girls and boys, respectively.
Former evidence had indicated that obesity; especially
abdominal obesity in early childhood might increase the
risk of later chronic diseases [4–7]. It is important to
Table 3 Relationships of age-adjusted physical indicators for
assessing abdominal fat percentage in boys and girls
Variables
Boys
Girls
β (%)
b
β (%)
P value
β a (%)
β b (%)
P value
BMI
6.209
0.835
< 0.001
5.111
0.789
<0.001
CC
6.389
0.860
< 0.001
4.781
0.738
<0.001
WC
6.379
0.858
< 0.001
4.854
0.749
<0.001
a
HC
6.632
0.892
< 0.001
4.994
0.770
<0.001
WHR
3.173
0.427
< 0.001
1.634
0.252
0.001
WHtR
5.845
0.786
< 0.001
4.861
0.750
<0.001
Per one standard deviance increase of anthropometric indicators
BMI Body Mass Index, CC Chest Circumference, HC Hip Circumference, WC
Waist Circumference, WHR Waist-to-Hip Ratio, WHtR Waist-to-Height Ratio
a
: unstandardized regression coefficients . b: standardized
regression coefficients
explore the reference values of the abdominal obesity
measured by more precisely methods, like DXA. However,
the corresponding reference values had not been established in Chinese children before. Using the available data,
we filled the gap on this field. Besides, considering attenuated time and economic expenditure, it would be
of great utility value to investigate the most optimal
anthropometric indicators correlated with abdominal
obesity measured by DXA, when applied in large epidemiology surveys.
In our study, we observed that BMI tend to be the optimal indicator of abdominal obesity in young Chinese
children aged 6–9 years, especially in girls. In consistent
with our results, several studies showed BMI was highly
correlated to abdominal fat. Dencker et al. found strong
correlation between BMI and abdominal fat mass in
Swedish children (r = 0.93–0.95) [19]. Moreover, based
on Japanese children population, BMI was also recommended as a screening tool to identify abdominal adiposity. The researchers suggested that the optimal cut-off
values for BMI were 20 kg/m2 for boys (sensitivity:
100%, specificity: 90%) and 19 kg/m2 for girls (sensitivity:
100%, specificity: 90%) [10]. However, there are other
studies that claim BMI might give less indication of fat
distribution [6, 20, 21], and might be interfered by fat
free mass [22]. Accordingly, few studies suggested that
the measurement of BMI was needed in addition to WC
[6] or WHtR [19]. Former evidence indicated WC [10,
23–26] and WHtR [10, 20] as good indicators in predicting abdominal obesity in children, however, BMI was
more superior compared with WC in girls and not different with WHtR in predicting childhood abdominal
obesity in our study. The divergent conclusions might be
sources from the difference of population studied. Children in China and Japan tend to be with lower BMI or
obesity degree than those from the western countries.
Therefore, relative less fat is deposited at the abdomen,
and then might attenuate the utility of WC and related
indicators, especially in children. More studies were
needed for better illustration of the problem.
WHR was found as a poor predictor of childhood
abdominal obesity in our study, the results were consistent with several other studies [23, 25] . Taylor et al.
showed that WHR was poorly associated with central
adiposity [25]. The use of WHR to assess abdominal
obesity in children might not be appropriate because
this ratio is highly age dependent [27]. Our results together with former evidence, suggested that WHR
might be of less value in predicting abdominal obesity
in children.
One of the strengths of this study was that we provided
the first reference data of AFP based on Chinese children
aged 6–9 years. Additionally, by comparing several anthropometric indicators, we found that BMI and WHtR tended
Chen et al. BMC Pediatrics
(2019) 19:127
Page 6 of 7
Table 4 Comparison of the Receivers Operator Characteristic curves for various anthropometric indices in predicting abdominal
obesity
Variables
Boys
Girls
AUC
95% CI
Sensitivity (%)
Specificity (%)
P value a
P value
BMI
0.913
0.872, 0.945
73.1
95.1
–
0.542
CC
0.870
0.822, 0.908
76.9
85.2
0.017
0.041
WC
0.898
0.854, 0.932
78.9
87.2
0.307
0.247
HC
0.882
0.836, 0.919
69.2
92.6
0.057
0.114
WHR
0.744
0.686, 0.796
59.6
76.4
< 0.001
< 0.001
WHtR
0.922
0.882, 0.952
80.8
88.7
0.542
–
BMI
0.925
0.879, 0.958
90.9
87.6
–
0.217
CC
0.852
0.794, 0.898
72.7
86.0
0.007
0.472
WC
0.863
0.807, 0.908
69.7
88.4
0.006
0.431
HC
0.869
0.814, 0.913
87.9
76.2
0.006
0.712
WHR
0.605
0.533, 0.674
36.4
86.6
< 0.001
< 0.001
WHtR
0.886
0.833, 0.926
81.8
80.5
0.217
–
b
BMI Body Mass Index, CC Chest Circumference, HC Hip Circumference, WC Waist Circumference, WHR Waist-to-Hip Ratio, WHtR Waist-to-Height Ratio
a:
Compared with BMI. b: Compared with WHtR
to perform optimally in predicting childhood abdominal
obesity, which might provide more specific guidance for
large epidemiology surveys focus on childhood obesity.
There were also several limitations in our study. Firstly, due
to the absence of standard cut-off for AFP in Chinese
children, we used the 85% value as a cut-off to determine
abdominal obesity. However, this cut-off value might
be likely to differ in different populations. Secondly,
with the cross-sectional design, we fail to investigate
the best anthropometric indicators in predicting the
dynamic trajectory of abdominal obesity in children.
Thirdly, the study was based on a relatively small
sample of children with a limited age range; more
studies with large samples and wider age range were
needed to reexamine our results. Lastly, the measurement of neck circumference and sexual development
assessment were not performed in the study. Therefore, we could not perform further analyses on these
fields, which were encouraged to be involved in further studies.
Conclusions
We present the first reference data for AFP in Chinese
children aged 6–9 years. Compared with other anthropometric indicators, BMI and WHtR tend to perform
optimally in predicting childhood abdominal obesity.
Abbreviations
AFP: Abdominal fat percentage; AUC: Area under curve; BMI: Body mass
index; CC: Chest circumference; DXA: Dual-energy X-ray absorptiometry;
HC: Hip circumference; SD: Standard deviation; WC: Waist circumference;
WHR: Waist-to-hip ratio; WHtR: Waist-to-height ratio
Acknowledgements
The authors would like to thank all research members involved in the data
collection of the study.
Funding
This work was funded by National Natural Science Foundation of China
(No.81502798), Natural Science Foundation of Guangdong Province,
China (No.2015A030310399), and The Maternal and Children Nutrition
and Care Fund of Biostime (No.BINCMYF15006). The funding sponsors
had no role in the design of the study; in the collection, analyses, or
interpretation of data; in the writing of the manuscript, and in the
decision to publish the results.
Availability of data and materials
The dataset supporting the findings of the study is available from the
corresponding author on request.
Authors’ contributions
GDC and HCY analyzed the data and wrote the paper. YTH contributed
to the data collection. SS revised the manuscript; JW, YL, and YHW were
parts of the data collection team; JLP: supervised the study and revised
the manuscript. ZQZ designed the project, supervised the study and
revised the manuscript. All authors have read and approved the
manuscript.
Ethics approval and consent to participate
A written consent was approved by each participant through his or
her parent or legal guardian before enrollment. Informed consent was
also obtained from each subject (or their parents/guardian) to analyse
and publish his or her data. The study was conducted in accordance
with the Declaration of Helsinki and was approved by the ethics
committee of the School of Public Health at Sun Yat-sen University
(201549).
Consent for publication
Not applicable.
Competing interests
The authors declare that they have no competing interests.
Publisher’s Note
Springer Nature remains neutral with regard to jurisdictional claims in
published maps and institutional affiliations.
Author details
1
Foshan Institute of Fetal Medicine, Department of Obstetrics, Southern
Medical University Affiliated Maternal & Child Health Hospital of Foshan,
Foshan 528000, Guangdong, China. 2Department of Nutrition and Food
Chen et al. BMC Pediatrics
(2019) 19:127
Hygiene, Guangdong Provincial Key Laboratory of Tropical Disease Research,
School of Public Health, Southern Medical University, Guangzhou 510515,
China. 3Department of Hygiene Detection Center, Guangdong Provincial Key
Laboratory of Tropical Disease Research, School of Public Health, Southern
Medical University, Guangzhou 510515, China.
Page 7 of 7
16.
Received: 15 November 2018 Accepted: 10 April 2019
17.
References
1. Ng M, Fleming T, Robinson M, Thomson B, Graetz N, Margono C, Mullany
EC, Biryukov S, Abbafati C, Abera SF, et al. Global, regional, and national
prevalence of overweight and obesity in children and adults during 19802013: a systematic analysis for the global burden of disease study 2013.
Lancet. 2014;384(9945):766–81. />2. Liang Y, Hou D, Zhao X, Wang L, Hu Y, Liu J, Cheng H, Yang P, Shan
X, Yan Y, et al. Childhood obesity affects adult metabolic syndrome and
diabetes. Endocrine. 2015;50(1):87–92. />2012.00066.x.
3. Bhupathiraju SN, Hu FB. Epidemiology of obesity and diabetes and their
cardiovascular complications. Circ Res. 2016;118(11):1723–35. />10.1161/CIRCRESAHA.115.306825.
4. Piche ME, Poirier P, Lemieux I, Despres JP. Overview of epidemiology and
contribution of obesity and body fat distribution to cardiovascular disease:
an update. Prog Cardiovasc Dis. 2018;61(2):103–13. />pcad.2018.06.004.
5. Afshin A, Forouzanfar MH, Reitsma MB, Sur P, Estep K, Lee A, Marczak L,
Mokdad AH, Moradi-Lakeh M, Naghavi M, et al. Health effects of overweight
and obesity in 195 countries over 25 years. N Engl J Med. 2017;377(1):13–27.
/>6. Sun H, Ma Y, Han D, Pan CW, Prevalence XY. Trends in obesity among
China’s children and adolescents, 1985–2010. PLoS One. 2014;9(8):e105469.
/>7. Liang YJ, Xi B, Song AQ, Liu JX, Mi J. Trends in general and abdominal
obesity among Chinese children and adolescents 1993–2009. Pediatr Obes.
2012;7(5):355. />8. Micklesfield LK, Goedecke JH, Punyanitya M, Wilson KE, Kelly TL. Dual-energy
X-ray performs as well as clinical computed tomography for the
measurement of visceral fat. Obesity (Silver Spring). 2012;20(5):1109–14.
/>9. Taylor AE, Kuper H, Varma RD, Wells JC, Bell JD, K VR, Kulkarni B, Kinra S,
Timpson NJ, Ebrahim S, et al. Validation of dual energy X-ray absorptiometry
measures of abdominal fat by comparison with magnetic resonance
imaging in an Indian population. PLoS One. 2012;7(12):e51042. https://doi.
org/10.1371/journal.pone.0051042.
10. Fujita Y, Kouda K, Nakamura H, Iki M. Cut-off values of body mass index,
waist circumference, and waist-to-height ratio to identify excess abdominal
fat: population-based screening of Japanese schoolchildren. J Epidemiol.
2011;21(3):191–6. />11. Bacopoulou F, Efthymiou V, Landis G, Rentoumis A, Chrousos GP. Waist
circumference, waist-to-hip ratio and waist-to-height ratio reference
percentiles for abdominal obesity among Greek adolescents. BMC Pediatr.
2015;15:50. />12. Kim SG, Ko K, Hwang IC, Suh HS, Kay S, Caterson I, Kim KK. Relationship
between indices of obesity obtained by anthropometry and dual-energy Xray absorptiometry: the fourth and fifth Korea National Health and nutrition
examination survey (KNHANES IV and V, 2008-2011). Obes Res Clin Pract.
2015;9(5):487–98. />13. Man RE, Sabanayagam C, Chiang PP, Li LJ, Noonan JE, Wang JJ, Wong TY,
Cheung GC, Tan GS, Lamoureux EL. Differential Association of Generalized
and Abdominal Obesity with Diabetic Retinopathy in Asian patients with
type 2 diabetes. JAMA Ophthalmol. 2016;134(3):251. />jamaophthalmol.2015.5103.
14. Emdin CA, Khera AV, Natarajan P, Klarin D, Zekavat SM, Hsiao AJ, Kathiresan
S. Genetic Association of Waist-to-hip Ratio with Cardiometabolic Traits,
type 2 diabetes, and coronary heart disease. JAMA. 2017;317(6):626–34.
/>15. Zhang Y, Zhao J, Chu Z, Tan H. Prevalence and regional disparities in
abdominal obesity among children and adolescents in Shandong,
18.
19.
20.
21.
22.
23.
24.
25.
26.
27.
China, surveyed in 2010. Ann Nutr Metab. 2014;64(2):137. https://doi.
org/10.1159/000365013.
Ochiai H, Shirasawa T, Nishimura R, Nanri H, Ohtsu T, Hoshino H, Tajima N,
Kokaze A. Waist-to-height ratio is more closely associated with alanine
aminotransferase levels than body mass index and waist circumference
among population-based children: a cross-sectional study in Japan. BMC
Pediatr. 2015;15:59. />Rodrigues dOPF, Cremonezi JC, Díezgarcía RW, Salles MC, García CP. The
use of body circumferences for the prediction of intra-abdominal fat in
obese women with polycystic ovary syndrome. Nutr Hosp. 2012;27(5):1662–
6. />Darbandi M, Darbandi S, Owji AA, Mokarram P, Mobarhan MG, Fardaei M,
Zhao B, Abdi H, Nematy M, Safarian M. Auricular or body acupuncture:
which one is more effective in reducing abdominal fat mass in Iranian men
with obesity: a randomized clinical trial. J Diabetes Metab Disord. 2014;13(1):
92. />Dencker M, Thorsson O, Linden C, Wollmer P, Andersen LB, Karlsson MK.
BMI and objectively measured body fat and body fat distribution in
prepubertal children. Clin Physiol Funct Imaging. 2007;27(1):12–6. https://
doi.org/10.1111/j.1475-097X.2007.00709.x.
Karlsson AK, Kullberg J, Stokland E, Allvin K, Gronowitz E, Svensson
PA, Dahlgren J. Measurements of total and regional body
composition in preschool children: a comparison of MRI, DXA, and
anthropometric data. Obesity (Silver Spring). 2013;21(5):1018–24.
/>Vanderwall C, Randall Clark R, Eickhoff J, Carrel AL. BMI is a poor predictor of
adiposity in young overweight and obese children. BMC Pediatr. 2017;17(1):
135. />Freedman DS, Wang J, Maynard LM, Thornton JC, Mei Z, Pierson RN, Dietz
WH, Horlick M. Relation of BMI to fat and fat-free mass among children and
adolescents. Int J Obes. 2004;29(1):1–8. />Castro-Pinero J, Artero EG, Espana-Romero V, Ortega FB, Sjostrom M, Suni J,
Ruiz JR. Criterion-related validity of field-based fitness tests in youth: a
systematic review. Br J Sports Med. 2010;44(13):934–43. />1136/bjsm.2009.058321.
Brambilla P, Bedogni G, Moreno LA, Goran MI, Gutin B, Fox KR, Peters DM,
Barbeau P, De SM, Pietrobelli A. Crossvalidation of anthropometry against
magnetic resonance imaging for the assessment of visceral and
subcutaneous adipose tissue in children. Int J Obes. 2006;30(1):23. https://
doi.org/10.1038/sj.ijo.0803163.
Taylor RW, Jones IE, Williams SM, Goulding A. Evaluation of waist
circumference, waist-to-hip ratio, and the conicity index as screening tools
for high trunk fat mass, as measured by dual-energy X-ray absorptiometry,
in children aged 3–19 y. Am J Clin Nutr. 2000;72(2):490. />1093/ajcn/72.2.490.
Daniels SR, Khoury PR, Morrison JA. Utility of different measures of
body fat distribution in children and adolescents. Am J Epidemiol.
2000;152(12):1179–84.
Power C, Lake JK, Cole TJ. Measurement and long-term health risks of child
and adolescent fatness. Int J Obes Relat Metab Disord. 1997;21(7):507–26.