Percentile curves for cardiometabolic disease markers in Canadian children and youth: A cross-sectional study
Bạn đang xem bản rút gọn của tài liệu. Xem và tải ngay bản đầy đủ của tài liệu tại đây (731.96 KB, 11 trang )
Ata et al. BMC Pediatrics (2018) 18:314
/>
RESEARCH ARTICLE
Open Access
Percentile curves for cardiometabolic
disease markers in Canadian children and
youth: a cross-sectional study
Nicole Ata1, Bryan Maguire2, David C Hamilton1 and Stefan Kuhle1*
Abstract
Background: The objective of this study to develop percentile curves for cardiometabolic disease markers in a
population-based sample of Canadian children and youth.
Methods: The analysis used data from 6116 children and adolescents between 6 and 19 years of age who participated
in the Canadian Health Measures Survey cycles 1 (2007/2009), 2 (2009/2011), and 3 (2012/2013). Total cholesterol, HDL
cholesterol, and hemoglobin A1c levels as well as fasting levels of triglycerides, insulin, and homeostasis model
assessment insulin resistance were measured using standardized procedures. Age- and sex-specific centiles for all
markers were calculated using Cole and Green’s LMS method.
Results: With the exception of hemoglobin A1c, all markers showed age- and sex-related differences during childhood
and adolescence.
Conclusions: We have developed centile curves for cardiometabolic disease markers in Canadian children and adolescents
and demonstrated age and sex differences that should be considered when evaluating these markers in this age group.
Keywords: Child, Adolescent, Metabolism, Obesity, Development, Diabetes
Background
Cardiovascular disease (CVD) is currently the leading
cause of death worldwide [1]. With the exception of
congenital heart disease, CVD manifests in adulthood,
but its risk factors are already detectable in childhood.
Abnormal blood lipids and diabetes are among the risk
factors for the development of CVD [2, 3]. An abnormal
lipid profile can include elevated total cholesterol, elevated triglycerides, and low high-density lipoprotein
(HDL) cholesterol. Insulin resistance plays an important
role in the development of youth-onset type 2 diabetes,
an emerging disease in children and youth [4]. Homeostasis model assessment estimates insulin resistance
(HOMA-IR) from fasting levels of insulin and glucose
[5]; other measures that have been used to identify insulin resistance or diabetes include fasting insulin and glycosylated hemoglobin (HbA1c), respectively [6–8].
* Correspondence:
1
Departments of Pediatrics and Obstetrics & Gynaecology, Dalhousie
University, Halifax, NS, Canada
Full list of author information is available at the end of the article
Levels of these markers vary by sex and across age in
childhood and adolescence, and percentile curves have
been developed to describe their physiologic development. Percentile curves have been published for lipids
and markers of insulin resistance in various populations
[9–14]. Since these curves are specific to populations
and there are no percentile curves for the levels of these
markers in Canadian children, the objective of this study
was to develop percentile curves for cardiometabolic
markers in a population-based sample of Canadian children and youth.
Methods
Study design
This study used data of children and youth aged 6 to
19 years from the Canadian Health Measures Survey
(CHMS) cycles 1 to 3, a representative, cross-sectional
survey assessing health and wellness in Canadians [15–
17]. The survey includes a household interview to
© The Author(s). 2018 Open Access This article is distributed under the terms of the Creative Commons Attribution 4.0
International License ( which permits unrestricted use, distribution, and
reproduction in any medium, provided you give appropriate credit to the original author(s) and the source, provide a link to
the Creative Commons license, and indicate if changes were made. The Creative Commons Public Domain Dedication waiver
( applies to the data made available in this article, unless otherwise stated.
Ata et al. BMC Pediatrics (2018) 18:314
obtain sociodemographic and health information and a
visit to a mobile examination centre to perform physical measurements and tests. The sampling frame of the
Canadian Labour Force Survey was used to identify the
collection sites for the mobile examination centres.
Within each collection site, households were selected
using the 2006 Census as the sampling frame. Interviews and examinations for the CHMS Cycle 1 were
performed between 2007 and 2009, for Cycle 2 between
2009 and 2011, and for Cycle 3 between 2012 and 2013.
Household response rates were 69.6, 75.9, and 74.1%, respectively; final response rates in the 3 cycles were 51.7,
55.7 and 51.7%, respectively [15–17]. We combined data
from the 3 cycles as per Statistics Canada guidelines [18]. A
total of 11,999 persons participated in physical examination
part of the three survey cycles. The present analysis uses
data from 6116 children and adolescents between 6 and
19 years of age.
The Health Canada Research Ethics Board gave approval for the CHMS. All participants gave written informed consent; parents or guardians consented on
behalf of children aged 6 to 13 years, and the child provided their assent to participate; youth 14 to 17 years
consented on their own, but their parents or guardians
had to give verbal permission for the household interview [15]. The current project was approved by the IWK
Health Centre Research Ethics Board, Halifax, NS,
Canada (File # 1014413).
Laboratory measurements
Blood for measurement of cardiometabolic markers
was collected by standard venipuncture. Fasted blood
samples for measurement of insulin, glucose, and triglycerides were taken in a randomly selected sample
of participants. The sample was obtained by randomly
offering each respondent a clinic appointment either
in the morning (after an overnight fast) or in the afternoon (non-fasted) [15]. Blood samples were centrifuged within 2 h and aliquoted within 4 h of
collection. The samples were stored either in the refrigerator or in the freezer until shipping. Samples
were shipped once a week to the Health Canada reference laboratory in Ottawa. Participants with diabetes
were excluded from the analysis of insulin, HOMA-IR,
and HbA1c; participants taking lipid-lowering medication were excluded from the analysis of lipids. Levels
of total cholesterol, HDL cholesterol, triglycerides,
and glucose were measured using a colorimetric test
and HbA1c was measured using a immunoturbidimetric test on the Vitros 5,1FS (Ortho Clinical Diagnostics, Markham, ON, Canada). Fasting insulin levels
were determined using a solid-phase, two-site chemiluminescent immunometric assay on the Advia Centaur XP (Siemens, Erlangen, Germany). Since insulin
Page 2 of 11
measurements in cycle 1 were performed using a different method and had a considerable proportion of
levels below the test’s limit of detection, we only used
insulin measurements from cycles 2 and 3 in the
present analysis. Fasting insulin and glucose levels
were used to calculate HOMA-IR as (fasting insulin
[μU/L] x glucose [mmol/L]) / 22.5 [19].
Statistical analysis
Percentile curves for total cholesterol, HDL cholesterol, triglycerides, insulin, HOMA-IR, and HbA1c
were modeled using the LMS method by Cole and
Green [20]. We have described the LMS method in
Table 1 Characteristics of 6116 Canadian children and youth
aged 6 to 19 years in the Canadian Health Measures Survey
Cycles 1 to 3
Prevalence [%]
Sex
Male
51.6
Female
48.4
Region of Canada
Atlantic Canada
6.7
Québec
22.5
Ontario
40.5
Prairies
18.2
British Columbia
12.2
Racial origin
White
80.9
Black
5.9a
Asian
10.7a
Other
2.4a
Weight status (IOTF)
Underweight
7.5
Normal weight
65.6
Overweight
17.4
Obese
9.5
Household education
Secondary school or less
15.7
College
46.6
University
37.6
Household income
$30,000 or less
15.1
$30,001 - $60,000
22.8
$60,001 - $80,000
18.3
$80,001 - $100,000
16.3
> $100,000
27.5
Abbreviations: IOTF International Obesity Task Force
a
Coefficient of variation between 16.6 and 33.3%; interpret with caution as per
Statistics Canada sampling variability reporting guidelines
Ata et al. BMC Pediatrics (2018) 18:314
Page 3 of 11
Male
Female
6
6
97%
97%
90%
Cholesterol [mmol/L]
5
90%
5
75%
75%
50%
4
50%
4
25%
25%
10%
3
10%
3%
3
3%
2
2
6
8
10
12
14
16
18
20
6
8
10
Age [years]
12
14
16
18
20
Age [years]
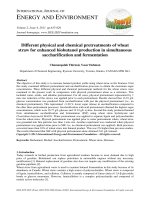
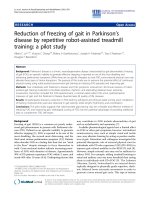
Fig. 1 Percentile curves for total cholesterol levels for male and female Canadian children and youth aged 6 to 19 years
Female
Male
2.5
2.5
2.0
2.0
HDL cholesterol [mmol/L]
97%
90%
97%
75%
90%
1.5
1.5
75%
50%
50%
25%
25%
1.0
10%
1.0
3%
10%
3%
0.5
0.5
6
8
10
12
14
16
18
6
20
8
10
12
14
16
18
20
Age [years]
Age [years]
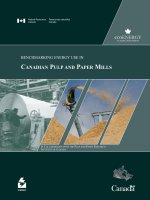
Fig. 2 Percentile curves for high-density lipoprotein (HDL) cholesterol levels for male and female Canadian children and youth aged 6 to 19 years
Female
Male
97%
2.0
2.0
Triglycerides [mmol/L]
97%
90%
90%
1.5
1.5
75%
75%
1.0
1.0
50%
50%
25%
25%
0.5
10%
3%
10%
3%
0.5
0.0
0.0
6
8
10
12
14
Age [years]
16
18
20
6
8
10
12
14
16
18
Age [years]
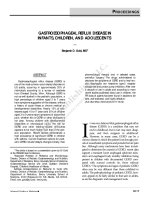
Fig. 3 Percentile curves for triglyceride levels for male and female Canadian children and youth aged 6 to 19 years
20
Ata et al. BMC Pediatrics (2018) 18:314
Page 4 of 11
Male
Female
200
200
97%
Insulin [pmol/L]
150
97%
150
90%
90%
100
100
75%
75%
50%
50%
50
25%
50
25%
10%
10%
0
0
6
8
10
12
14
16
18
20
6
8
10
12
Age [years]
14
16
18
20
Age [years]
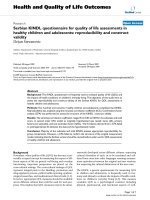
Fig. 4 Percentile curves for insulin levels for male and female Canadian children and youth aged 6 to 19 years
Male
Female
6
6
97%
97%
4
4
HOMA−IR
90%
90%
75%
75%
2
50%
2
50%
25%
25%
10%
3%
10%
3%
0
0
6
8
10
12
14
16
18
20
6
8
10
Age [years]
12
14
16
18
20
Age [years]
Fig. 5 Percentile curves for homeostasis model assessment insulin resistance (HOMA-IR) levels for male and female Canadian children and youth
aged 6 to 19 years
Male
Female
6.0
6.0
97%
Hemoglobin A1c [%]
97%
90%
90%
5.5
75%
5.5
75%
50%
50%
25%
25%
5.0
5.0
10%
10%
3%
3%
4.5
4.5
6
8
10
12
14
Age [years]
16
18
20
6
8
10
12
14
16
18
Age [years]
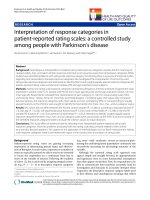
Fig. 6 Percentile curves for hemoglobin A1c levels for male and female Canadian children and youth aged 6 to 19 years
20
Ata et al. BMC Pediatrics (2018) 18:314
Page 5 of 11
detail elsewhere [21]. Briefly, the method uses a
Box-Cox transformation to normalize the data and
models the mean (M), variance (S), and skewness
(L) as parameters over age using cubic splines. Centiles and z-scores for the truncated standard normal
distribution can then be determined from the three
parameters at each age [20]. We calculated the 3rd,
10th, 25th, 50th, 75th, 90th, and 97th centile for
each marker. Models were fit to data from respondents up to age 30 years to avoid unusual behaviour
of the spline functions near the end of the age
range. The goodness of fit for each model was
assessed using residual quantile plots (“worm plots”)
[22]. All calculations were performed using sample
weights provided by Statistics Canada to account for
the design effect and reduce non-response bias. The
statistical software package R [23] with the gamlss
package [24] was used to perform the statistical
analyses.
Results
Sociodemographic characteristics of the sample are summarized in Table 1. Figures 1, 2, 3, 4, 5 and 6 and Tables 2, 3, 4, 5, 6 and 7 show the percentile curves and
their values for total cholesterol, HDL cholesterol, triglycerides, insulin, HOMA-IR, and HbA1c.
Total cholesterol curves had a bimodal distribution
for both boys and girls. Overall, cholesterol levels were
slightly higher in girls than in boys. Median levels at
6 years were 4.1 mmol/L in girls and 4.0 mmol/L in
boys. In boys, the 50th centile peaked at age 10 years
(4.2 mmol/L). The lowest median cholesterol level in
Table 2 L, M, and S values, and percentiles of total cholesterol [mmol/L] by age and sex for Canadian children and youth aged 6 to
19 years
Sex
Age
n
L
M
S
3rd
10th
25th
50th
75th
90th
97th
Female
6
203
1.2662
4.0824
0.1676
2.73
3.18
3.61
4.08
4.54
4.94
5.32
7
184
1.0339
4.1657
0.1666
2.85
3.27
3.70
4.17
4.63
5.05
5.46
8
215
0.7986
4.2255
0.1654
2.96
3.35
3.76
4.23
4.70
5.14
5.58
9
233
0.5790
4.2369
0.1645
3.01
3.38
3.78
4.24
4.72
5.17
5.63
10
256
0.3985
4.2026
0.1642
3.02
3.37
3.75
4.20
4.68
5.14
5.62
11
283
0.2725
4.1427
0.1646
3.00
3.33
3.70
4.14
4.62
5.09
5.58
12
187
0.2000
4.0742
0.1658
2.95
3.28
3.64
4.07
4.55
5.02
5.51
13
178
0.1564
4.0321
0.1673
2.92
3.24
3.60
4.03
4.51
4.98
5.48
14
170
0.1308
4.0222
0.1691
2.91
3.23
3.59
4.02
4.50
4.98
5.49
15
175
0.1173
4.0342
0.1717
2.90
3.23
3.59
4.03
4.53
5.01
5.54
16
178
0.1121
4.0701
0.1746
2.91
3.24
3.61
4.07
4.58
5.08
5.62
17
186
0.1066
4.1326
0.1769
2.94
3.28
3.66
4.13
4.65
5.17
5.73
18
168
0.1017
4.2050
0.1788
2.99
3.33
3.72
4.21
4.74
5.27
5.85
19
152
0.0901
4.2612
0.1809
3.02
3.37
3.77
4.26
4.81
5.36
5.96
6
203
1.1968
4.0369
0.1508
2.86
3.24
3.62
4.04
4.44
4.80
5.15
7
211
0.8365
4.0884
0.1523
2.95
3.30
3.67
4.09
4.51
4.90
5.29
8
232
0.5410
4.1350
0.1551
3.01
3.35
3.71
4.13
4.58
4.99
5.42
9
239
0.3792
4.1691
0.1597
3.03
3.37
3.73
4.17
4.63
5.08
5.54
10
263
0.3624
4.1766
0.1651
3.00
3.35
3.73
4.18
4.66
5.12
5.61
11
277
0.3556
4.1469
0.1703
2.95
3.30
3.69
4.15
4.64
5.12
5.62
12
207
0.3332
4.0711
0.1757
2.87
3.22
3.61
4.07
4.57
5.06
5.57
13
207
0.3217
3.9598
0.1801
2.77
3.12
3.50
3.96
4.46
4.95
5.46
14
205
0.2648
3.8546
0.1833
2.69
3.02
3.40
3.85
4.35
4.84
5.36
15
184
0.1878
3.7910
0.1863
2.64
2.97
3.34
3.79
4.29
4.79
5.32
16
208
0.1426
3.7735
0.1886
2.62
2.95
3.32
3.77
4.28
4.79
5.33
17
183
0.1015
3.7992
0.1883
2.65
2.98
3.34
3.80
4.31
4.82
5.38
18
144
0.0557
3.8565
0.1873
2.70
3.03
3.40
3.86
4.37
4.90
5.47
19
139
0.0083
3.9299
0.1869
2.76
3.09
3.46
3.93
4.46
4.99
5.58
Male
Abbreviations: L lambda (skewness); M mu (mean); S sigma (variance)
Ata et al. BMC Pediatrics (2018) 18:314
Page 6 of 11
Table 3 L, M, and S values, and percentiles of HDL cholesterol [mmol/L] by age and sex for Canadian children and youth aged 6 to
19 years
Sex
Female
Male
Age
n
L
M
S
3rd
10th
25th
50th
75th
90th
97th
6
203
0.6653
1.2995
0.2301
0.78
0.94
1.10
1.30
1.51
1.70
1.90
7
184
0.5810
1.3513
0.2315
0.82
0.98
1.15
1.35
1.57
1.78
1.99
8
215
0.4894
1.3925
0.2317
0.85
1.01
1.18
1.39
1.62
1.84
2.07
9
233
0.4025
1.4128
0.2304
0.88
1.03
1.20
1.41
1.64
1.87
2.11
10
256
0.3317
1.4069
0.2269
0.89
1.04
1.20
1.41
1.63
1.86
2.10
11
283
0.2946
1.3835
0.2222
0.89
1.03
1.19
1.38
1.60
1.82
2.05
12
187
0.2932
1.3527
0.2180
0.87
1.01
1.16
1.35
1.56
1.77
1.99
13
178
0.2666
1.3372
0.2152
0.87
1.00
1.15
1.34
1.54
1.74
1.96
14
170
0.1991
1.3404
0.2145
0.88
1.01
1.16
1.34
1.55
1.75
1.98
15
175
0.1202
1.3502
0.2156
0.89
1.02
1.17
1.35
1.56
1.77
2.01
16
178
0.0477
1.3590
0.2180
0.90
1.03
1.17
1.36
1.57
1.79
2.04
17
186
−0.0261
1.3764
0.2213
0.91
1.04
1.19
1.38
1.60
1.83
2.09
18
168
−0.0758
1.4019
0.2258
0.92
1.05
1.20
1.40
1.63
1.88
2.16
19
152
−0.0551
1.4209
0.2316
0.92
1.06
1.22
1.42
1.66
1.92
2.21
6
203
0.8228
1.4346
0.2226
0.86
1.04
1.22
1.43
1.65
1.85
2.06
7
211
0.6385
1.4440
0.2207
0.89
1.06
1.23
1.44
1.66
1.87
2.09
8
232
0.4626
1.4509
0.2215
0.91
1.07
1.24
1.45
1.68
1.89
2.12
9
239
0.3069
1.4533
0.2256
0.92
1.07
1.24
1.45
1.69
1.92
2.17
10
263
0.1937
1.4465
0.2296
0.92
1.07
1.24
1.45
1.68
1.93
2.19
11
277
0.1465
1.4230
0.2297
0.91
1.05
1.22
1.42
1.66
1.90
2.16
12
207
0.1687
1.3827
0.2281
0.89
1.02
1.18
1.38
1.61
1.84
2.09
13
207
0.2352
1.3335
0.2266
0.85
0.99
1.14
1.33
1.55
1.77
2.00
14
205
0.3157
1.2882
0.2251
0.82
0.95
1.10
1.29
1.49
1.70
1.92
15
184
0.3915
1.2523
0.2244
0.79
0.92
1.07
1.25
1.45
1.64
1.85
16
208
0.4549
1.2270
0.2256
0.77
0.90
1.05
1.23
1.42
1.61
1.81
17
183
0.4843
1.2122
0.2260
0.75
0.89
1.03
1.21
1.40
1.59
1.78
18
144
0.4698
1.2062
0.2245
0.75
0.89
1.03
1.21
1.40
1.58
1.77
19
139
0.4299
1.2084
0.2234
0.76
0.89
1.03
1.21
1.40
1.58
1.78
Abbreviations: L lambda (skewness); M mu (mean); S sigma (variance)
boys was seen at 16 years of age (3.8 mmol/L), after
which it increased to 3.9 mmol/L at 19 years. In girls,
the 50th centile for cholesterol had a peak at 9 years
(4.2 mmol/L), decreased to a trough at 15 years
(4.0 mmol/L) and increased again to 4.3 mmol/L at
19 years of age. HDL cholesterol showed a bimodal
distribution in girls, but only one peak in boys. In boys,
the median levels were highest before 11 years
(1.5 mmol/L) and then steadily declined until 19 years
(1.2 mmol/L). Median HDL cholesterol in girls peaked
at age 10 years (1.4 mmol/L) and after a trough
(1.3 mmol/L) increased again to 1.4 mmol/L at 19 years.
Median levels of triglycerides exhibited a steady linear
increase from 6 years (0.7 mmol/L) to 19 years
(0.9 mmol/L) for both sexes. Insulin levels were overall
higher in girls than in boys. For both sexes, median
levels increased until about 14 years of age (62 and
72 pmol/L in boys and girls, respectively), after which
they slightly decreased to 57 pmol/L in boys and
70 pmol/L in girls at 19 years of age. Centile curves for
HOMA-IR largely mirrored those for insulin with the
50th percentile peaking at 15 years for both sexes (1.9
for boys and 2.2 for girls). Median HbA1c levels held
nearly constant around 5.3% from 6 to 19 years for
both sexes.
Discussion
The objective of this study was to develop percentile
curves for total cholesterol, HDL cholesterol, triglycerides,
insulin, HOMA-IR, and HbA1c in a population-based
Ata et al. BMC Pediatrics (2018) 18:314
Page 7 of 11
Table 4 L, M, and S values, and percentiles of triglycerides [mmol/L] by age and sex for Canadian children and youth aged 6 to
19 years
Sex
Age
n
L
Female
6
78
−0.0198
0.7390
0.3934
0.35
0.45
0.57
0.74
0.96
1.23
1.56
7
85
− 0.0360
0.7567
0.3932
0.36
0.46
0.58
0.76
0.99
1.26
1.60
8
98
−0.0522
0.7744
0.3931
0.37
0.47
0.60
0.77
1.01
1.29
1.65
9
127
−0.0680
0.7922
0.3931
0.39
0.48
0.61
0.79
1.04
1.32
1.69
10
114
−0.0821
0.8100
0.3931
0.40
0.49
0.62
0.81
1.06
1.35
1.74
11
139
−0.0928
0.8273
0.3932
0.40
0.51
0.64
0.83
1.08
1.39
1.78
12
93
−0.0987
0.8438
0.3935
0.41
0.52
0.65
0.84
1.10
1.42
1.82
13
88
− 0.0996
0.8593
0.3942
0.42
0.52
0.66
0.86
1.13
1.44
1.86
14
88
−0.0958
0.8738
0.3954
0.43
0.53
0.67
0.87
1.14
1.47
1.89
15
91
−0.0874
0.8874
0.3972
0.43
0.54
0.68
0.89
1.16
1.49
1.92
16
91
−0.0746
0.9003
0.3996
0.43
0.54
0.69
0.90
1.18
1.52
1.95
17
89
−0.0581
0.9125
0.4026
0.43
0.55
0.70
0.91
1.20
1.54
1.98
18
74
−0.0389
0.9240
0.4061
0.44
0.55
0.70
0.92
1.22
1.56
2.01
19
72
−0.0180
0.9346
0.4102
0.43
0.55
0.71
0.93
1.23
1.58
2.03
6
102
−0.2816
0.6737
0.4053
0.34
0.41
0.52
0.67
0.90
1.18
1.59
7
98
−0.2348
0.6849
0.4111
0.34
0.42
0.52
0.68
0.91
1.20
1.61
8
116
−0.1881
0.6961
0.4169
0.33
0.42
0.53
0.70
0.93
1.22
1.63
9
120
−0.1418
0.7075
0.4227
0.33
0.42
0.54
0.71
0.95
1.24
1.64
10
133
−0.0967
0.7195
0.4281
0.33
0.42
0.54
0.72
0.96
1.26
1.66
11
135
−0.0544
0.7322
0.4329
0.33
0.42
0.55
0.73
0.98
1.29
1.68
12
96
−0.0165
0.7459
0.4368
0.33
0.43
0.56
0.75
1.00
1.31
1.71
13
112
0.0157
0.7606
0.4395
0.33
0.43
0.57
0.76
1.02
1.33
1.73
14
97
0.0421
0.7763
0.4412
0.33
0.44
0.58
0.78
1.04
1.36
1.75
15
93
0.0630
0.7927
0.4422
0.34
0.45
0.59
0.79
1.07
1.38
1.78
16
103
0.0788
0.8098
0.4428
0.34
0.45
0.60
0.81
1.09
1.41
1.81
17
92
0.0899
0.8275
0.4431
0.35
0.46
0.61
0.83
1.11
1.44
1.85
18
78
0.0968
0.8457
0.4435
0.35
0.47
0.62
0.85
1.14
1.47
1.89
19
74
0.0999
0.8642
0.4441
0.36
0.48
0.64
0.86
1.16
1.50
1.93
Male
M
S
3rd
10th
25th
50th
75th
90th
97th
Abbreviations: L lambda (skewness); M mu (mean); S sigma (variance)
sample of Canadian children and youth. We found ageand sex-related differences in blood levels for all markers
except for HbA1c.
A bimodal shape of the centile curves for total
cholesterol levels has been described in various Western populations [9, 11, 13, 25]. A pre-adolescent peak
at around 8 to 10 years of age that is more pronounced in boys is followed by a decrease during
adolescence and another peak in late adolescence and
young adulthood. The same pattern, but without a
post-pubertal rise in boys, can be seen for HDL
cholesterol [9, 11, 13]. The pubertal trough of cholesterol levels may be the result of the well described insulin resistance during puberty [26]. Clinicians should
be aware of these physiologic changes when interpreting cholesterol levels. However, it should also be
acknowledged that median levels of cholesterol in our
study as well as in other studies varied by 10% or less
in either direction during childhood and adolescence
[9, 11, 13, 25].
Median triglyceride levels in our sample showed a
nearly linear increase by about 30% from around 0.7 to
0.9 mmol/L in both sexes during childhood and adolescence. Some investigators previously described a bimodal pattern in girls with peaks at around 12 and
19 years of age [9, 11], while others also reported the
linear increase we found [13]. These differences may be
explained by different degrees of smoothing applied during the modeling process.
Median fasting insulin levels were higher in girls
than in boys, and levels in both sexes peaked at
around 15 years of age followed by a slight decrease
Ata et al. BMC Pediatrics (2018) 18:314
Page 8 of 11
Table 5 L, M, and S values, and percentiles of insulin [pmol/L] by age and sex for Canadian children and youth aged 6 to 19 years
Sex
Age
n
L
M
S
3rd
10th
25th
50th
75th
90th
97th
Female
6
74
0.0810
36.8032
0.5822
11.69
17.05
24.69
36.80
54.17
75.94
105.08
7
85
0.0832
41.9738
0.5661
13.77
19.86
28.47
41.97
61.13
84.90
116.43
8
95
0.0861
47.1805
0.5505
15.95
22.79
32.35
47.18
68.00
93.58
127.19
9
124
0.0909
52.4480
0.5352
18.25
25.83
36.33
52.45
74.82
102.02
137.42
10
110
0.0997
57.6269
0.5201
20.59
28.91
40.32
57.63
81.35
109.87
146.55
11
136
0.1121
62.4301
0.5044
22.90
31.91
44.13
62.43
87.17
116.52
153.78
12
92
0.1263
66.5218
0.4884
25.06
34.66
47.52
66.52
91.86
121.50
158.64
13
88
0.1414
69.6293
0.4734
26.89
36.93
50.22
69.63
95.15
124.61
161.05
14
86
0.1553
71.6632
0.4607
28.26
38.58
52.12
71.66
97.07
126.08
161.58
15
86
0.1652
72.6769
0.4515
29.11
39.56
53.17
72.68
97.82
126.30
160.90
16
90
0.1703
72.8110
0.4465
29.42
39.88
53.45
72.81
97.67
125.70
159.62
17
86
0.1707
72.2282
0.4460
29.21
39.58
53.04
72.23
96.85
124.61
158.18
18
74
0.1665
71.1378
0.4500
28.57
38.80
52.10
71.14
95.65
123.38
157.03
19
71
0.1592
69.7465
0.4583
27.60
37.65
50.80
69.75
94.31
122.28
156.42
Male
6
98
−0.0050
29.2964
0.5269
10.90
14.93
20.54
29.30
41.81
57.62
79.12
7
95
−0.0012
33.2034
0.5309
12.24
16.82
23.21
33.20
47.50
65.58
90.17
8
116
0.0028
37.0587
0.5348
13.54
18.66
25.83
37.06
53.14
73.49
101.18
9
118
0.0065
40.8164
0.5385
14.78
20.44
28.37
40.82
58.67
81.26
112.00
10
130
0.0097
44.7223
0.5419
16.06
22.28
31.01
44.72
64.42
89.36
123.31
11
129
0.0126
49.2160
0.5451
17.54
24.40
34.05
49.22
71.02
98.66
136.29
12
95
0.0153
54.1827
0.5477
19.18
26.75
37.41
54.18
78.32
108.91
150.58
13
110
0.0178
58.6671
0.5499
20.65
28.87
40.44
58.67
84.91
118.19
163.49
14
95
0.0203
61.7110
0.5519
21.61
30.27
42.47
61.71
89.42
124.55
172.38
15
91
0.0232
62.9131
0.5539
21.91
30.75
43.23
62.91
91.27
127.21
176.13
16
102
0.0271
62.5506
0.5561
21.65
30.46
42.90
62.55
90.85
126.71
175.45
17
91
0.0318
61.1922
0.5583
21.03
29.67
41.90
61.19
88.97
124.15
171.90
18
76
0.0370
59.3041
0.5602
20.25
28.65
40.54
59.30
86.30
120.44
166.70
19
74
0.0431
57.1325
0.5615
19.39
27.51
39.00
57.13
83.18
116.05
160.46
Abbreviations: L lambda (skewness); M mu (mean); S sigma (variance)
towards late adolescence. Similar age and sex differences have also been reported by others [13, 27]. The
peak in puberty reflects the physiologically reduced
insulin sensitivity and concomitant increase in insulin
secretion during that period [28, 29]. The median insulin levels in our study and others [12, 13, 27] varied
with pubertal levels ranging from 52 to 63 pmol/L in
boys and from 65 to 73 pmol/L in girls. These differences may be explained by differences in the insulin
assay used [30] or differences in the body composition, ethnicity, and puberty stage of the children in the
sample. The shape of the HOMA-IR curves was
similar to those for fasting insulin. Schwartz et al.
found a significant correlation between fasting insulin
and HOMA-IR but found both only modestly correlated with the insulin resistance measurement gold
standard, the euglycemic-hyperinsulinemic glucose
clamp [31]. HOMA-IR still is among the most commonly used surrogate measure of insulin resistance to
date. Given the variation over sex and age, in particular the physiologic insulin resistance in puberty, the
use of an age- and sex-specific percentile-based cutoff
for HOMA-IR is warranted. Unfortunately, such a
cutoff has not been established to date [32].
Glycosylated hemoglobin or HbA1c is an established marker for long-term glycemic control in patients with diabetes [33]. HbA1c has been proposed
as a screening tool for undiagnosed diabetes in adults
[6] and children with overweight or obesity [8], but
the evidence is still very limited. We found very little
change in HbA1c levels from childhood to late adolescence, and there was no difference between the sexes.
Ata et al. BMC Pediatrics (2018) 18:314
Page 9 of 11
Table 6 L, M, and S values, and percentiles of HOMA-IR by age and sex for Canadian children and youth aged 6 to 19 years
Sex
Age
n
L
M
S
3rd
10th
25th
50th
75th
90th
97th
Female
6
74
0.0680
1.0304
0.6120
0.31
0.46
0.68
1.03
1.55
2.21
3.12
7
85
0.0816
1.1930
0.5955
0.37
0.54
0.79
1.19
1.77
2.50
3.48
8
95
0.0953
1.3607
0.5795
0.43
0.63
0.91
1.36
2.00
2.79
3.84
9
124
0.1090
1.5413
0.5642
0.50
0.73
1.04
1.54
2.24
3.09
4.21
10
110
0.1226
1.7284
0.5496
0.57
0.83
1.18
1.73
2.48
3.40
4.57
11
136
0.1354
1.9044
0.5360
0.64
0.93
1.31
1.90
2.71
3.67
4.90
12
92
0.1467
2.0481
0.5235
0.71
1.01
1.43
2.05
2.89
3.88
5.14
13
88
0.1557
2.1435
0.5125
0.75
1.07
1.50
2.14
3.00
4.01
5.26
14
86
0.1619
2.1886
0.5036
0.78
1.11
1.54
2.19
3.05
4.04
5.28
15
86
0.1645
2.1908
0.4970
0.79
1.12
1.55
2.19
3.04
4.02
5.23
16
90
0.1635
2.1612
0.4930
0.79
1.11
1.54
2.16
2.99
3.94
5.12
17
86
0.1591
2.1092
0.4916
0.78
1.09
1.50
2.11
2.91
3.84
5.00
18
74
0.1514
2.0465
0.4928
0.75
1.05
1.46
2.05
2.83
3.74
4.87
19
71
0.1411
1.9837
0.4965
0.73
1.02
1.41
1.98
2.75
3.65
4.77
6
98
0.0558
0.8427
0.5725
0.28
0.40
0.57
0.84
1.23
1.73
2.40
7
95
0.0576
0.9718
0.5752
0.32
0.46
0.66
0.97
1.43
2.00
2.78
8
116
0.0595
1.1004
0.5778
0.36
0.52
0.74
1.10
1.62
2.27
3.15
9
118
0.0610
1.2255
0.5802
0.40
0.57
0.82
1.23
1.80
2.54
3.52
10
130
0.0617
1.3545
0.5823
0.44
0.63
0.91
1.35
2.00
2.81
3.91
11
129
0.0619
1.5014
0.5841
0.48
0.70
1.01
1.50
2.22
3.12
4.35
12
95
0.0618
1.6614
0.5855
0.53
0.77
1.11
1.66
2.45
3.46
4.82
13
110
0.0618
1.8031
0.5864
0.58
0.84
1.21
1.80
2.67
3.76
5.24
14
95
0.0619
1.8974
0.5873
0.60
0.88
1.27
1.90
2.81
3.96
5.52
15
91
0.0627
1.9332
0.5883
0.61
0.89
1.29
1.93
2.86
4.04
5.63
16
102
0.0646
1.9204
0.5896
0.61
0.89
1.28
1.92
2.84
4.02
5.60
17
91
0.0673
1.8754
0.5910
0.59
0.86
1.25
1.88
2.78
3.93
5.48
18
76
0.0705
1.8126
0.5922
0.57
0.83
1.21
1.81
2.69
3.80
5.30
19
74
0.0747
1.7406
0.5929
0.54
0.80
1.16
1.74
2.58
3.64
5.08
Male
Abbreviations: L lambda (skewness); M mu (mean); S sigma (variance)
To the best of our knowledge, only three previous studies
have examined HbA1c levels during childhood [12, 14,
34]. Only Peplies et al. in the European IDEFICS cohort
developed percentile curves to describe the changes in
levels across age and found a 15% increase in median
HbA1c levels between 7 and 11 years for both sexes [12].
The strengths of our study include the use of a
large population-based sample and the use of
standardized protocols and procedures for the measurement of the cardiometabolic marker levels. A
shortcoming of the use of cross-sectional data is that
it is not clear if the trajectories of individual children follow this pattern; longitudinal data may be
more accurate in describing age-related changes but
are considerably more resource intensive to collect
at the population level. Due to the relatively small
proportion of visible minority children in the sample
(< 20%), we were not able to investigate ethnic differences in marker levels and trajectories. Another
limitation of our study is that we were unable to
take puberty stage, which may influence insulin and
lipid levels, into account as this information was not
available in the CHMS. By contrast to some of the
previous studies in this area, we did not restrict our
analysis to children with a healthy weight [9, 12], as
our goal was to describe population-based trajectories. Since the inclusion of overweight and obese children in our sample may have influenced lipid and
insulin levels, our percentiles cannot be considered
as reference values.
Ata et al. BMC Pediatrics (2018) 18:314
Page 10 of 11
Table 7 L, M, and S values, and percentiles of hemoglobin A1c by age and sex for Canadian children and youth aged 6 to 19 years
Sex
Age
n
L
M
S
3rd
10th
25th
50th
75th
90th
97th
Female
6
192
0.6293
0.0531
0.0565
0.0476
0.0493
0.0511
0.0531
0.0552
0.0570
0.0589
7
178
0.0341
0.0532
0.0563
0.0478
0.0495
0.0512
0.0532
0.0552
0.0571
0.0591
8
204
−0.5398
0.0532
0.0561
0.0480
0.0496
0.0513
0.0532
0.0553
0.0573
0.0593
9
224
−1.0745
0.0533
0.0560
0.0482
0.0497
0.0513
0.0533
0.0553
0.0574
0.0596
10
248
−1.5959
0.0533
0.0560
0.0484
0.0498
0.0514
0.0533
0.0554
0.0575
0.0598
11
275
−2.1144
0.0533
0.0559
0.0485
0.0499
0.0514
0.0533
0.0554
0.0576
0.0600
12
184
−2.5527
0.0533
0.0558
0.0486
0.0499
0.0514
0.0533
0.0554
0.0577
0.0602
13
172
−2.8025
0.0532
0.0557
0.0486
0.0499
0.0514
0.0532
0.0554
0.0576
0.0603
14
166
−2.8388
0.0531
0.0555
0.0485
0.0498
0.0513
0.0531
0.0553
0.0575
0.0601
15
167
−2.7545
0.0530
0.0553
0.0484
0.0497
0.0512
0.0530
0.0551
0.0574
0.0599
16
172
−2.6052
0.0529
0.0551
0.0483
0.0496
0.0511
0.0529
0.0550
0.0572
0.0597
17
177
−2.4044
0.0528
0.0550
0.0481
0.0495
0.0509
0.0528
0.0549
0.0570
0.0595
18
165
−2.1906
0.0527
0.0550
0.0480
0.0494
0.0509
0.0527
0.0548
0.0569
0.0593
19
149
−2.0342
0.0527
0.0552
0.0479
0.0493
0.0508
0.0527
0.0548
0.0569
0.0592
6
195
−0.4642
0.0530
0.0619
0.0473
0.0490
0.0509
0.0530
0.0553
0.0575
0.0598
7
205
−0.5917
0.0532
0.0612
0.0476
0.0492
0.0510
0.0532
0.0554
0.0576
0.0599
8
227
−0.7384
0.0533
0.0605
0.0478
0.0494
0.0512
0.0533
0.0555
0.0577
0.0600
9
229
−0.8769
0.0534
0.0598
0.0480
0.0496
0.0513
0.0534
0.0556
0.0578
0.0601
10
256
−0.9903
0.0535
0.0591
0.0481
0.0497
0.0514
0.0535
0.0557
0.0578
0.0601
11
267
−1.0740
0.0535
0.0584
0.0482
0.0498
0.0515
0.0535
0.0557
0.0579
0.0602
12
204
−1.1009
0.0535
0.0580
0.0483
0.0498
0.0515
0.0535
0.0557
0.0578
0.0601
13
201
−1.0887
0.0535
0.0577
0.0483
0.0498
0.0515
0.0535
0.0556
0.0578
0.0600
14
203
−1.0467
0.0534
0.0574
0.0482
0.0497
0.0514
0.0534
0.0555
0.0576
0.0599
15
180
−1.0081
0.0532
0.0571
0.0481
0.0496
0.0512
0.0532
0.0554
0.0574
0.0596
16
205
−0.9894
0.0530
0.0567
0.0479
0.0494
0.0511
0.0530
0.0551
0.0572
0.0594
17
180
−1.0085
0.0528
0.0561
0.0478
0.0493
0.0509
0.0528
0.0549
0.0569
0.0591
18
138
−1.0586
0.0527
0.0555
0.0477
0.0492
0.0508
0.0527
0.0547
0.0567
0.0588
19
135
−1.1174
0.0526
0.0549
0.0477
0.0491
0.0507
0.0526
0.0546
0.0566
0.0587
Male
Abbreviations: L lambda (skewness); M mu (mean); S sigma (variance)
Conclusions
Our study has developed percentile curves for cardiometabolic disease markers in Canadian children and adolescents.
We have demonstrated age- and sex-related differences in
marker levels for lipids, insulin, and HOMA-IR that should
be considered when evaluating these markers in children
and adolescents.
Abbreviations
CHMS: Canadian Health Measures Survey; CVD: Cardiovascular disease;
HbA1c: Hemoglobin A1c; HDL: High-density lipoprotein; HOMA-IR: Homeostasis
model assessment insulin resistance; LMS: Lambda Mu Sigma
Acknowledgements
The analysis presented in this paper was conducted at the Atlantic Research Data
Centre, which is part of the Canadian Research Data Centre Network (CRDCN).
The services and activities provided by the Atlantic Research Data Centre are
made possible by the financial or in-kind support of the SSHRC, the CIHR, the CFI,
Statistics Canada, and Dalhousie University. The views expressed in this paper do
not necessarily represent the views of the CRDCN or its partners.
Funding
This work was supported by an IWK Health Centre ()
Establishment Grant awarded to Dr. Stefan Kuhle (FRN 09020). The funder had
no role in the design of the study and collection, analysis, and interpretation of
data and in writing the manuscript.
Availability of data and materials
The data that support the findings of this study are available from Statistics
Canada through the Statistics Canada Research Data Centres program to
researchers who meet the criteria for access to confidential data. The
application process is described at />In brief, researchers submit an application form and project proposal to the
Statistics Canada Research Data Centres Program. Upon approval they have
to undergo a security check. Once completed, they get access to one of the
Research Data Centres in Canada to analyze the data. Only aggregated data
can be released, and all output produced at the centres must be vetted by a
Statistics Canada analyst before release.
Authors’ contributions
NA, BM, DCH, and SK conceived and designed the experiments. BM and SK
analyzed the data. NA wrote the manuscript. BM, DCH, and SK critically
revised the manuscript. All authors read and approved the final manuscript.
Ata et al. BMC Pediatrics (2018) 18:314
Ethics approval and consent to participate
The Health Canada Research Ethics Board gave approval for the CHMS. All
participants gave written informed consent; parents or guardians consented
on behalf of children aged 6 to 13 years, and the child provided their assent
to participate. The current project was approved by the IWK Health Centre
Research Ethics Board, Halifax, NS, Canada (File # 1014413).
Consent for publication
Not applicable.
Competing interests
The authors declare that they have no competing interests.
Publisher’s Note
Springer Nature remains neutral with regard to jurisdictional claims in
published maps and institutional affiliations.
Author details
1
Departments of Pediatrics and Obstetrics & Gynaecology, Dalhousie
University, Halifax, NS, Canada. 2Department of Mathematics and Statistics,
Dalhousie University, Halifax, NS, Canada.
Received: 19 April 2018 Accepted: 20 September 2018
References
1. World Health Organization. Cardiovascular diseases (CVDs). Fact sheet No.
317. Geneva: World Health Organization; 2017.
2. Linton MF, Yancey PG, Davies SS, Jerome WGJ, Linton EF, Vickers KC. The
role of lipids and lipoproteins in atherosclerosis. In: De Groot LJ, Chrousos G,
Dungan K, Feingold KR, Grossman A, Hershman JM, et al., editors. Endotext.
South Dartmouth: MDText.com, Inc.; 2000.
3. Thomas JE, Foody JM. The pathophysiology of cardiovascular disease in
diabetes mellitus and the future of therapy. J Cardiometab Syndr. 2007;2:
108–13.
4. Nadeau KJ, Anderson BJ, Berg EG, Chiang JL, Chou H, Copeland KC, et al.
Youth-onset type 2 diabetes consensus report: current status, challenges,
and priorities. Diab Care. 2016;39:1635–42.
5. Wallace TM, Levy JC, Matthews DR. Use and abuse of HOMA modeling.
Diab Care. 2004;27:1487–95.
6. Rohlfing CL, Little RR, Wiedmeyer HM, England JD, Madsen R, Harris MI,
et al. Use of GHb (HbA1c) in screening for undiagnosed diabetes in the U.S.
population. Diab Care. 2000;23:187–91.
7. American Diabetes Association. Consensus Development Conference on
Insulin Resistance. 5–6 November 1997. American Diabetes Association.
Diab Care. 1998;21:310–4.
8. Ehehalt S, Wiegand S, Körner A, Schweizer R, Liesenkötter KP, Partsch CJ,
et al. Diabetes screening in overweight and obese children and
adolescents: choosing the right test. Eur J Pediatr. 2017;176:89–97.
9. Skinner AC, Steiner MJ, Chung AE, Perrin EM. Cholesterol curves to identify
population norms by age and sex in healthy weight children. Clin Pediatr
(Phila). 2012;51:233–7.
10. Dathan-Stumpf A, Vogel M, Hiemisch A, Thiery J, Burkhardt R, Kratzsch J,
et al. Pediatric reference data of serum lipids and prevalence of
dyslipidemia: results from a population-based cohort in Germany. Clin
Biochem. 2016;49:740–9.
11. Cook S, Auinger P, Huang TT. Growth curves for cardio-metabolic risk
factors in children and adolescents. J Pediatr. 2009;155:S6.e15–26.
12. Peplies J, Jiménez-Pavón D, Savva SC, Buck C, Günther K, Fraterman A, et al.
Percentiles of fasting serum insulin, glucose, HbA1c and HOMA-IR in prepubertal normal weight European children from the IDEFICS cohort. Int J
Obes. 2014;38(Suppl 2):S39–47.
13. Mellerio H, Alberti C, Druet C, Capelier F, Mercat I, Josserand E, et al. Novel
modeling of reference values of cardiovascular risk factors in children aged
7 to 20 years. Pediatrics. 2012;129:e1020–9.
14. Rödöö P, Ridefelt P, Aldrimer M, Niklasson F, Gustafsson J, Hellberg D.
Population-based pediatric reference intervals for HbA1c, bilirubin,
albumin, CRP, myoglobin and serum enzymes. Scand J Clin Lab Invest.
2013;73:361–7.
15. Statistics Canada. Canadian health measures survey (CHMS) data user guide:
cycle 1. Ottawa: Statistics Canada; 2011.
Page 11 of 11
16. Statistics Canada. Canadian health measures survey (CHMS) data user guide:
cycle 2. Ottawa: Statistics Canada; 2013.
17. Statistics Canada. Canadian health measures survey (CHMS) data user guide:
cycle 3. Ottawa: Statistics Canada; 2015.
18. Statistics Canada. Canadian Health Measures Survey (CHMS): Instructions for
combining cycle 1 and cycle 2 data. Otttawa; 2013.
19. Matthews DR, Hosker JP, Rudenski AS, Naylor BA, Treacher DF, Turner RC.
Homeostasis model assessment: insulin resistance and beta-cell function
from fasting plasma glucose and insulin concentrations in man.
Diabetologia. 1985;28:412–9.
20. Cole TJ, Green PJ. Smoothing reference centile curves: the LMS method and
penalized likelihood. Stat Med. 1992;11:1305–19.
21. Kuhle S, Maguire B, Ata N, Hamilton D. Percentile curves for anthropometric
measures for Canadian children and youth. PLoS One. 2015;10:e0132891.
22. van Buuren S, Fredriks M. Worm plot: a simple diagnostic device for
modelling growth reference curves. Stat Med. 2001;20:1259–77.
23. R Core Team. R: A language and environment for statistical computing.
Vienna: R Foundation for Statistical Computing; 2016.
24. Rigby RA, Stasinopoulos DM. Using the box-cox t distribution in GAMLSS to
model skewness and kurtosis. Stat Modelling. 2006;6:209–29.
25. Loh TP, Metz MP. Trends and physiology of common serum biochemistries
in children aged 0-18 years. Pathology. 2015;47:452–61.
26. Goran MI, Gower BA. Longitudinal study on pubertal insulin resistance.
Diabetes. 2001;50:2444–50.
27. Ford ES, Li C, Imperatore G, Cook S. Age, sex, and ethnic variations in serum
insulin concentrations among U.S. youth: findings from the National Health
and nutrition examination survey 1999-2002. Diab Care. 2006;29:2605–11.
28. Savage MO, Smith CP, Dunger DB, Gale EA, Holly JM, Preece MA. Insulin and
growth factors adaptation to normal puberty. Horm Res. 1992;37(Suppl 3):70–3.
29. Ball GD, Huang TT, Gower BA, Cruz ML, Shaibi GQ, Weigensberg MJ, et al.
Longitudinal changes in insulin sensitivity, insulin secretion, and beta-cell
function during puberty. J Pediatr. 2006;148:16–22.
30. Robbins DC, Andersen L, Bowsher R, Chance R, Dinesen B, Frank B, et al.
Report of the American Diabetes Association’s task force on standardization
of the insulin assay. Diabetes. 1996;45:242–56.
31. Schwartz B, Jacobs DR, Moran A, Steinberger J, Hong CP, Sinaiko AR.
Measurement of insulin sensitivity in children: comparison between the
euglycemic-hyperinsulinemic clamp and surrogate measures. Diab Care.
2008;31:783–8.
32. Fox C, Bernardino L, Cochran J, Essig M, Bridges KG. Inappropriate use of
homeostasis model assessment cutoff values for diagnosing insulin
resistance in pediatric studies. J Am Osteopath Assoc. 2017;117:689–96.
33. Diabetes Control and Complications Trial Research Group, Nathan DM,
Genuth S, Lachin J, Cleary P, Crofford O, et al. The effect of intensive
treatment of diabetes on the development and progression of long-term
complications in insulin-dependent diabetes mellitus. N Engl J Med. 1993;
329:977–86.
34. Saaddine JB, Fagot-Campagna A, Rolka D, Narayan KM, Geiss L, Eberhardt M,
et al. Distribution of HbA(1c) levels for children and young adults in the U.
S.: third National Health and nutrition examination survey. Diab Care. 2002;
25:1326–30.