Performance characteristics of a local triage tool and internationally validated tools among under-fives presenting to an urban emergency department in Tanzania
Bạn đang xem bản rút gọn của tài liệu. Xem và tải ngay bản đầy đủ của tài liệu tại đây (1.04 MB, 7 trang )
Marombwa et al. BMC Pediatrics
(2019) 19:44
/>
RESEARCH ARTICLE
Open Access
Performance characteristics of a local triage
tool and internationally validated tools
among under-fives presenting to an urban
emergency department in Tanzania
Nafsa R. Marombwa1, Hendry R. Sawe1,2* , Upendo George2, Said S. Kilindimo1,2, Nanyori J. Lucumay1,
Kilalo M. Mjema1, Juma A. Mfinanga2 and Ellen J. Weber3
Abstract
Background: A number of region-specific validated triage systems exist; however very little is known about their
performance in resource limited settings. We compare the local triage tool and internationally validated tools
among under-fives presenting to an urban emergency department in Tanzania.
Methodology: Prospective descriptive study of consecutive under-fives seen at Muhimbili National Hospital (MNH),
ED between November 2017 to April 2018. Patients were triaged according to Local Triage System (LTS), and the
information collected were used to assign acuities in the other triage scales: Canadian Triage and Acuity Scale
(CTAS), Australasian Triage Scale (ATS), Manchester Triage Scale (MTS) and South African Triage Scale (SATS). Patients
were then followed up to determine disposition and 24 h outcome. Sensitivity, specificity, positive and negative
predictive values for admission and mortality were then calculated.
Results: A total of 384 paediatric patients were enrolled, their median age was 17 months (IQR 7–36 months). Using
LTS, 67(17.4%) patients were triaged in level one, 291(75.8%) level 2 and 26 (6.8%) in level 3 categories.
Overall admission rate was 59.6% and at 24 h there were five deaths (1.3%). Using Level 1 in LTS, and Levels
1 and 2 in other systems, sensitivity and specificity for admission for all triage scales ranged between 27.1–28.
4% and 95.4–98% respectively, (PPV 90.3–95.3%, NPV 47.1–47.4%). Sensitivity for mortality was 80% for LTS,
and 100% for the other scales, while specificity was low, yielding a PPV for all scales between 6.9 and 8%.
Conclusion: All triage scales showed poor ability to predict need for admission, however all triage scales
except LTS predicted mortality. The test characteristics for the other scales were similar. Future studies should
focus on determining the reliability and validity of each of these triage tools in our setting.
Keywords: Triage, Emergency department, Triage scales, Africa, Tanzania
* Correspondence:
1
Emergency Medicine Department, Muhimbili University of Health and Allied
Science, P.O. Box 65001, Dar Es Salaam-Tanzania Dar es Salaam, Tanzania
2
Emergency Medicine Department, Muhimbili National Hospital, Dar es
Salaam, Tanzania
Full list of author information is available at the end of the article
© The Author(s). 2019 Open Access This article is distributed under the terms of the Creative Commons Attribution 4.0
International License ( which permits unrestricted use, distribution, and
reproduction in any medium, provided you give appropriate credit to the original author(s) and the source, provide a link to
the Creative Commons license, and indicate if changes were made. The Creative Commons Public Domain Dedication waiver
( applies to the data made available in this article, unless otherwise stated.
Marombwa et al. BMC Pediatrics
(2019) 19:44
Background
Triage is the process of determining the priority of a patient to receive medical care based on the urgency and
severity of their condition. It involves categorising patients into different urgency levels according to their
medical complaints, vital signs, symptoms and available
resources so that the most acutely ill are seen first [1, 2].
The most widely used triage scores are the Manchester
Triage Score, the Australian Triage Score, the Canadian
Triage Score and the Emergency Severity Index, all of
which were developed in high income countries and
categorize patients into five levels of acuity [3, 4]. Emergency Severity Index (ESI) differs from other triage
scales in that, it determines the patient’s urgency based
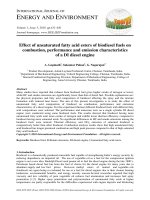
Fig. 1 Patients enrollment flow diagram
Page 2 of 7
on their presentation and predicts the resource
utilization as well as estimating resource utilisation for
lower acuity categories [5].
The first triage system developed in Africa was the
Cape Triage Score (CTS), and was validated in 2006. It
has now been widely adopted throughout South Africa
as the South African Triage Scale (SATS) [5, 6]. Unlike
ATS, MTS, ESI and CTAS, this system has four levels
[5, 7]. It uses triage early warning scores (TEWS) to predict the acuity level [8].
Triaging in paediatrics has been challenging due to several factors including the need for special communication
skills and different response to physiological stressors such
as dehydration and infections [9]. To overcome this,
Marombwa et al. BMC Pediatrics
(2019) 19:44
Page 3 of 7
several triage systems have been adapted, developed or
modified to improve the triage of children [10]. The ATS,
CTAS and ESI all have paediatric modifiers to assist in
using the same tool for both adults and children. MTS has
complaint specific flow charts for children. SATS has a
separate paediatric SATS scale as there are no modifiers
within SATS for children [11–14].
To date there are few fully developed emergency
departments in Tanzania; the Emergency Medicine Department of Muhimbili National Hospital (EMD-MNH)
was the first and opened in 2010. The triage system
used in this department has been adopted from ESI and
modified to suit our population whereby patients are
categorized as emergency, priority or queue, based on
their presenting complaint, symptoms and signs [15].
The other triage scales (MTS, ATS, CTAS and SATS)
have never been tested in this population. It is not
known whether the current system of triage is optimal,
or whether one of the existing validated scales should
be used in LMIC settings such as ours.
Methods
Study setting
MNH is a national referral government hospital with
1500 beds, and attending 1500 outpatients’ everyday. It
is located in Ilala district, Dar es Salaam City, Tanzania.
The EMD was opened in 2010, and serves an annual
average of 60,000 patients who are referred from across
Tanzania. The hospital has no formal admission policy,
the process of admission is based on combination of
providers clinical gestalt (on severity of illness) and
disease specific guidelines. About 25% of patients seen
in this department are paediatric age with 75% presenting with non-traumatic medical conditions [16]. There is
no validated triage tool that is used for triage of patients
in the EMD.
Participants
Paediatric patients below the age of five years with
non-traumatic medical complaints presenting to the
EMD-MNH were eligible. Patients arriving in respiratory
or cardiac arrest, returning for follow up, or who had a
history of trauma within two weeks were excluded. Consent for participation in the study was requested from
the adult accompanying the child.
Study design
This was a prospective descriptive study of a consecutive
sample of paediatric patients below the age of five years
with non-traumatic medical complaints presenting to
the EMD-MNH from November 2017 to April 2018.
Table 2 Relationship of triage scales with admission, discharge
and mortality
Triage
system
Triage
levels
Emergency Department Disposition
Admitted
Discharged
LTS
1
62(92.5%)
3(4.5%)
2(3%)
2
154(52.9%)
137(47.1%)
–
3
13(50%)
13(50%)
–
1
33(91.4%)
1(2.9%)
2(5.7%)
2
32(88.9%)
4(11.1%)
–
3
35(81.4%)
8(18.6%)
–
4
79(56.4%)
61(43.6%)
–
5
50(38.8%)
79(61.2%)
Table 1 Demographics characteristics of children presented to
ED with NTMC
Characteristics
N = 384
Median age in months (IQR)
17 (7–36)
Sex – male
211 (54.9)
Referral status
Referred
Not referred
Co-morbidities
n (%)
178 (46.4)
206 (53.6)
N = 25
Sickle cell disease
10 (40)
Congenital heart disease
13 (52)
HIV
Admission rate
ED outcome
Admitted
229 (59.6%)
n (%)
153 (39.4)
2 (0.5)
n (%)
68 (17.4)
Priority (level 2)
291 (75.8)
Queue (level 3)
26 (6.8)
KEY: HIV –Human Immunodeficiency Virus
CTS
229 (59.6)
Died
Emergency (level 1)
ATS
2 (8)
Discharged
Local triage scale
MTS
SATS
Died at ED
1
22(91.7%)
1(4.2%)
1(4.2%)
2
43(89.6%)
4(8.3%)
1(2.1%)
3
36(76.6%)
11(23.4%)
–
4
52(60.5%)
34(39.5%)
–
5
76(42.5%)
103(57.5%)
–
1
26(92.9%)
1 (3.6%)
1 (3.6%)
2
37(88.1%)
4(9.5%)
1(2.4%)
3
54(77.1%)
16(22.9%)
–
4
35(47.3%)
39(52.7%)
–
5
77(45.3%)
93(54.7%)
–
1
43(95.6%)
1(2.2%)
1(2.2%)
2
22(75.9%)
6(20.7%)
1(3.4%)
3
48(73.8%)
17(26.2%)
–
4
116(47.3%)
129(52.7%)
–
Marombwa et al. BMC Pediatrics
(2019) 19:44
Page 4 of 7
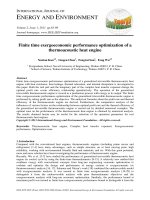
Fig. 2 The ROC curve for admission
Samples size
Our study population was paediatric patients below the
age of five years, and we estimated the minimum sample
size of 372 assuming a 59% admission rate, based on the
local EMD data for the year before this study. This sample size allowed a precise comparison of proportions of
triage levels by each triage scale.
Study protocol
A research assistant (RA) was scheduled in the department
every other day for 8–12 h during the study period alternating between day and nights. Eligible patients were consecutively enrolled after written informed consent was obtained.
The RA recorded initial triage information including chief
complaint, vital signs and acuity assigned by the triage
nurse. During the triage encounter, the RA calculated triage
acuity for each patient, using each of the following- MTS,
CTAS with paediatric modifiers, ATS with paediatric modifiers and paediatric SATS (Additional file 1). Subsequent to
triage, the RA recorded investigations done, ED diagnosis
and disposition from review of the electronic medical
record while the patient was in the ED. (Wellsoft Version
11 Corporation, Somerset, NJ, USA). Demographics and
other necessary information for triage were also obtained
from mother / guardian through interview. All children
were followed up. For those discharged, we contacted the
parents/ guardians by mobile phone (a call was made 3
times on three different days), and for those admitted; we
followed the patient to the specific wards in order to obtain
their 24-h outcome.
Outcomes: The outcomes of interest were the sensitivity, specificity, PPV and NPV of the triage acuity on each
scale for predicting admission and mortality.
Data analysis
Data were entered into SPSS software (V23) and analysed. Descriptive statistics (counts, percentages, median,
quartiles,) were obtained for demographic characteristics, distribution of patients in different triage categories
by each triage scale, and the proportions of admissions
and deaths within each triage acuity. To assess test characteristics (sensitivity, specificity, PPV, NPV) for
Table 3 Performance of triage scales in predicting Admission
Admission prediction
LTS
MTS
ATS
CTAS
SATS
Sensitivity (95% CI)
27.1% (22–33%)
28.4% (23–35%)
28.4% (23–35%)
27.5% (22–34%)
28.4% (23–35%)
Specificity (95% CI)
98% (94–100%)
96.7% (92–99%)
96.7% (92–99%)
96.7% (92–99%)
95.4% (90–98%)
PPV (95% CI)
95.4% (86–99%)
92.9% (83–97%)
92.9% (83–97%)
92.6% (83–97%)
90.3% (80–96%)
NPV (95% CI)
47.3% (42–53%)
47.4% (42–53%)
47.4% (42–53%)
47.1% (42–53%)
47.1% (42–53%)
(2019) 19:44
Marombwa et al. BMC Pediatrics
Page 5 of 7
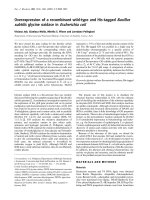
Fig. 3 The ROC curve for 24-h mortality
prediction of admission and 24-h mortality of each scale,
we created 2 groups from each triage scale: For ATS,
CTAS and MTS: high acuity Level 1 and 2, low acuity
3–5 (to level 4 in SATS), and for LTS, high acuity level 1
and low acuity level 2 and 3.
Results
Demographic characteristics
We enrolled and followed up 384 out 2030 under
fives with non-traumatic complaints who presented to
EMD during times when research assistant was available. Figure 1.
Of the 384 patients that were followed up, the median
age was 17 months (IQR 7–36 months) 211 (54.9%) were
male. In the local triage system, 67 (17.4%) were triaged
as emergency, 291 (75.8%) in priority group and 26
(6.8%) in queue group. Overall, 178 (46.4%) of patients
were referred from other hospitals. Table 1.
Triage assignment and outcomes
Among the enrolled patients, 229 (59.6%) were admitted,
153 (39.9%) discharged and 2 (0.5%) died at ED. The
proportion of patients admitted was highest in the high
acuity groups, and decreased with level of acuity in all
scales; the proportion of discharges was lowest in
the high acuity groups and increased with lower acuity assignments. Five patients (1.45%) died within 24
h, including the 2 ED deaths (both were haemodynamically unstable and they were triaged as level 1
in all triage scales). The MTS, ATS, CTAS and SATS
categorized all of these patients as acuity 1 or 2,
while LTS categorized 4 patients as emergent and 1
as priority. Table 2.
The area under the ROC (AUROC) curve for the outcome of admission for all triage scales ranged between
0.62–0.63 (Fig. 2). Sensitivity of high acuity assignment
for admission ranged between 27.1 and 29.4%, while specificity ranged from 95.4 to 98.0%. Results were similar
among all triage scales. Table 3.
With regard to ability to predict 24 h mortality, 41
patients were excluded due to missing data on 24 h
outcomes. The AUROC curve for mortality ranged
between 0.90–0.91 for all scales except for the LTs,
where the AUROC was 0.81 (Fig. 3). The sensitivity
for mortality was 80% for LTS and 100% for the other
Table 4 Performance of triage scales in predicting 24 h Mortality
Prediction of 24 h mortality
LTS
MTS
ATS
CTAS
SATS
Sensitivity (95% CI)
80% (30–99%)
100% (46–100%)
100% (46–100%)
100% (46–100%)
100% (46–100%)
Specificity (95% CI)
81.4% (77–85%)
80.2% (76–84%)
80.2% (76–84%)
80.8% (76–85%)
79.9% (75–84%)
PPV (95% CI)
6% (2–15%)
6.9% (3–16%)
6.9% (3–16%)
7.1% (3–17%)
6.8% (3–16%)
NPV (95% CI)
99.6% (98–100%)
100% (98–100%)
100% (98–100%)
100% (98–100%)
100% (98–100%)
Marombwa et al. BMC Pediatrics
(2019) 19:44
scales; NPV was 99.6%. (98–100%) for LTS and 100%
(98–100%) for all other scales. Table 4.
Discussion
Triage systems prioritize the care of ED patients according to the severity of their illness. In this study, patients
were assigned acuity levels using five triage scales based
on their initial presentation to the ED. The local triage
system (LTS) triaged more patients 67(17.4%) in level 1
compared to MTS, CTAS, ATS and SATS. However this
difference is likely due to the differences in number of
acuity levels; LTS has 3 levels unlike MTS, CTAS and
ATS, which have 5 levels, and SATS that has 4 levels.
Because there is no “gold standard” for acuity, many
prior studies have used proxy outcomes to determine
how well a triage system works [17]. In our study, we
used admission rates and mortality rates, as have others.
Using these proxy outcomes, the ideal triage tool should
be able to correctly identify those patients who will require admission and assign them to a high acuity while
those who will be discharged would be assigned to the
least acute categories. Similarly, the ideal scale would
classify those with a high risk of mortality into the
highest acuity levels. In this study, we found that the
performance of all five scales for disposition was similar:
the proportion of patients discharged decreased with the
level of urgency. However, performance of the scales was
different with regard to mortality. While the MTS, ATS,
CTAS and paediatric SATS classified patients who died
as either Level 1 or 2, the LTS missed one patient, classifying them as “priority” rather than “emergency.”
In predicting need for admission, all triage scales were
found to have low sensitivity (< 50%) and high specificity. These findings differ from those found in a study
done in Thailand where MTS and CTAS had higher
sensitivity and specificity compared to those found in our
study [18]. The low sensitivity for admission observed
among all triage scales in this study means many patients
assigned low acuities were nevertheless admitted (false
negatives). This is due to the hospital admission policies
where patients may be admitted for reasons other rather
than acuity. (Example: patients referred from other regions other than Dar es Salaam have to be admitted as
they have no other place to stay.) Our ED’s overall admission rate for patients under 5 is 59.6%. In a validation
study for the revised pediatric SATS scale, the proportion
of patients discharged rose from 27.2% among emergency
category to 95.3% in non-urgent patients, whereas even in
the lowest acuity category in our study, more than 50% of
patients were admitted [19].
In predicting mortality, LTS showed least ability to
predict mortality (sensitivity of 80%) compared to MTS,
ATS, CTAS and SATS (sensitivity of 100%, specificity
100%). The high sensitivity for mortality among these
Page 6 of 7
four scales is likely due to the overall low mortality rate
in the population studied. The ED accepts non-emergency patients who come as insured / private patients
and also those who come for elective admission or specialist referral. These are mostly stable patients, and can
easily be identified.
Limitations
Our study was a single centre study, which could limit
the generalizability of the results. Also, lack of a gold
standard for acuity meant that proxy outcomes were
used for test characteristics. Decisions on admission and
discharge may be affected by social reasons other than
clinical indications making this outcome less useful in
our hospital.
Conclusion
Among under-fives presenting to an ED of an urban tertiary hospital in Tanzania, all triage scales showed poor
ability to predict need for admission. All triage scales except LTS predicted mortality and test characteristics
among the other scales were similar. Future studies
should focus on determining the reliability and validity
of each of these triage tools in our setting.
Additional file
Additional file 1: Summary of differences in triage scales (DOC 31 kb)
Abbreviations
ATS: Australasian triage scale; CTAS: Canadian triage and acuity scale;
EMD: Emergency medicine department; ESI: Emergency severity index;
ETAT: Emergency triage, assessment and treatment; HIV: Human
immunodeficiency virus; ITS: Ipswich triage scale; LTS: Local triage scale;
MNH: Muhimbili National Hospital; MTS: Manchester triage scale;
MUHAS: Muhimbili University of Health and Allied Science;
PedCTAS: Paediatric Canadian triage and acuity scale; SATS: South African
Triage Scale; TEWS: Triage early warning score; TS: Triage scale; WHO: World
health organisation
Acknowledgements
The author would like to thank Dr. C. Moshiro, Dr. Michael Runyon, and Dr.
Brittany L. Murray, all Emergency Medicine specialists and residents, research
assistant and study participants for assistance on this project.
Ethical approval and consent to participate
Ethical clearance for this study was obtained from Muhimbili University of
Health and Allied Sciences’ (MUHAS) Institutional Review Board and
permission to conduct research in EMD was obtained from the Director of
Medical Services of MNH. Written informed consent was sought from all
patients, and child assent and parental permission sought prior to enrolment
into the study.
Funding
This was a non-funded project; the principal investigators used their own
funds to support the data collection and logistics.
Availability of data and materials
The dataset supporting the conclusion of this article is available from the
authors on request.
Marombwa et al. BMC Pediatrics
(2019) 19:44
Authors’ contributions
NRM conceptualized in designing the study, data curation, formal analysis,
funding acquisition, methodology, project administration, validation, writing
original draft and writing review and editing. HRS contributed to
conceptualization and design of the study, data curation, formal analysis,
methodology, validation, writing review and editing. UG contributed to
conceptualization, data curation, formal analysis, methodology, validation,
writing review & editing. SSK contributed to conceptualization, data curation,
formal analysis, writing review and editing. NJM contributed to
conceptualization, data curation, formal analysis, writing review and editing.
KMM contributed to conceptualization, data curation, formal analysis, writing
review and editing. JAM contributed to the conception and design of the
study, data review, and analysis and also revised the manuscript, EJW
contributed to conception and design of the study, data validation, review,
analysis and also critically revised the manuscript. All authors read and
approved the final manuscript.
Consent for publication
Not applicable.
Competing interests
The authors declare that they have no competing interest.
Publisher’s Note
Springer Nature remains neutral with regard to jurisdictional claims in
published maps and institutional affiliations.
Author details
1
Emergency Medicine Department, Muhimbili University of Health and Allied
Science, P.O. Box 65001, Dar Es Salaam-Tanzania Dar es Salaam, Tanzania.
2
Emergency Medicine Department, Muhimbili National Hospital, Dar es
Salaam, Tanzania. 3Department of Emergency Medicine, University of
California, San Francisco, California, USA.
Received: 18 September 2018 Accepted: 25 January 2019
References
1. Triage. In: Wikipedia. 2017 [cited 2017 Feb 19]. Available from: https://en.
wikipedia.org/w/index.php?title=Triage&oldid=765872998
2. Safari SR. Perceptions and challenges of using emergency triage assessment
treatment guideline in emergency department at Muhimbili national
hospital, Tanzania [Thesis]. Muhimbili University of Health and Allied
Sciences; 2012 [cited 2019 Jan 2]. Available from: :
8080/xmlui/handle/123456789/582
3. Christ M, Grossmann F, Winter D, Bingisser R, Platz E. Modern triage in the
emergency department. Dtsch Ärztebl Int. 2010 Dec;107(50):892–8.
4. Robertson-Steel I. Evolution of triage systems. Emerg Med J EMJ. 2006 Feb;
23(2):154–5.
5. Gottschalk SB, Wood D, DeVries S, Wallis LA, Bruijns S. The cape triage score:
a new triage system South Africa. Proposal from the cape triage group.
Emerg Med J. 2006 Feb 1;23(2):149–53.
6. American College of Emergency Physicians. A Uniform Triage Scale in
Emergency Medicine. ACEP; 1999. Available from: />globalassets/uploads/uploaded-files/acep/clinical-and-practicemanagement/resources/administration/triagescaleip.pdf.
7. TRIAGE_SCALE_IP.PDF - zotero://attachment/183/. [cited 2017 Apr 24].
Available from: zotero://attachment/183/.
8. Rominski S, Bell SA, Oduro G, Ampong P, Oteng R, Donkor P. The
implementation of the south African triage score (SATS) in an urban
teaching hospital, Ghana. Afr J Emerg Med. 2014 Jun 1;4(2):71–5.
9. Jafari-Rouhi AH, Sardashti S, Taghizadieh A, Soleimanpour H, Barzegar M.
The emergency severity index, version 4, for pediatric triage: a reliability
study in Tabriz Children’s hospital, Tabriz, Iran. Int J Emerg Med. 2013
Oct 2;6:36.
10. van Veen M, Moll HA. Reliability and validity of triage systems in paediatric
emergency care. Scand J Trauma Resusc Emerg Med. 2009 Aug 27;17:38.
11. Seiger N, van VM, Almeida H, Steyerberg EW, van MAHJ, Carneiro R, et al.
Improving the Manchester triage system for pediatric emergency care: an
international multicenter study. PLoS One. 2014 Jan 15;9(1):e83267.
Page 7 of 7
12. van VM, Steyerberg EW, Ruige M, van MAHJ, Roukema J, van der LJ, et al.
Manchester triage system in paediatric emergency care: prospective
observational study. BMJ. 2008;337:a1501.
13. Validity of the Manchester Triage System in paediatric emergency care (PDF
Download Available). ResearchGate. [cited 2017 Feb 19]; Available from:
/>Manchester_Triage_System_in_paediatric_emergency_care
14. Travers DA, Waller AE, Katznelson J, Agans R. Reliability and validity of the
emergency severity index for pediatric triage. Acad Emerg Med. 2009 Sep 1;
16(9):843–9.
15. WHO | Emergency Triage Assessment and Treatment (ETAT) course. WHO.
[cited 2017 Feb 20]. Available from: />adolescent/documents/9241546875/en/
16. Sawe HR, Mfinanga JA, Mwafongo V, Reynolds TA, Runyon MS. Trends in
mortality associated with opening of a full-capacity public emergency
department at the main tertiary-level hospital in Tanzania. Int J Emerg Med
[Internet]. 2015 Jul 22 [cited 2017 Feb 19];8. Available from: http://www.
ncbi.nlm.nih.gov/pmc/articles/PMC4510107/
17. de Magalhães-Barbosa MC, Robaina JR, Prata-Barbosa A, Lopes C de S.
Validity of triage systems for paediatric emergency care: a systematic
review. Emerg Med J. 2017 Nov;34(11):711–9.
18. WJEM-8-223.pdf. [cited 2018 May 12]. Available from: .
nih.gov/pmc/articles/PMC5496831/pdf/WJEM-8-223.pdf
19. Twomey M, Cheema B, Buys H, Cohen K, de Sà A, Louw P, et al. Vital signs for
children at triage: a multicentre validation of the revised south African triage
scale (SATS) for children. SAMJ South Afr Med J. 2013 May;103(5):304–8.