An outcome-based definition of low birthweight for births in low- and middleincome countries: A secondary analysis of the WHO global survey on maternal and perinatal health
Bạn đang xem bản rút gọn của tài liệu. Xem và tải ngay bản đầy đủ của tài liệu tại đây (878.68 KB, 9 trang )
Laopaiboon et al. BMC Pediatrics
(2019) 19:166
/>
RESEARCH ARTICLE
Open Access
An outcome-based definition of low
birthweight for births in low- and middleincome countries: a secondary analysis of
the WHO global survey on maternal and
perinatal health
Malinee Laopaiboon1, Pisake Lumbiganon2* , Siwanon Rattanakanokchai1, Warut Chaiwong3, João Paulo Souza4,
Joshua P. Vogel5,6, Rintaro Mori7 and Ahmet Metin Gülmezoglu8
Abstract
Background: 2500 g has been used worldwide as the definition of low birthweight (LBW) for almost a century.
While previous studies have used statistical approaches to define LBW cutoffs, a LBW definition using an outcomebased approach has not been evaluated. We aimed to identify an outcome-based definition of LBW for live births
in low- and middle-income countries (LMICs), using data from a WHO cross-sectional survey on maternal and
perinatal health outcomes in 23 countries.
Methods: We performed a secondary analysis of all singleton live births in the WHO Global Survey (WHOGS) on
Maternal and Perinatal Health, conducted in African and Latin American countries (2004–2005) and Asian countries
(2007–2008). We used a two-level logistic regression model to assess the risk of early neonatal mortality (ENM)
associated with subgroups of birthweight (< 1500 g, 1500–2499 g with 100 g intervals; 2500–3499 g as the reference
group). The model adjusted for potential confounders, including maternal complications, gestational age at birth,
mode of birth, fetal presentation and facility capacity index (FCI) score. We presented adjusted odds ratios (aORs)
with 95% confidence intervals (CIs). A lower CI limit of at least two was used to define a clinically important
definition of LBW.
Results: We included 205,648 singleton live births at 344 facilities in 23 LMICs. An aOR of at least 2.0 for the ENM
outcome was observed at birthweights below 2200 g (aOR 3.8 (95% CI; 2.7, 5.5) of 2100–2199 g) for the total
population. For Africa, Asia and Latin America, the 95% CI lower limit aORs of at least 2.0 were observed when
birthweight was lower than 2200 g (aOR 3.6 (95% CI; 2.0, 6.5) of 2100–2199 g), 2100 g (aOR 7.4 (95% CI; 5.1, 10.7) of
2000–2099 g) and 2200 g (aOR 6.1 (95% CI; 3.4, 10.9) of 2100–2199 g) respectively.
Conclusion: A birthweight of less than 2200 g may be an outcome-based threshold for LBW in LMICs. Regionalspecific thresholds of low birthweight (< 2200 g in Africa, < 2100 g in Asia and < 2200 g in Latin America) may also
be warranted.
Keywords: Low birthweight, Outcome-based definition, Early neonatal mortality
* Correspondence: ;
2
Department of Obstetrics and Gynaecology, Faculty of Medicine, Khon Kaen
University, Khon Kaen, Thailand
Full list of author information is available at the end of the article
© The Author(s). 2019 Open Access This article is distributed under the terms of the Creative Commons Attribution 4.0
International License ( which permits unrestricted use, distribution, and
reproduction in any medium, provided you give appropriate credit to the original author(s) and the source, provide a link to
the Creative Commons license, and indicate if changes were made. The Creative Commons Public Domain Dedication waiver
( applies to the data made available in this article, unless otherwise stated.
Laopaiboon et al. BMC Pediatrics
(2019) 19:166
Background
The term low birthweight (LBW) is defined by the
World Health Organization (WHO) as the weight at
birth of a neonate less than 2500 g (g), a cut-off that is
often consistent with 10th percentile for gestation [1, 2].
This cut-off was based on epidemiological observations
that neonates of birthweight less than 2500 g were more
likely to die than heavier newborns [3], with mortality
rates rising rapidly as birthweight decreases [4–6].
WHO advises that the 2500 g cut-off value should be
used for international health statistics comparisons [1].
Low birthweight is an important public health indicator of maternal malnutrition and health, and poor antenatal care [1, 3]. Globally, more than 20 million
newborns (an estimated 15.5% of all births) are born low
birthweight each year. More than 95% of these LBW neonates are born in low- and middle-income countries
(LMICs) [1]. There is significant variation of LBW rates
among geographical regions. The highest LBW rates are
seen in Asia (18.3%), about three times higher than the
lowest rate, in Europe (6.4%). There is considerable variation between sub-regions in Asia, ranging from 5.9% in
Eastern Asia to 27% in South-central Asia [1, 7].
LBW has been associated with increased risks of neonatal mortality and several neonatal morbidities, including birth asphyxia, acute respiratory infections and
diarrhea disease, as well as longer-term adverse health
outcomes such as neurological disorders, impaired language development, poor academic performance, cardiovascular disease and diabetes [3, 8, 9]. Decreasing the
global burden of LBW could substantially reduce costs
to families and o healthcare systems in LMICs [10].
However, some evidence has emerged that the cut-off
value of 2500 g to define LBW may not be appropriate
for all settings. For example, some countries such as Sri
Lanka have a high prevalence of neonates with birthweight less than 2500 g do not have correspondingly
high neonatal mortality rates [11]. To this effect, WHO
suggested that individual countries should adopt a
population-specific cut-off value for LBW to guide clinical care [1]. However, in practice a birthweight below
2500 g is still in routine use in most LMICs.
Defining an appropriate LBW cut-off is challenging. If
too low, some neonates may not get necessary care. Alternatively, if the value is too high, some neonates may
get additional care that is not necessary. In many
LMICs, inappropriate use of limited health resources
can disadvantage neonates requiring more intensive care.
Therefore, further investigation of the most appropriate
cut-off for LBW remains an important issue.
Previous studies have defined population-specific cutoffs for LBW in high-income countries (HICs) [12, 13]
and LMICs [14, 15]. This is typically done using statistical methods, where the lowest 10th percentile of the
Page 2 of 9
birthweight distribution is used as the cut-off for LBW.
These has often resulted in LBW cut-offs higher than
2500 g – for example, 2750 g in the US in 1992 [12] to
3000 g in Denmark in 2007 [13]. Recent studies in
LMICs have also identified alternative LBW cut-offs,
such as 2600 g in a study in sub-urban Cameroon [14]
and 2700 g in a rural community [15] in Cameroon.
Previous studies have used an outcome-based approach for identification of cut-off weights for fetal
growth [16] and macrosomia [17]. By using the Health
Statistics database for the years 1995–2002 of the United
State National Center, Joseph et al. generated fetal
growth standards for singleton and twin neonates based
on severe morbidity and mortality outcomes [16]. In a
secondary analysis of the database of the World Health
Organization (WHO) Global Survey on Maternal and
Perinatal Health (2004–2008) conducted in 23 LMICs in
Africa, Asia, and Latin America, Ye et al. defined macrosomia based on the adjusted assoiated risk of birthweight for maternal and perinatal mortality and
morbidity in term pregnancies [17]. However, we have
identified no previous analyses that have defined a LBW
cut-off value using an outcome-based approach. This
study therefore aimed to identify an outcome-based definition of LBW for LMICs using the WHO Global Survey database.
Methods
Study design and population
We conducted a secondary analysis using data from the
WHO Global Survey (WHOGS) on Maternal and Perinatal Health conducted in Africa, Asia and Latin America.
The WHOGS was a prospective, facility-based, crosssectional survey on maternal and perinatal health interventions and outcomes. The primary aim of the survey
was to assess the association between mode of birth and
maternal and perinatal health outcomes [18, 19]. Details
of the survey have been reported elsewhere [18–20]. A
total of 373 facilities in 24 countries in three regions participated in this survey. Data collection was performed in
2004–05 for Africa and Latin America, and in 2007–08
for Asia. Trained data collectors reviewed medical records
of individual women from the time of attending participating facilities for delivery until discharge, death or day 7
postpartum. Data were abstracted from medical records
into structured case record forms. The period of data collection was two months in facilities with at least 6000 deliveries per year and three months in facilities with less
than 6000 deliveries per year. Institutional data were collected for each participating facility, including information
on available resources for obstetric care. The data was obtained through an interview with the hospital director or
head of obstetrics, and data entered into the pre-specified
institutional form.
Laopaiboon et al. BMC Pediatrics
(2019) 19:166
Page 3 of 9
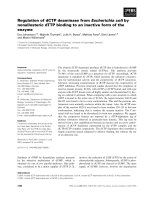
Fig. 1 Flow chart of inclusion and exclusion of study neonates
The WHOGS protocol was approved by the WHO
ethics review committee and the relevant local review
committees for all participating centres [19]. Individual
informed consent was not obtained; survey data were
extracted from medical records without individual identification or patient contact [19]. We received permission
to use this data from the Department of Reproductive
Health and Research, WHO on January 14th, 2014.
Our analysis was restricted to singleton, live newborns
in participating facilities in low- and middle-income
countries (facilities and newborns in Japan were excluded). We aimed to evaluate associations between
birthweight cut- offs and early neonatal mortality (ENM)
. ENM was defined as death occurring in hospital prior
to discharge or Day 7 (whichever came first). We adjusted for potential confounders, including maternal
complications (such as chronic hypertension, sickle cell
anaemia) gestational age at birth, mode of birth and fetal
presentation at birth. Newborns with missing information on birthweight, ENM outcome and potential confounders were excluded. We also excluded facilities that
had less than 50 newborns [21]. The selection process
for the analysis population is shown in Fig. 1.
We used data on the availability of basic and essential
maternal healthcare services of individual participating
facilities as potential confounding factors at facility level.
Facilities were classified into different levels, using the
existing WHOGS facility capacity index (FCI) score [18].
FCI scores ranged between 0 and 16. Facilities with a
total score of 9 or less were defined as low capacity,
those with scores of between 10 and 12 as medium capacity, and those with scores of 13 or more as high capacity [18].
Statistical analysis
We assessed the association of birthweight groups with
ENM using two-level logistic regression models. We
assigned facilities to represent units at level two and individuals within facilities at level one. We used the birthweight range of 2500–3499 g as the reference group
based on the current global clinical practice for normal
neonatal birthweight range. In addition, the rates of
ENM at 100 g intervals within 2500 – 3499 g were quite
similar (around 0.5% in our database) [see Additional file 1]. We classified birthweights of 1500–2499 g
into 100 g intervals. Birthweights less than 1500 g were
classified into one group. We adjusted for potential confounders at both levels in the models (see above). We estimated adjusted odds ratios (ORs) and 95% confidence
intervals (CIs) of ENM by absolute birthweight subgroups. We analysed all associations in the whole database and by region (Africa, Asia and Latin America).
It is well-known that the risk of adverse neonatal outcomes increases as birthweight decreases; very low birthweight infants (1500 g or less) are at greatest risk [22–
25]. We applied this concept in our analysis to identify
an appropriate low birthweight cut-off based on the
ENM. We used an a priori odds ratio threshold of 2.0
Laopaiboon et al. BMC Pediatrics
(2019) 19:166
Page 4 of 9
Table 1 Country-specific birthweight and early neonatal mortality distribution of singleton liveborn births
Countries
Total
Number
of
facilities
Number
of
newborns
Birthweight (g)
Mean
(SD)
< 1500 (%)
< 2500 (%)
Early
Neonatal
Mortality
(%)
344
205,648
2902
(413)
1.0
12.0
0.8
118
52,603
2935
(389)
0.8
9.9
1.1
Algeria
18
7516
3025
(390)
1.0
7.4
1.3
Angola
15
3920
2903
(405)
1.2
11.8
0.5
Africa
Congo
21
6767
2874
(392)
0.6
14.4
1.0
Kenya
20
13,586
2921
(395)
1.0
9.7
1.8
Niger
11
6526
2906
(381)
0.5
11.6
0.4
Nigeria
21
5704
2932
(380)
0.9
8.2
0.8
Uganda
12
8584
2964
(363)
0.6
7.7
1.1
112
85,222
2838
(406)
0.8
14.2
0.7
Cambodia
5
4457
2897
(383)
0.8
9.3
1.1
China
21
9357
3045
(332)
0.4
5.5
0.3
Asia
India
20
22,008
2653
(405)
1.2
22.1
1.1
Nepal
8
6852
2786
(386)
0.5
13.7
0.9
Philippines
17
11,732
2819
(419)
1.3
16.2
1.1
Sri Lanka
14
13,191
2846
(381)
0.6
15.5
0.2
Thailand
12
8068
2939
(380)
0.7
10.8
0.4
Viet Nam
15
9557
2997
(335)
0.3
5.7
0.1
Latin America
114
67,823
2958
(428)
1.4
10.8
0.7
Argentina
14
6661
2975
(453)
1.9
11.0
0.5
Brazil
19
10,955
2956
(437)
1.5
11.6
0.8
Cuba
17
8300
3013
(379)
0.7
8.0
0.2
Ecuador
14
9666
2898
(432)
1.5
12.4
0.7
Mexico
21
15,716
2932
(429)
1.5
11.6
0.6
Nicaragua
6
4271
2946
(384)
0.7
9.5
1.0
Paraguay
6
2001
2990
(442)
1.6
10.4
1.1
Peru
17
10,253
2997
(438)
1.7
9.8
1.0
(for the lower confidence interval) as a criterion for clinical significance, as per previous studies [17, 26, 27].
Thus, in this analysis the clinical significance was defined as when the lower limit of the 95% confidence
interval for the adjusted OR was at least 2.0 [28]. We,
therefore, defined LBW from the lowest birthweight of
the subgroup that its lower subgroups had lower limit of
the 95% confidence interval for adjusted OR was at least
2.0 [28].
The descriptive analyses were also done using R software. We used package lme4 of R software to analyse
the two-level logistic regression model [29].
Results
A total of 205,648 singleton live newborns at 344 facilities in 23 LMICs were included in this analysis (Fig. 1).
There were differences in the birthweight distribution
for the three regions. Mean birthweights were 2935 g
(SD 389 g) in Africa, 2838 g (SD 406 g) in Asia and 2958
g (SD 428 g) in Latin America. The rates of birthweight
< 2500 g were 9.9, 14.2 and 10.8%, in Africa, Asia and
Latin America respectively. The rates of birthweight <
1500 g were 0.8, 0.8 and 1.4%, in Africa, Asia and Latin
America respectively. Wide variation of birthweight was
observed between Asian countries (Table 1).
We present the associations between birthweight intervals and potential confounding factors in Table 2.
Mean gestational age was positively associated with
birthweight. Higher rates of all potential confounding
factors were seen among infants with lower birthweights.
In the study population, the caesarean section rate was
24.3 and 16.9% of women had a maternal complication.
ENM rates were 1.1, 0.7 and 0.7% in Africa, Asia and
Latin America respectively. When compared to the
Laopaiboon et al. BMC Pediatrics
(2019) 19:166
Page 5 of 9
Table 2 Distribution of individual potential confounding factors by birthweight
Cesarean section
Breech presentation at birth
Maternal complicationsa
(SD)
(%)
(%)
(%)
(2.0)
49,964 (24.3)
9099 (4.4)
34,642 (16.9)
30.6
(4.1)
38.9
18.6
25.3
33.1
(3.2)
32.4
11.1
20.3
521
33.7
(3.1)
39.3
12.1
22.5
811
34.4
(3.0)
35.8
12.1
20.3
1800–1899
973
34.6
(2.9)
35.9
10.4
22.1
1900–1999
1032
35.2
(2.9)
36.7
9.5
23.3
2000–2099
2807
36.7
(2.6)
26.7
7.5
15.7
2100–2199
2165
36.9
(2.5)
29.7
7.3
19.2
2200–2299
3817
37.2
(2.3)
26.2
6.4
15.6
2300–2399
4178
37.6
(2.0)
25.5
5.2
18.2
2400–2499
5628
37.9
(2.0)
25.9
5.5
18.7
2500–3499
181,042
38.8
(1.6)
23.7
3.9
16.6
Birthweight
(g)
n
Gestational age
Mean
Overall
205,648
38.5
< 1500
2072
1500–1599
602
1600–1699
1700–1799
All variables differed significantly by birthweight categories (p-value < 0.001)
a
Maternal complications included chronic hypertension, cardiac disease, renal disease, chronic respiratory condition, diabetes mellitus, malaria, sickle cell anaemia,
severe anaemia, pyelonephritis or urinary infection, HIV/AIDS, Thalassemia and other medical conditions
reference (normal birthweight) group (2500–3499 g), adjusted ORs of ENM show statistical significance when
birthweight was lower than 2500 g in the total population and each region. However, adjusted ORs of ENM in
birthweights of 2300–2399 g in Africa (aOR 1.7 (95% CI;
0.9, 3.3)) and Asia (aOR 1.3 (95% CI; 0.6, 2.7)) did not
reach statistical significance.
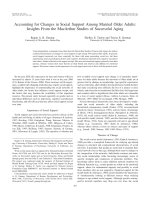
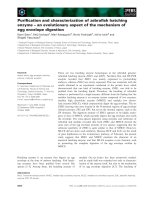
The adjusted ORs of ENM were similar (about 2.0)
for birthweight intervals 2400-2499 g and 2200-2299 g,
compared to the reference group. The adjusted ORs
gradually increased from 3.8 (95% CI; 2.7, 5.5) for
birthweights of 2100–2199 g to 17.9 (95% CI; 13.3,
24.1) in birthweights of 1500–1599 g (Fig. 2). The
adjusted OR increased up to 32.0 (95% CI; 25.6, 40.0)
in birthweight < 1500 g (Table 3). Based on the predefined clinical significance criterion for aOR (lower
limit of 95% CI of 2.0), the LBW cut-off was 2200 g for the
total population.
When compared to the reference group (2500–3499
g), the adjusted ORs of ENM in birthweight of < 2500 g
were high across all three regions, similar to the total
population. However, the adjusted ORs of ENM in birthweight of < 1500 g in Asia reached 54.3 (95% CI; 37.4,
78.9) while those in Africa and Latin America was 30.4
(95% CI; 21.1, 43.7) and 18.1 (95% CI; 11.5, 28.5),
respectively (Table 4).
Fig. 2 Adjusted odds ratios with 95% CI of early neonatal mortality by birthweight in the total population. Solid red line shows the adjusted OR
2.0 for clinical significance
(2019) 19:166
Laopaiboon et al. BMC Pediatrics
Page 6 of 9
Table 3 Rate and adjusted odds ratios of early neonatal
mortality by birthweight
Early Neonatal Mortalitya
Birthweight
(g)
n
Rate (%)
Adjusted OR (95% CI)
< 1500
2072
29.0
32.0 (25.6, 40.0)
1500–1599
602
13.8
17.9 (13.3, 24.1)
1600–1699
521
9.6
12.5 (8.8, 17.7)
1700–1799
811
6.2
9.5 (6.8, 13.2)
1800–1899
973
6.8
10.5 (7.8, 14.1)
1900–1999
1032
3.6
5.9 (4.1, 8.5)
2000–2099
2807
3.1
6.6 (5.2, 8.5)
2100–2199
2165
1.6
3.8 (2.7, 5.5)
2200–2299
3817
1.0
2.6 (1.9, 3.7)
2300–2399
4178
0.6
1.7 (1.1, 2.6)
2400–2499
5628
0.7
2.3 (1.7, 3.1)
2500–3499
181,042
0.3
1.0
Adjusted for gestational age, mode of delivery, fetal presentation at delivery,
maternal complications and complexity index
a
ROC = 0.9118
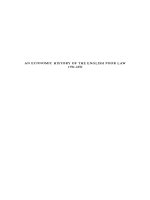
With regards to the pre-defined clinical significance
criterion, in Africa the adjusted OR was 3.6 (95% CI;
2.0, 6.5) in birthweights of 2100–2199 g. In Asia, the
adjusted OR was 7.4 (95% CI; 5.1, 10.7) in birthweights of 2000–2099 g. In Latin America, the adjusted OR was 6.1 (95% CI; 3.4, 10.9) in birthweights
of 2100-2199 g. Therefore, the LBW cut-offs were
2200 g, 2100 g and 2200 g for Africa, Asia and Latin
America respectively (Fig. 3).
Discussion
Our findings show that a low birthweight cut-off based
on ENM outcome is 2200 g for a large, multi-country
population of live singleton newborns. The low birthweight cut-off at regional level were similar, 2200 g,
2100 g and 2200 g for Africa, Asia and Latin America respectively. These LBW cut-offs are lower than the traditional criterion of 2500 g. The risks of ENM were quite
similar among newborns in with birthweight ranges of
2200–2299 g, 2300–2399 g and 2400–2499 g with adjusted ORs around two, but their lower limit of the 95%
confidence intervals did not reach our pre-specified criterion for clinical significance.
Although the a priori adjusted OR of 2.0 for ENM was
arbitrarily set as clinically important, the value has been
used in previous studies. Ye et al. [17] used the OR of
2.0 to define macrosomia that is clinically significant risk
for maternal and perinatal mortality and morbidity in
LMICs, also using the WHOGS database. Boulet et al.
[27] also used this value for defining clinically important
fetal growth restriction. Barrette et al. [26] used the inverse value of 2.0 relative risk (0.5) to clinically justify
difference between the planned caesarean delivery and
vaginal delivery in the randomized trial of the Twin Birth
Study Collaborative Group. However, previous studies
[17, 26, 27] did not report whether the clinically significant OR of 2.0 was identified with respect to the lower
95% confidence interval. This concept has been suggested by Mccluskey [28] in which clinical significance
of any data has to be above or below the range of confidence interval that shows statistical significance. We
Table 4 Rate and adjusted odds ratios of early neonatal mortality by birthweight and regions
Birthweight
(g)
Early neonatal mortality
Africaa (n = 52,603)
Asiab (n = 85,222)
Latin Americac (n = 67,823)
n
Rate (%)
Adjusted OR (95% CI)
n
Rate (%)
Adjusted OR (95% CI)
n
Rate (%)
Adjusted OR (95% CI)
< 1500
435
36.8
30.4 (21.1, 43.7)
677
28.5
54.3 (37.4, 78.9)
960
25.8
18.1 (11.5, 28.5)
1500–1599
114
22.8
20.6 (11.9, 35.7)
327
11.9
23.1 (14.9, 36.0)
161
11.2
13.9 (7.5, 25.5)
1600–1699
116
14.7
11.0 (6.0, 20.4)
209
7.7
15.6 (8.5, 28.5)
196
8.7
12.4 (6.8, 22.8)
1700–1799
143
7.7
6.4 (3.2, 12.7)
387
5.9
13.4 (8.2, 22.0)
281
5.7
8.8 (4.8, 16.1)
1800–1899
175
12.6
11.5 (6.8, 19.5)
458
7.0
16.3 (10.6, 25.2)
340
3.5
5.2 (2.7, 10.3)
1900–1999
228
6.6
6.5 (3.7, 11.6)
431
2.8
7.4 (3.9, 13.9)
373
2.7
4.4 (2.2, 9.0)
2000–2099
636
4.1
5.5 (3.6, 8.6)
1571
2.7
7.4 (5.1, 10.7)
600
3.2
8.3 (4.8, 14.3)
2100–2199
481
2.7
3.6 (2.0, 6.5)
999
0.8
2.7 (1.3, 5.6)
685
2.0
6.1 (3.4, 10.9)
2200–2299
682
2.2
3.0 (1.8, 5.2)
2225
0.7
2.3 (1.4, 4.0)
910
0.9
3.0 (1.4, 6.3)
2300–2399
901
1.1
1.7 (0.9, 3.3)
2043
0.3
1.3 (0.6, 2.7)
1234
0.6
2.6 (1.3, 5.5)
2400–2499
1293
1.3
2.2 (1.3, 3.6)
2772
0.5
2.2 (1.3, 3.7)
1563
0.6
3.0 (1.5, 5.8)
2500–3499
47,399
0.5
1.0
73,123
0.2
1.0
60,520
0.1
1.0
Adjusted for gestational age, mode of delivery, fetal presentation at delivery, maternal complications and complexity index
a
ROC = 0.8804
b
ROC = 0.9101
c
ROC = 0.9245
Laopaiboon et al. BMC Pediatrics
(2019) 19:166
Page 7 of 9
Fig. 3 Adjusted odds ratios with 95% CI of early neonatal mortality by birthweight in the three regions. Solid red line shows the adjusted OR 2.0
for clinical significance
consider these findings to be reliable in identify the clinically important outcome-based definition of low birthweight using ENM as a primary outcome.
The findings of this analysis are outcome-based criteria for which the definition of low birthweight was
identified from the association model between birthweight and ENM adjusted for important confounding
factors, maternal complications, gestational age at birth,
mode of birth, fetal presentation and facility complexity
index. The analyses were performed in the large, multicountry dataset of the WHO Global Survey [18]. Our
findings based on the outcome-based approach done in
the large database may be more appropriate than those
based on statistical criteria [14, 30–34]. For example,
Brimblecombe [30] suggested the classification of low
birthweight based on birthweight distributional components. This study proposed two Gaussian distributions
to describe birthweight - the primary distribution was
composed of the majority of birthweights, whereas the
secondary distribution was the minority of high-risk
birthweights centered at the lower tail of the primary
distribution. In 1980 Rooth proposed a definition of low
birthweight based on a cut-off of weights less than two
standard deviations below the local population mean,
that better predicted risk for neonatal mortality [31].
Wilcox and Russell proposed an approach to explain association between birthweight and perinatal mortality.
They suggested three parameters should define birthweight characteristics of a population: 1) mean and 2)
standard deviation of the Gaussian distribution that included between 95 and 98% of term birthweight population, and 3) the proportion of all births in the residual
distribution that mostly consisted of small preterm birth
[32–34]. Recently, Njim et al. [14] conducted a twophased observational study to set a clinical cut-off point
for LBW and to assess its incidence, predictors and
complications in a sub-urban hospital in Cameroon. The
authors found 2600 g was the cut-off at the 10th centile
of birth weight for low birthweight. The cut-off point
provided significant higher incidence of low birthweight
(19%) than that of the traditional cut-off of 2500 g (13.5%).
They also showed that newborns with birthweights
between 2500 g and 2600 g had significant higher rates of
complications than those with birthweights > 2600 g in
the study population. Agbor et al. [15] also performed a
study with a similar objective and method to Njim et al.’s
paper in a rural sub-division in Cameroon. They assessed
the statistical LBW cut-off at the 10th percentile of the observed birthweights distribution. They also made the comparison of neonatal adverse outcomes between LBW
(birthweight <10th percentile) and heavier neonates
(birthweight ≥10th percentile) in the study population for
assessing the clinical significance. The authors reported
the clinical cut-off point for LBW at 2700 g in the rural
community in Cameroon. They found 6.1% of neonates
had birthweights between 2500 g and 2700 g, with higher
stillbirth rate (about 3 %, 5/163) than those of heavier neonates (< 1 %, 12/1553).
In our findings the odds of ENM clearly increased for
every 100 g reduction of birth weight after 2200 g. Malin
et al. reported a similar finding in a systematic review a birthweight less than 1500 g had the highest odds of
neonatal mortality (OR 48.6, 95% CI 28.62, 82.53). Increasing the birthweight cut-off point to 2000 g, 2500 g
or 2900 g gradually reduced the risk, but the summary
estimates remained highly significant at each cut-off
point [14]. This review did not report the risk of neonatal mortality by a narrower birthweight range (100 g
each) as we did.
This study was a secondary analysis of the WHO Global
Survey database conducted in 23 countries across Africa,
Asia and Latin America. Trained personnel systematically
collected the data. In the analyses, we controlled for important confounding factors of ENM such as maternal
complications, gestational age at delivery, and mode of
birth. However, the WHOGS database was primarily
aimed at evaluating different modes of delivery and pregnancy outcomes, rather than to explore newborn birthweights specifically. The WHOGS was a facility-based
survey, performed in large, secondary and tertiary facilities
where caesarean section was available. Our findings might
lead to over-representation of neonatal adverse outcomes
and consequently might not reflect the situation in smaller
facilities. There might be errors in birthweight data due to
Laopaiboon et al. BMC Pediatrics
(2019) 19:166
Page 8 of 9
variations between facilities in the quality of birthweight
measurement. For example, medical personnel might preferentially report birthweight values ending in a rounded
number (0 or 5) which may affect the study findings. Our
primary outcome focused only on early neonatal death occurring prior to discharge or day 7; information was not
available on late neonatal or infant deaths. The crosssectional study design only permits us to evaluate associations rather than causation.
Ethics approval and consent to participate
WHO Global Survey on Maternal and Perinatal Health (WHOGS, 2004–08) was
approved by the research ethics review committee of World Health
Organization and the relevant ethical clearance mechanisms in all countries.
We received permission to use the data of this study from the Department
of Reproductive Health and Research, WHO on the date January 14, 2014.
Conclusions
Our analysis suggests that the outcome-based definition
of LBW of less than 2200 g may be used instead of the
conventional less than 2500 g for assessing BW risk for
early neonatal mortality. A regional specific definition of
low birthweight (< 2200 g in Africa, < 2100 g in Asia and
< 2200 g in Latin America) are quite similar and may be
more appropriate for each region.
Author details
1
Department of Epidemiology and Biostatistics, Faculty of Public Health,
Khon Kaen University, 123 Mittraphap Road, Nai-Muang, Muang District,
Khon Kaen 40002, Thailand. 2Department of Obstetrics and Gynaecology,
Faculty of Medicine, Khon Kaen University, Khon Kaen, Thailand. 3Bangkok
Health Research Center 2 Soi Soonvijai 7, New Petchburi Rd., Huaykwang,
Bangkok 10310, Thailand. 4Department of Social Medicine, Ribeirão Preto
Medical School, University of São Paulo, Ribeirão Preto, SP, Brazil. 5UNDP •
UNFPA • UNICEF • WHO • World Bank Special Programme of Research,
Development and Research Training in Human Reproduction, Department of
Reproductive Health and Research, World Health Organization, Geneva,
Switzerland. 6Maternal and Child Health Program, Burnet Institute, 85
Commercial Road, Melbourne 3004, Australia. 7Department of Health Policy,
National Center for Child Health and Development, Tokyo, Japan.
8
Department of Reproductive Health and Research World Health
Organization, Avenue Appia 20, CH-1211 Geneva 27, Switzerland.
Additional file
Additional file 1: The percentage of early neonatal mortality by 100 g
interval of birthweights. The rates of ENM among 100 g intervals of these
birthweights are quite similar of around 0.5% in our analysed database.
(PDF 185 kb)
Abbreviations
aORs: Adjusted odds ratios; CIs: Confidence intervals; ENM: Early neonatal
mortality; FCI: Facility capacity index; g: Grams; kg: Kilograms; LBW: Low
birthweight; LMICs: Low and middle income countries; ORs: Odds ratios;
WHO: World Health Organization; WHOGS: WHO Global Survey
Acknowledgements
The authors wish to thank all members of the WHO Global Survey on
Maternal and Perinatal Health (WHOGS, 2004–08), including regional and
country coordinators, data collection coordinators, facility coordinators, data
collectors, and all of the WHO offices and other staff of participating facilities
who made the survey possible.
Authors’ contributions
This study was conceptualized by ML and PL. ML and PL created initial draft
of manuscript. SR and WC contribute to data analysis. ML, PL, SR, WC, JPS,
JPV, RM and AMG authors interpreted results, read, participated in the final
discussion and approved the submission.
Funding
WHO Global Survey on Maternal and Perinatal Health (WHOGS, 2004–08) was
financially supported by the UNDP/UNFPA/WHO/World Bank Special
Programme of Research, Development, and Research Training in Human
Reproduction (HRP); WHO; United States Agency for International
Development (USAID); Ministry of Health, Labour and Welfare of Japan;
Ministry of Public Health of the People’s Republic of China; and the Indian
Council of Medical Research, India.
This secondary analysis study was financially supported by Thailand Research
Fund (Distinguished Professor Award).
The sponsors had no role in data collection, analysis, or interpretation of the
data, the writing of the report, or the decision to submit for publication.
Availability of data and materials
The datasets generated and/or analyzed during the current study are not
publicly available due to they belonged to Department of Reproductive
Health and Research, The World Health Organization but could be available
from WHO on reasonable request.
Consent for publication
Not applicable.
Competing interests
The authors declare that they have no competing interests.
Received: 20 August 2018 Accepted: 20 May 2019
References
1. Wardlaw T, World Health Organization, UNICEF, editors. Low birthweight:
country regional and global estimates. Geneva: New York: WHO; UNICEF;
2004.
2. World Health Organization. ICD-10: international statistical classification of
diseases and related health problems. 10th ed. Geneva: World Health
Organisation; 1992.
3. Kramer MS. Determinants of low birth weight: methodological assessment
and meta-analysis. Bull World Health Organ. 1987;65:663–737.
4. Chase HC. Infant mortality and weight at birth: 1960 United States birth
cohort. Am J Public Health Nations Health. 1969;59:1618–28.
5. Ghosh S. Weight of all births and infant mortality. J Epidemiol Community
Health. 1982;36:315.
6. Saugstad LF. Weight of all births and infant mortality. J Epidemiol
Community Health. 1981;35:185–91.
7. Cutland CL, Lackritz EM, Mallett-Moore T, Bardaji A, Chandrasekaran R,
Lahariya C, et al. Low birth weight: case definition & guidelines for data
collection, analysis, and presentation of maternal immunization safety data.
Vaccine. 2017;35(48 Pt A):6492–500.
8. Zerbeto AB, Cortelo FM, Élio Filho BC. Association between gestational age
and birth weight on the language development of Brazilian children: a
systematic review. J Pediatr. 2015;91:326–32.
9. Badshah S, Mason L, McKelvie K, Payne R, Lisboa PJ. Risk factors for low
birthweight in the public-hospitals at Peshawar, NWFP-Pakistan. BMC Public
Health. 2008;8:197.
10. Sicuri E, Bardají A, Sigauque B, Maixenchs M, Nhacolo A, Nhalungo D, et al.
Costs associated with low birth weight in a rural area of southern
Mozambique. PLoS One. 2011;6:e28744.
11. Pathmanathan I, Liljestrand J, Martins JM, Rajapaksa LC, Lissner C, de Silva A,
et al. Investing in maternal health: learning from Malaysia and Sri Lanka.
Washington, DC: The World Bank; 2003.
12. Goldenberg RL, Hoffman HJ, Cliver SP, Cutter GR, Nelson KG, Copper RL. The
influence of previous low birth weight on birth weight, gestational age, and
anthropometric measurements in the current pregnancy. Obstet Gynecol.
1992;79:276–80.
13. Rode L, Hegaard HK, Kjærgaard H, Møller LF, Tabor A, Ottesen B. Association
between maternal weight gain and birth weight. Obstet Gynecol. 2007;109:
1309–15.
Laopaiboon et al. BMC Pediatrics
(2019) 19:166
14. Njim T, Atashili J, Mbu R, Choukem SP. Low birth weight in a sub-urban
area of Cameroon: an analysis of the clinical cut-off, incidence, predictors
and complications. BMC Pregnancy Childbirth. 2015;15:1–8.
15. Agbor VN, Ditah C, Tochie JN, Njim T. Low birthweight in rural Cameroon:
Q5 515 an analysis of a cut-off value. BMC Pregnancy Childbirth. 2018;18.
/>16. Joseph KS, Fahey J, Platt RW, Liston RM, Lee SK, Sauve R, et al. An outcomebased approach for the creation of fetal growth standards: do singletons
and twins need separate standards? Am J Epidemiol. 2009;169:616–24.
17. Ye J, Torloni MR, Ota E, Jayaratne K, Pileggi-Castro C, Ortiz-Panozo E, et al.
Searching for the definition of macrosomia through an outcome-based
approach in low- and middle-income countries: a secondary analysis of the
WHO global survey in Africa, Asia and Latin America. BMC Pregnancy
Childbirth. 2015;15:324.
18. Lumbiganon P, Laopaiboon M, Gülmezoglu AM, Souza JP, Taneepanichskul
S, Ruyan P, et al. Method of delivery and pregnancy outcomes in Asia: the
WHO global survey on maternal and perinatal health 2007-08. Lancet. 2010;
375:490–9.
19. Shah A, Faundes A, Machoki M, Bataglia V, Amokrane F, Donner A, et al.
Methodological considerations in implementing the WHO global survey for
monitoring maternal and perinatal health. Bull World Health Organ. 2008;86:
126–31.
20. Souza JP, Cecatti JG, Faundes A, Morais SS, Villar J, Carroli G, et al. Maternal
near miss and maternal death in the World Health Organization’s 2005
global survey on maternal and perinatal health. Bull World Health Organ.
2010;88:113–9.
21. Maas CJM, Hox JJ. Sufficient sample sizes for multilevel modeling.
Methodology. 2005;1:86–92.
22. Wilcox A, Skjaerven R, Buekens P, Kiely J. Birth weight and perinatal
mortality. A comparison of the United States and Norway. JAMA. 1995;273:
709–11.
23. Graafmans WC, Richardus JH, Borsboom GJJM, Bakketeig L, Langhoff-Roos J,
Bergsjø P, et al. Birth weight and perinatal mortality: a comparison of
“optimal” birth weight in seven Western European countries. Epidemiology.
2002;13:569–74.
24. Vangen S, Stoltenberg C, Skjaerven R, Magnus P, Harris JR, Stray-Pedersen B.
The heavier the better? Birthweight and perinatal mortality in different
ethnic groups. Int J Epidemiol. 2002;31:654–60.
25. Habib NA, Dalveit AK, Mlay J, Oneko O, Shao J, Bergsjø P, et al. Birthweight
and perinatal mortality among singletons and twins in North-Eastern
Tanzania. Scand J Public Health. 2008;36:761–8.
26. Barrett JFR, Willan AR, Joseph KS. Planned cesarean or vaginal delivery for
twin pregnancy. N Engl J Med. 2014;370:280.
27. Boulet SL, Alexander GR, Salihu HM, Kirby RS, Carlo WA. Fetal growth risk
curves: defining levels of fetal growth restriction by neonatal death risk. Am
J Obstet Gynecol. 2006;195:1571–7.
28. Mccluskey A, Lalkhen AG. Statistics IV: interpreting the results of statistical
tests. Contin Educ Anaesthesia, Crit Care Pain. 2007;7:208–12.
29. Bates D, Maechler M, Bolker B, Walker SW. Fitting linear mixed-effects
models using lme4. J Stat Softw. 2015;67:1–48.
30. Brimblecombe FS, Ashford JR. Significance of low birth weight in perinatal
mortality. A study of variations within England and Wales. Br J Prev Soc
Med. 1968;22:27–35.
31. Rooth G. Low birthweight revised. Lancet (London, England). 1980;1:639–41.
32. Wilcox AJ, Russell IT. Perinatal mortality: standardizing for birthweight is
biased. Am J Epidemiol. 1983;118:857–64.
33. Wilcox AJ, Russell IT. Birthweight and perinatal mortality: III. Towards a new
method of analysis. Int J Epidemiol. 1986;15:188–96.
34. Wilcox AJ, Russell IT. Birthweight and perinatal mortality: I. on the frequency
distribution of birthweight. Int J Epidemiol. 1983;12:314–8.
Publisher’s Note
Springer Nature remains neutral with regard to jurisdictional claims in
published maps and institutional affiliations.
Page 9 of 9