Housing prices and corporate innovation in China
Bạn đang xem bản rút gọn của tài liệu. Xem và tải ngay bản đầy đủ của tài liệu tại đây (659.96 KB, 22 trang )
Journal of Applied Finance & Banking, vol. 9, no. 3, 2019, 13-34
ISSN: 1792-6580 (print version), 1792-6599 (online)
Scienpress Ltd, 2019
Housing Prices and Corporate Innovation in China
Wenqing Zhao1, Bing Lu1 and Jianyu Zhang2
Abstract
Based on the data of 35 major cities in China, this paper examines the impact of
the rising housing prices on the innovation activities of Chinese A-share listed
companies. We find that the increase in housing prices significantly inhibit the
number of patent applications and the proportion of R&D expenditure of listed
corporations. In addition, we further consider the ownership structure, and find
that the impact of housing price on corporate innovation is more pronounced in
state-owned enterprises. This paper reveals the negative impact of a booming real
estate market on the real economy from the perspective of innovation in China.
JEL classification numbers:E44 G31 O32
Keywords: real estate markets, innovation, hosing price
1 Introduction
The impact of rising housing prices on the company and the economy has been a
topic of concern to policy makers and scholars. Especially in China, the
relationship between real estate and China's overall macro economy is extremely
close. The investment in real estate industry accounts for more than 25% of
China's fixed asset investment. In addition, real estate accounts for 74.7% of the
total wealth of the people in China, which means that up to 3/4 of the wealth of
residents is directly linked to real estate, while real estate accounts for only 27.9%
of its residents’ wealth in the United States. China’s housing prices have remained
1
2
PBC school of finance, Tsinghua University.
School of Environment & Natural Resources, Renmin University of China
Article Info: Received: November 10, 2018. Revised: November 29, 2018
Published online: May 1, 2019
14
Wenqing Zhao et al.
almost unilaterally rising, especially in first-tier cities, where housing price
bubbles have been really dangerous.
Although the prosperity of real estate industry can promote economic
development in the short-term, the real estate bubble may prompt the transfer of
the corporate investment focus, transferring more resources to the higher-profit
real estate industry and ignoring the long-term R&D expenditures on the major
business, which will have a negative impact on overall economic growth in the
long run (Shi et al, 2016). Samuelson (1958) proposed a market-based hypothesis
under the framework of exogenous growth theory. He thought that there would be
problems of excessive capital accumulation in equilibrium, and asset bubbles can
improve economic operation efficiency by extruding investment. However, in the
framework of the endogenous economic theory, Grossman and Yanagawa (1993)
proposed that the speculative behavior induced by asset bubbles squeezed out
investment and lowered the speed of capital accumulation and finally restrained
economic growth. Miao and Wang (2012) established a two-sector endogenous
economic growth model and found that when the company's mortgage assets
generate asset bubbles, the company has the incentive to mortgage more assets to
get more loans to invest, which can finally drive the overall economic growth. But
if the company is attracted by a sectoral bubble and invests limited capital in
industries that have no externalities (such as real estate), the flow of capital to the
sector will have a negative impact on the economy. Exploring the relationship
between housing price volatility and economic growth has become a hot issue in
the present academic research.
In empirical research, Gan (2007) firstly used firm-level data to examine the
impact of housing price changes on corporate lending and investment. The study
found that when the Japanese land market bubble burst in the early 1990s, as
companies obtained large amounts of loans mostly through mortgaging real estate,
the decline in housing prices caused the company's bank lending and investment
to drop significantly. At the same time, a large number of recent literature pointed
out that the high return rate of the real estate industry has attracted a large number
of companies to invest in real estate projects. Since the R&D investment as an
innovation activity has a significant positive correlation with the company's
market value (Richard Blundell, Rachel Griffith, John Van Reenen, 1999), the
company's neglect of technological innovation and reduction of innovation
investment are harmful to the company's long-term development. In China, Wang
and Rong (2014) empirically analyzed the inhibitory impact of rising house prices
on new product development and R&D investment. The study pointed out that the
faster the housing price rises, the lower the company's tendency to develop new
products. Deng (2014) studied the impact of industrial companies’ investing in
Housing Prices and Corporate Innovation in China
15
real estate on their innovative capabilities, and proved that the rise in real estate
prices has a negative impact both in the long run and in the short term, refuting the
opinion that the rise in housing prices has a “compensatory effect” on industrial
companies in the long run.3
Combined with the above-mentioned literature, this paper studies the impact of
rising house prices on the innovation activities of A-share listed companies based
on the data of A-share listed companies in 35 large and medium-sized cities. The
main conclusions are as follows: (1) An increase in housing price will lead to less
innovation input and output; (2) The innovation activities of state-owned
enterprises are more affected by the rising of housing prices. We use different
innovation and housing price indicators, try different measurement models and
subsample regressions to conduct robustness checks.
This paper has the following contributions. Firstly, the existing literature on the
negative impact of rising house prices is mainly concentrated on the innovation of
industrial companies, and there are few references to the impact of innovation
activities in other industries. This paper further explores the impact of rising house
prices on the innovation activities of all Chinese A-share listed companies.
Secondly, the existing literature still has no unified view on the impact of housing
price on state-owned enterprises and non-state-owned enterprise innovation
activities. This paper uses micro-company data from various regions to circumvent
the aggregate bias and the endogenous problem due to macro data, and further
explores the influence of housing price fluctuations on the innovation activities of
state-owned enterprise. Thirdly, in terms of innovation, this paper uses the number
of patent applications of the company while most existing researches choose R&D
expenditures as a proxy variable for innovation. However, as Gao et al. (2004)
proposed, R&D expenditure is only an input variable of innovation, and it cannot
accurately capture the true innovation ability of the company. In addition, by
adopting patent indicators, we can more accurately characterize the company's
ability to innovate.
The structure of the rest of the paper is as follows: the second part is literature
review and theoretical mechanism, the third part is data description and model
specification, the fourth part is the estimation of the effect of housing price
fluctuation on the company's innovation, and the fifth part is conclusions and
suggestions.
3
That means when the profit of the main business is relatively low, the company will invest part of
the funds to the profitable real estate industry, and then use the real estate industry operating
income to support its R&D and other innovation activities.
16
Wenqing Zhao et al.
2 Literature Review and Theoretical Mechanism
2.1 Literature review
The bubble in the real estate market has attracted the attention of many scholars
and policy makers because of its enormous impact on social and economic
development. In 2013, real estate investment accounted for 15% of China's total
GDP; by comparison, this figure was only about 4% in 1998 (Nie and Cao, 2014).
Given that China has become the world's second largest economy, China's real
estate investment may even have a global impact. Real estate can “squeeze out”
investment or “crowd in” investment, thus both mitigating distortions in the
economy and possibly exacerbating distortions in the economy (Wang et al.,
2016).
This paper mainly combines three types of research directions. The first category
of literature focuses on the possibility of housing price increases serving to the
company's innovation activities. Since Schumpeter (1942) proposed the
innovation theory, more and more economists have emphasized the role of
innovation in promoting economic growth (Romer, 1990; Grossman and Helpman,
1994). The corporate innovation activities face many financial constraints.
According to the theory of Hall (2002)'s innovation activities with high financing
costs, the output of innovation activities is highly uncertain and the innovation
process has high regulatory costs, making it difficult for external investors to
evaluate the company. The strengths and weaknesses of innovative projects
require a high risk premium, which in turn increases the cost of innovative
external financing. The rapid development of the real estate industry may have a
positive impact on innovation. The booming real estate market will lead to
continued appreciation of the company's real estate, and improve the mortgage
value and loan capacity of the company's real estate, thus reducing the company's
financing constraints, “crowding into” investments in research and development,
companies can further leverage loans to increase investment in R&D innovation
(Kiyotaki and Moore, 1997). According to a study by Chaney et al. (2012), for
every $1 increase in real estate mortgage value between 2003 and 2010, US
non-real estate company fixed asset investment increased by 2.7 cents, which
shows that the real estate bubble relaxes the company's finance constraints,
alleviates the financial impact of the company and ensures the continuity of the
company's innovative investment.
The second category of literature focuses on the “crowding out effect” of rising
housing prices on corporate innovation activities. “Extrusion effect” means that
when corporate managers pursue short-term benefits, the high return on
investment in the real estate industry may attract managers to move investment
Housing Prices and Corporate Innovation in China
17
from company R&D and innovation to the real estate industry (Narayanan, 1985;
Stein, 1989; Kaplan & Porter, 1992; Aghion et al, 2013). Under the influence of
the “crowding out effect”, the real estate bubble will attract a large number of
companies to invest a large amount of money in the already over-prosperous real
estate market, thereby reducing innovation investment, resulting in inefficient
resource allocation and drop down of long-term economic growth rate. Wu (2012)
finds that the rise of real estate prices has led to the “hollowing” of these private
industries. Wang and Rong (2014) use the data system of industrial enterprises
above designated size in 35 large and medium-sized cities in China from 1999 to
2007 to study the inhibitory effect of housing price increase on industrial company
innovation, and empirically analyzed the impact of increases in housing prices and
industrial enterprises' new product output and R&D investment. The study finds
that the faster the rate of housing price increase, the weaker the tendency of
industrial companies to develop new products, and such inhibitions are weaker in
smaller companies and foreign companies.
The third type of literature focuses on the factors that influence the company's
innovation (the level of R&D expenditure, the size of the company, the
shareholding structure etc.). Griliches (1998) finds that the company's R&D
expenditure significantly promoted the company's productivity and improved the
company's innovation ability based on the data of 1000 manufacturing companies
in the United States from 1957 to 1976. David and Zoltan (1988) argue that the
size of a company is positively correlated with industry innovations, and that
larger companies have an advantage in corporate innovation. Audretsch. D. B and
Acs.Z. J (1989) find that companies of different sizes have different innovation
advantages in different industries, and the strength of the company's innovation.
There is no obvious linear relationship with the size of the company. An empirical
study by Zahra et al. (2000) on the innovation activities of medium-sized
companies find that the shareholding ratio of company managers is significantly
positively correlated with the company's technological innovation activities. In
China, Xu and Zhang (2008) find that state-owned equity-oriented companies tend
to innovate internally and will not actively seek cooperation from others; Feng and
Wen (2008) find that the proportion of state-owned shares 4 has a negative
correlation with the company's technological innovation.
This paper combines the above three directions to explore the inhibitory effect of
rising house prices on the innovation activities of Chinese A-share listed
companies, and further studies the difference in the inhibitory effect of house price
4
State-owned shares include state-owned shares and state-owned legal person shares
18
Wenqing Zhao et al.
increases on companies of different sizes and different ownership structures.
2.2 Theoretical mechanism
Real estate is a capital-intensive industry, and real estate development requires a
large amount of investment and a long investment cycle. Without strong financial
resources, it is difficult for companies to enter the real estate market. As a
developing country, for one thing, China’s financial market is still incomplete,
what’s worse, the poor institutional environment magnifies the shortage of
financial market, resulting in a lack of assets that can be used as collateral and
hedging, and the real estate market thus acts as collateral assets. When the
financial industry is relatively backward, many non-real estate companies have
significant financing advantages in entering the real estate industry. They not only
establish good credit relationships with banks through their daily business
activities, but also have more fixed assets (especially factories and land) as loan
collateral. In addition, many non-real estate companies have extensive
management experience and have established close relationships with local
governments because they can provide local governments with tax revenues and
job creating opportunities. 37% of the 35 large and medium-sized cities in 2013
launched real estate business. In order to pursue high-return real estate industry,
the companies are actively preparing for participation in real estate funds. Due to
financing constraints, it is bound to reduce the original investment projects to meet
the large-scale capital demand of real estate investment. R&D projects are more
dependent on internal financing, have a large demand for capital and a long
payback period, so they can be easily affected by the reduction of existing
investment projects. It is foreseeable that rising house prices will have a major
negative impact on innovative investments in major industries.
We expect that the negative impact on state-owned enterprises’ innovation is
greater than that of non-SOEs. The reasons are as follows. Firstly, 65% of
enterprises are state-owned enterprises in China's stock market. In terms of
quantity, state-owned enterprises are more affected by external stimuli. Second,
state-owned enterprise managers do not value innovation as much as these of
non-state owned copanies, and they lack innovative incentives or capacity
(Megginson and Netter, 2001). Finally, compared with non-state-owned
enterprises, state-owned enterprises have relatively close relationships with local
governments and state-owned banks, and it is relatively easier for them to enter
the real estate market.
19
Housing Prices and Corporate Innovation in China
3 Data Source and Model Settings
The company data used in this paper is from the CSMAR database. Since the
listed company began to disclose the relevant information about real estate
investments in the notes of the financial statements since 2003, we choose
2003-2015 as our sample period. Companies are located in 35 large and medium
cities. This article excludes companies in the “financial”, “insurance”, “real estate”
and “construction” industries, as companies investing in these industries are not
solely for the purpose of using real estate as mortgage. In addition, we excludes
companies in “agriculture”, “mining”, “traffic industry”, “warehouse” and
“hydropower and gas” industries, because companies in these industries have large
amounts of land and real estate outside the urban area. If urban housing prices are
used, estimates tend to be biased in calculating their mortgage value
.
3.1 Housing price data
The price data of 35 major cities used in this paper from 2003 to 2015 comes from
the website of the National Bureau of Statistics. The average sales price data of
commercial housing is standardized by setting the price of each district in 2002 to
1.
𝐺𝑒𝑛𝑒𝑟𝑎𝑙 𝐻𝑜𝑢𝑠𝑖𝑛𝑔 𝑃𝑟𝑖𝑐𝑒
𝐻𝑃𝐼 = 𝐺𝑒𝑛𝑒𝑟𝑎𝑙 𝐻𝑜𝑢𝑠𝑖𝑛𝑔 𝑝𝑟𝑖𝑐𝑒 (2002) ∗ 100
(1)
𝑅𝑒𝑠𝑖𝑑𝑒𝑛𝑡𝑖𝑎𝑙 𝐻𝑜𝑢𝑠𝑒 𝑃𝑟𝑖𝑐𝑒
𝑅𝑃𝐼 = 𝑅𝑒𝑠𝑖𝑑𝑒𝑛𝑡𝑖𝑎𝑙 𝐻𝑜𝑢𝑠𝑒 𝑝𝑟𝑖𝑐𝑒 (2002) ∗ 100
(2)
¥/m²
12000
10000
8000
6000
4000
2000
0
2003
2004
2005
2006
2007
2008
HPI
2009
2010
2011
2012
RPI
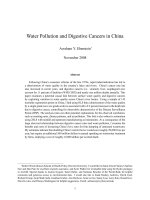
Figure 1: Commercial housing sales price
2013
2014
2015
20
Wenqing Zhao et al.
Note: Figure 1 shows the trend of housing prices in 35 large and medium-sized
cities from 2003 to 2015. According to the picture, it can be seen that the average
sales price of the 35 cities showed a rapid growth trend in the past ten years. In
2002, the average housing price in the 35 large and medium-sized cities was 3041
yuan / square meter, while the average house price in the 35 large and
medium-sized cities in 2015 rose to 9752 yuan / square meter, with an annual
growth rate of 10%, far higher than 2.85% inflation growth rate.5
3.2 Patent data description
The explanatory variables in this paper are the company's innovations, but it is
difficult to find a comprehensive indicator to measure the company's innovation
activities. In the past, the research often used the amount of new products or R&D
expenditures to measure the company's innovation activities, but both of these
indicators have certain limitations. Firstly, R&D spending can only measure the
company's innovation investment, while companies with more investment are not
necessarily innovative; in addition, the company does not necessarily produce new
products through R&D activities, and the innovative features of new products are
difficult to measure with uniform standards. What’s more, the company's patent
stock does not accurately reflect the company's current R&D innovation
investment status because the company's patents are affected by factors such as
policies and systems of patents authorization. Referring to Shi et al. (2016), we
used the company's patent applications for the current year to measure the
company's innovation output that year. The patent is the result of independent
innovation. The number of patents applied by the company directly reflects the
company's ability to innovate.
The patent data in this paper is from the patent and R&D innovation database of
CSMAR. We can get the number of patent applications of a company in a given
year. The State Intellectual Property Office granted three kinds of patents:
invention patents, utility model patents and design patents. The definition of an
invention patent is “a new technical solution proposed for a product, a method or a
modification thereof”, and a utility model patent is defined as “a new technology
suitable for practical use of the shape, structure or combination of the product. The
definition of a design patent is "a new design that is aesthetically pleasing to the
shape, pattern or combination of the product and the combination of color and
shape and pattern, and is suitable for industrial applications." It takes more than
two years before a patent is granted, and the use of patent grants will result in
5
The inflation growth rate is calculated from the Urban Residents Consumer Price Index of the
National Bureau of Statistics website.
21
Housing Prices and Corporate Innovation in China
truncation bias. Therefore, the logarithm of the number of patent applications is
used as an indicator to measure the company's research and development results.
The technical quantities of the three patents are different, and the technical content
of the invention patents is the highest (Zhuo, 2012). Therefore, we use the total
number of patent applications and invention patent applications as our dependent
variables.
3.3 Control variables
We control a range of variables at the company level that may affect innovation.
Book to market ratio refers to the total value of assets compared to the listed value.
Leverage refers to the ratio of total debt to total assets. In order to control the size
of the company, we controlled the logarithm of the company's sales. In addition,
because financing factors are of great significance to the company's innovation,
we also control the company's cash assets ratio in the return, which is defined as
the company's cash compared to the total assets of the year. In addition, in order to
control some unobservable factors at the city level and the company level that do
not change with time, we control the city fixed effect and the company fixed effect.
Finally, we also control the annual fixed effects to absorb the effects of some
macro factors.
3.4 Descriptive statistics
Table 1 gives descriptive statistics for the key variables in this paper. In order to
reduce the impact of outliers, all continuous variables are winsorized at the 1%
level. In Table 1, we report the logarithm of the company's patent applications and
the logarithm of the number of invention patent applications. It can be seen that
the distribution of all patents is extremely right-biased. The table also reports
general housing price (HPI) and residential housing price (RPI). The general
housing price index is standardized according to the local housing price in 2002.
In terms of HPI, the fastest-rising city is Shenzhen, and the slowest region is
Yinchuan. The table also reports the company's micro-level control variables,
including leverage, book-to-market ratio, sales and cash to asset ratio.
Variable
Number of patent
applications
Table 1: Descriptive statistics
Std.
Number of
Median Deviati
Observations
on
9,375
1.30
1.56
Min
Max
0.00
5.92
22
Number of invention
patent applications
General housing price
Residential housing
price
Leverage
Book to market ratio
Sales
Cash to asset ratio
Wenqing Zhao et al.
9,375
0.88
1.28
0.00
5.07
9,375
2.96
3.10
1.15
1.28
0.85
0.91
5.85
7.29
0.44
0.82
21.06
0.23
0.21
0.71
1.45
0.17
0.05
0.08
17.94
0.01
1.00
3.77
25.10
0.78
9,375
9,375
9,375
9,375
9,375
Note: The number of patent applications, the number of invention applications, and sales are all in
logarithmic form. The general housing price is standardized according to the 2002 data of each
city.
3.5 Empirical model
The basic empirical analysis model is as follows:
𝑌𝑖𝑡𝐶 = 𝛽 ⋅ 𝐻𝑃𝐼𝑡𝐶 + 𝛾 ⋅ 𝑋𝑖𝑡 + 𝛼𝑖 + 𝜆𝑡 + 𝜀𝑖𝑡
(3)
Among them, i, c, t represent company, city and year respectively. Y represents the
explanatory variable, which is Ln (Patents+1); HPI represents the standardized
housing price, which is the explanatory variable. Following the empirical literature
of corporate innovation, we control some company-level variables, including the
logarithm of sales, book-to-market ratio, cash-to-asset ratio, and leverage. The
logarithm of sales is used to control the size of the company, the cash to asset ratio
controls the company's investment capacity, and leverage controls the company's
financing ability. Taking into account the unobserved heterogeneity at the
company level, we control the company fixed effect; in order to explain the
possible impact of domestic macroeconomic changes on investment, we also
control the year fixed effect, expressed by λ; at the same time, this paper controls
city fixed effect, using α to represent the various factors that influence the
innovation at the city level and do not change with time, including urban
incentives for innovation and urban residents' awareness of innovation. ε
represents the residual and is a random error term.
Since all companies in the same city face the same rate of housing price increase
in the same year, the “city-year” data in this paper is not relatively independent.
We group the samples by “city-year” and relax the assumption that the samples are
independent of each other, instead we only assumes that different groups are
independent from each other and accordingly cluster the residuals. Such clustering
process can result in a more robust estimation variance.
Housing Prices and Corporate Innovation in China
4
23
Regression Results
4.1 Baseline regression result
We firstly use the full sample to run the regression, and the results are shown in
Table 1. The coefficient of the housing price index is significantly negative,
indicating that the increase in the sales price of commercial housing has a
significant negative impact on the number of patent applications, that is, the
housing price increase has an extrusion effect on the company's innovation results,
and the results are in line with the theoretical mechanism of this paper and
previous research (Wang and Rong, 2014; Shi et al, 2016). The coefficient of
housing price index is negative and significant at 1% significance level, which
means that if the house price rises by 50%, the company's patent applications are
reduced by an average of 4.48%. Columns (3) and (4) are the results of the
regression of the number of invention applications, which further supports the
view that the inventions in the predecessor patents are more effective. The
company's financial indicators may have a high correlation with the number of
patent applications.
Table 2: The inhibitory effect of rising house prices on company innovation
(1)
(2)
(3)
(4)
Number of
Number of
Number of
Number of
Dependent
patent
patent
invention patent invention patent
variable
applications
applications
applications
applications
HPI
-0.0690***
-0.0896***
-0.0680***
-0.0767***
(-2.68)
(-3.39)
(-3.00)
(-3.29)
Leverage
0.3295***
0.2701***
(3.56)
(3.31)
M/B ratio
0.0268
0.0001
(1.16)
(0.01)
Sales
0.1245***
0.1085***
(6.84)
(6.76)
Cash
-0.3966***
-0.2977***
(-4.60)
(-3.91)
Constant
0.9395***
-1.5995***
0.5224***
-1.6884***
(19.62)
(-4.37)
(12.43)
(-5.23)
Firm fixed effect
Yes
Yes
Yes
Yes
Year fixed effect
Yes
Yes
Yes
Yes
24
Number of
observations
R²
Wenqing Zhao et al.
9,375
0.0809
9,375
0.0969
9,375
0.0938
9,375
0.107
Note: The value of t is in parentheses. The error is a robust value. *** (**) (*) Significance at the 1%
(5%)(10%) two-tailed level. The number of patent applications, the number of invention
applications, and the income from the main business are all in logarithmic form. The average
housing price index is standardized according to the 2002 data of each city.
4.2 Company ownership
In order to verify that the innovation activities of state-owned enterprises are more
affected by the rise of housing prices, we divide all enterprises in the sample into
groups of SOE and non-SOEs according to the ownership structure, and expect
that the coefficient of housing prices in the state-owned enterprise sample is more
significantly negative than that in the non-SOE sample. From the results in Table 3,
it can be seen that the coefficient of HPI in state-owned enterprise sample is
significantly negative at 1% significance level, but the coefficient in non-SOE
sample is not significant. It shows that compared with non-state-owned enterprises,
the innovation activities of state-owned enterprises are more affected by the rise in
housing prices. When housing prices rise, due to the close relationship between
state-owned enterprises and local governments and banks, it is easier for SOEs to
enter the real estate industry to obtain high profits, which is at cost of the
innovative research and development of the main business.
Table 3: Comparison of the inhibitory effects of rising house prices on
state-owned enterprises and non-state-owned enterprises
(1)
(2)
(3)
(4)
Number of
Number of
Number of
Number of
Dependent
patent
patent
invention patent invention patent
variable
applications
applications
applications
applications
State-owned
Non-state
State-owned
Non-state
enterprises
enterprises
enterprises
enterprises
HPI
-0.1488***
-0.0476
-0.1211***
-0.0492
(-3.76)
(-1.29)
(-3.42)
(-1.53)
Leverage
0.3174**
0.2912**
0.1850
0.3274***
(2.46)
(2.08)
(1.60)
(2.69)
M/B ratio
0.0313
-0.0121
-0.0096
0.0069
(1.16)
(-0.26)
(-0.40)
(0.17)
25
Housing Prices and Corporate Innovation in China
Sales
Cash
Constant
Company fixed effect
Year fixed effect
Urban fixed effect
Number of observations
R²
0.0806***
(3.32)
-0.5772***
(-4.07)
-0.8586*
(-1.72)
Yes
Yes
Yes
4,739
0.122
0.1723***
(5.74)
-0.2646**
(-2.25)
-2.2391***
(-3.78)
Yes
Yes
Yes
4,614
0.0708
0.0909***
(4.19)
-0.3199**
(-2.52)
-1.3992***
(-3.14)
Yes
Yes
Yes
4,739
0.133
0.1235***
(4.73)
-0.2521**
(-2.46)
-1.8702***
(-3.62)
Yes
Yes
Yes
4,614
0.0820
Note: The value of t is in parentheses. The error is a robust value. *** (**) (*) Significance at the 1%
(5%)(10%) two-tailed level. The number of patent applications, the number of invention
applications, and the income from the main business are all in logarithmic form. The average
housing price index is standardized according to the 2002 data of each city.
4.3 Robustness checks
4.3.1 Different housing price indicators
In the previous regression, we use the general housing price index (HPI) to
measure the price level. In order to test the robustness of the conclusion, we use
another indicator of real estate price - the residential housing price index (RPI) to
run the regression again. The results are shown in Table 4. The results are similar
to the above. Specifically, if housing prices rise by 50%, the number of corporate
patent applications will fall by an average of 3.7%. The rise in housing prices has
curbed the innovation output of enterprises, and this inhibitory effect is more
obvious after adding control variables.
Dependent variable
RPI
Leverage
Table 4: Residential housing price index
(1)
(2)
(3)
Number of
Number of
Number of
invention
patent
patent
patent
applications
applications
applications
-0.0553**
-0.0741***
-0.0584***
(-2.46)
(-3.21)
(-2.96)
0.3316***
(3.59)
(4)
Number of
invention
patent
applications
-0.0657***
(-3.23)
0.2717***
(3.33)
26
Wenqing Zhao et al.
M/B ratio
0.9241***
(20.22)
0.0276
(1.19)
0.1241***
(6.82)
-0.3947***
(-4.58)
-1.6097***
(-4.40)
0.5118***
(12.76)
0.0008
(0.04)
0.1081***
(6.74)
-0.2965***
(-3.90)
-1.6954***
(-5.25)
Yes
Yes
Yes
Yes
Yes
Yes
Yes
Yes
Yes
Yes
Yes
Yes
9,375
0.0808
9,375
0.0968
9,375
0.0937
9,375
0.107
Sales
Cash
Constant
Company fixed
effect
Year fixed effect
Urban fixed effect
Number of
observations
R²
Note: The value of t is in parentheses. The error is a robust value. *** (**) (*) Significance at the 1%
(5%)(10%) two-tailed level. The number of patent applications, the number of invention
applications, and the income from the main business are all in logarithmic form. The average
housing price index is standardized according to the 2002 data of each city.
4.3.2 Different innovation measures
In the main regression, we use the number of patent applications and the number
of invention patent applications to measure the level of innovation. In order to test
the robustness of the conclusions, here we use the R&D expenditures to measure
the corporate innovation and the results are shown in Table 5. We can see from
table 5 that our results remain robust, and when housing prices rise, the companies’
R&D investment will decrease.
Dependent variable
HPI
RPI
Leverage
Table 5: R&D expenditure
(1)
(2)
(3)
R&D
R&D
R&D
expenditure
expenditure
expenditure
-0.5128***
-0.4330***
(-3.18)
(-2.61)
-0.4635***
(-3.21)
-1.4032*
(4)
R&D
expenditure
-0.3679**
(-2.46)
-1.4049*
27
Housing Prices and Corporate Innovation in China
4.0063***
(8.06)
(-1.73)
0.1543
(0.71)
-2.4247***
(-13.38)
-1.3683**
(-2.35)
54.1845***
(14.81)
3.9544***
(8.16)
(-1.73)
0.1584
(0.73)
-2.4237***
(-13.37)
-1.3652**
(-2.34)
54.0671***
(14.78)
No
No
No
Yes
Yes
Yes
No
No
No
Yes
Yes
Yes
4,800
0.0522
4,553
0.106
4,800
0.0523
4,553
0.106
M/B ratio
Sales
Cash
Constant
Company fixed
effect
Year fixed effect
Urban fixed effect
Number of
observations
R²
Note: The value of t is in parentheses. The error is a robust value. *** (**) (*) Significance at the 1%
(5%)(10%) two-tailed level. The number of patent applications, the number of invention
applications, and the income from the main business are all in logarithmic form. The average
housing price index is standardized according to the 2002 data of each city.
4.3.3 Replacing the estimation model
In this paper, the least squares (OLS) regression model is used in the previous
regression. The explanatory variable in this paper is the patent number, which is a
non-negative discrete random variable, and has a large number of observations at
zero (many companies have not obtained patents in a certain year), showing
typical biased distribution characteristics. Therefore, we then use the Poisson
model to run the regression again. After changing to the Poisson regression model,
the regression coefficient was significantly improved, proving that the price
increase significantly inhibited the company's innovation activities. Besides, we
also use negative binomial regression model to do the robust check too, and the
regression results are shown in Table 6. The results are still robust.
Table 6: Poisson and negative binomial regression model
(1)
(2)
(3)
(4)
Model
Poisson Regression
Negative Binomial Regression
Dependent variable
Number of
Number of
Number of
Number of
28
Wenqing Zhao et al.
HPI
Leverage
M/B ratio
Sales
Cash
patent
applications
-0.4499***
(-59.37)
-1.1076***
(-33.08)
-0.1059***
(-20.64)
0.7773***
(104.48)
0.3276***
(10.79)
invention
applications
-0.7565***
(-67.25)
-1.5590***
(-30.18)
-0.2664***
(-35.98)
0.8742***
(79.54)
-0.0248
(-0.53)
Yes
Yes
Yes
patent
applications
-0.1554***
(-3.93)
-0.1846
(-1.35)
-0.0709**
(-2.06)
0.1010***
(5.08)
0.0084
(1.34)
-2.2040***
(-5.14)
Yes
Yes
Yes
invention
applications
-0.0664**
(-2.05)
-0.0911
(-0.80)
-0.0055
(-0.19)
0.0916***
(5.49)
0.1105
(1.10)
-1.5907***
(-4.48)
Yes
Yes
Yes
Yes
Yes
Yes
4,698
4,652
4,784
4,784
Constant
Company fixed effect
Year fixed effect
Urban fixed effect
Number of
observations
Note: The value of t is in parentheses. The error is a robust value. *** (**) (*) Significance at the 1%
(5%)(10%) two-tailed level. The number of patent applications, the number of invention
applications, and the income from the main business are all in logarithmic form. The average
housing price index is standardized according to the 2002 data of each city.
4.4 Endogeneity problem
All the previous regressions are based on the fact that the company's innovation
activities cannot affect local housing prices. In theory, there is the possibility that
large-scale companies will put more efforts to innovation activities so as to
increase the scale of the company through efficiency improvement. Such
companies will provide a large number of jobs, attract a large number of people,
which will affect the housing prices of the local city.
4.4.1 Focusing on the smaller companies
In order to address the endogeneity problems, we divide the companies into large
companies and small companies according to whether the sales amount is greater
than the median and whether the total assets are greater than the median. And
then we focus on the group with smaller size, which can cause less impact on the
29
Housing Prices and Corporate Innovation in China
local housing price. The regression results are shown in Table 7. The housing price
coefficient of small companies is still significantly negative at the 1% level,
indicating that the endogeneity problem in the regression model is not very
serious.
Dependent variable
Criteria for the
classification
HPI
RPI
Leverage
M/B ratio
Sales
Cash
Constant
Company fixed
effect
Year fixed effect
Urban fixed effect
Number of
Observations
R²
Table 7: Endogenous problem test
(1)
(2)
(3)
(4)
Number of patent applications
Number of patent applications
Sales
Small company
-0.1124***
(-3.03)
-0.0994***
(-3.02)
0.2273*
0.2341*
(1.88)
(1.95)
0.0762
0.0755
(1.61)
(1.61)
0.1259***
0.1234***
(4.14)
(4.12)
-0.3864***
-0.3881***
(-3.63)
(-3.67)
-1.4456**
-1.4194**
(-2.43)
(-2.42)
Assets
Small company
-0.0686*
(-1.81)
-0.0648*
(-1.95)
0.4846***
0.4883***
(4.64)
(4.70)
0.0371
0.0365
(1.19)
(1.18)
0.1532***
0.1522***
(6.98)
(6.99)
-0.4227***
-0.4246***
(-4.32)
(-4.36)
-2.2495***
-2.2371***
(-5.12)
(-5.13)
Yes
Yes
Yes
Yes
Yes
Yes
Yes
Yes
Yes
Yes
Yes
Yes
4,867
0.073
4,868
0.068
4,867
0.070
4,868
0.076
Note: The value of t is in parentheses. The error is a robust value. *** (**) (*) Significance at the 1%
(5%)(10%) two-tailed level. The number of patent applications, the number of invention
applications, and the income from the main business are all in logarithmic form. The average
housing price index is standardized according to the 2002 data of each city.
30
Wenqing Zhao et al.
4.4.2 IV regression
In order to further address the endogeneity problem, we use the product of housing
supply elasticity and long-term interest rate as the instrumental variable of housing
price to perform IV regressions. In theory, housing demand will increase when
long-term interest rates fall. If the supply of land is flexible at this time, the
decline in interest rates will promote the real estate companies to construct more
houses; if the supply of land is not flexible at this time, the increase in housing
demand will lead to a sharp rise in housing prices.
The regression results are shown in Table 8. The first and second columns use
general housing price as the dependent variable, and the third and fourth columns
are results using residential housing price index. The regression results show that
the product coefficient of housing supply elasticity and long-term loan interest rate
is significantly positive, and the second stage regression result shows that our
results from the above main regression are still robust.
Dependent variable
Housing supply elasticity
*long-term loan interest
rate
Table 8: Instrument variable method test
(1)
(2)
(3)
The first stage
second
The first stage
stage
14.0549***
(8.73)
HPI
second stage
14.1545***
(7.66)
-0.0896***
(-3.39)
RPI
Leverage
M/B ratio
Sales
Cash
Constant
(4)
-0.0356
(-0.26)
0.3295***
(3.56)
0.0268
(1.16)
0.1245***
(6.84)
-0.3966***
(-4.60)
-1.5995***
(-4.37)
-0.0349
(-0.22)
-0.0741***
(-3.21)
0.3316***
(3.59)
0.0276
(1.19)
0.1241***
(6.82)
-0.3947***
(-4.58)
-1.6097***
(-4.40)
31
Housing Prices and Corporate Innovation in China
Company fixed effect
Year fixed effect
Urban fixed effect
Number of Observations
R²
No
Yes
Yes
420
0.888
Yes
Yes
No
9,375
0.097
No
Yes
Yes
420
0.875
Yes
Yes
No
9,375
0.097
Note: The value of t is in parentheses. The error is a robust value. *** (**) (*) Significance at the 1%
(5%)(10%) two-tailed level. The number of patent applications, the number of invention
applications, and the income from the main business are all in logarithmic form. The average
housing price index is standardized according to the 2002 data of each city.
4.4.3 Diff-in-Diff analysis
In order to combat housing investment and speculative demand, many
governments have introduced a housing purchase restriction policy to curb the
excessive rise in housing prices. This provides us an opportunity to perform the
Diff-in-Diff analysis. We select the city that implements the purchase restriction
policy as the experimental group, and the city that does not adopt the purchase
restriction policy as the control group, and further compare whether the urban
technological innovation level of the experimental group is higher. In order to
study this problem, we use the urban innovation index as the dependent variable.
It is defined as the number of patent applications in that city per person every year.
The patent data comes from the CNKI patent database. We also control a series of
city-level control variables such as GDP, FDI and industrial structure. FDI is
defined as the industrial sales of FDI firms to the total industrial sales in that city.
Industrial structure is defined as the ratio of the GDP of the second industry to the
total GDP of the city. The city-level data comes from the China Regional
Economic Statistical Yearbook. The regression results are shown in Table 9. The
results show that the coefficient of the interaction term between purchase
restriction city and restriction period is significantly positive, indicating that the
purchase restriction policy has a significantly positive impact on the level of
innovation of the city.
Table 9: The role of purchase restriction policy
(1)
(2)
(3)
Urban
Urban
Urban
innovation
innovation
innovation
Dependent variable
index
index
index
Purchase restriction
2.3245***
2.2630***
2.1925***
(4)
Urban
innovation
index
2.2585***
32
Wenqing Zhao et al.
city*Purse restriction
time
(9.79)
GDP per capita
(9.46)
-0.0476**
(-2.04)
Amount of foreign
investment
(9.13)
-0.0483**
(-2.08)
(9.10)
-0.0501**
(-2.15)
-0.3581***
(-2.77)
-0.3604***
(-2.79)
0.0136
(1.05)
-0.1470
(-0.17)
Yes
Yes
2,286
0.356
Industrial structure
Constant
Year fixed effect
City fixed effect
Number of observations
R²
0.0683
(0.10)
Yes
Yes
2,286
0.352
0.4102
(0.61)
Yes
Yes
2,286
0.353
0.4252
(0.63)
Yes
Yes
2,286
0.356
Note: The value of t is in parentheses. The error is a robust value. *** (**) (*) Significance at the 1%
(5%)(10%) two-tailed level.
5 Conclusion
This paper takes the listed companies in 35 large and medium-sized cities in China
from 2003 to 2015 as the research samples, and empirically tests the relationship
between the rise in housing prices and the company's innovation activities. The
research results show that the increase in housing prices significantly inhibited the
number of patent applications and R&D expenditures of listed companies, and
verify the significant crowding out effect of the house price increase on the
company's innovation activities. This shows that the rise in housing prices has
attracted non-real estate companies to invest large amounts of money in the real
estate industry, pursuing short-term profit growth, neglecting innovation activities
that are conducive to the company's long-term development, and inhibiting the
corporate innovation.
This paper further considers the influence of ownership structure, and finds that
the inhibitory effect of housing price increase on the company's innovation mainly
appears in state-owned enterprises in that SOEs tend to have close relationship
with local governments and banks so that they can enter the real estate industry
more easily.
From the results, we can see that the company's management short-sightedness
leads non-real estate companies to pursue short-term interests through reducing
Housing Prices and Corporate Innovation in China
33
innovation investment, which hinders the long-term development of the main
business. The high return in the real estate industry is unlikely to continue to rise.
Once a housing bubble burst like Japan is broken, the company will not only
suffer from these real estate investments but also lose its competitive advantage in
the long run. The company should look at the company's development from a
long-term perspective, actively invest in innovation activities, and focus on
technology research and development.
Therefore, for the healthy development of the non-real estate industry, this paper
suggests that the government actively control the speculators in the market
through policy control and curb the irrational prosperity of the real estate industry.
At the same time, due to the large gap in economic development in various regions
of China, it is recommended that the government formulate differentiated housing
price control policies based on actual conditions in different regions to accurately
target real estate market speculators in various regions. Finally, the government
should actively guide the company to establish a correct sense of innovation by
creating a good external environment, promoting the innovation and development
of all walks of life, and guiding the companies to return to their main business
from real estate industry.
References
[1] Acs Z., and Audretsch D. B., Patents as a Measure of Innovative Activity.,
Kyklos, 42(2), (1989), 171 - 180.
[2] Aghion P., Van R. J., and Zingales L, Innovation and Institutional Ownership,
American Economic Review, 103(1), (2013), 277 - 304.
[3] Blundell R., Griffith R., and Van R. J., Market Share, Market Value and
Innovation in a Panel of British Manufacturing Firms, Review of Economic
Studies, 66(3), (1999), 529 - 554.
[4] Deng B., The Impact of Industrial Enterprise Real Estate Investment on
Enterprise Innovation——An Empirical Study Based on Data of Chinese
Listed Companies, Research on Economics and Management, 10, (2014), 113
- 120.
[5] Gan J., Collateral, Debt Capacity, and Corporate Investment: Evidence from
a Natural Experiment, Journal of Financial Economics, 85(3), (2007), 709 734.
[6] Gao J., Wang J., and Wei P., Performance Indicators of Enterprise
Technology Innovation: Current Situation, Problems and New Conceptual
Models, Research Management, (2004), 14 - 22.
34
Wenqing Zhao et al.
[7] Chaney, T., Sraer, D., and Thesmar, D., The Collateral Channel: How Real
Estate Shocks Affect Corporate Investment. American Economic
Review, 102(6), 2012, 2381 - 2409.
[8] Griliches, Z., Patent Statistics as Economic Indicators: A Survey, In R&D and
productivity: the econometric evidence (pp. 287-343), University of Chicago
Press, 1998.
[9] Grossman, G. M. and Yanagawa, N., Asset Bubbles and Endogenous Growth,
Journal of Monetary Economics, 31(1), (1993), 3 - 19.
[10] Hall, B. H., Griliches, Z., and Hausman, J. A., Patents and R&D: Is There A
Lag? International Economic Review, (1986), 265 - 283.
[11] Kiyotaki, N., and Moore, J., Credit Cycles, Journal of Political Economy,
105(2), (1997), 211 - 248.
[12] Li Y., Developing the Real Economy to Prevent Industrial Hollowing Out,
Machinery Industry Standardization and Quality, 12, (2013), 4.
[13] Miao, J., and Wang, P., Sectoral Bubbles and Endogenous Growth, Working
Paper, (2012).
[14] Nie, J., and Cao, G., China’s Slowing Housing Market and GDP Growth,
Macro Bulletin. Kansas City: Federal Reserve Bank, (2014).
[15] Niu W., “Industrial Hollowization” is the Essential Cause of House Price
Bubbles, China Economic Weekly, 18, (2014), 15.
[16] Olivier, J., Growth-Enhancing Bubbles, International Economic Review,
41(1), (2000), 133 - 151.
[17] Pakes, A., and Griliches, Z., Patents and R&D at the Firm Level: A First
Report, Economics Letters, 5(4), (1980), 377 - 381.
[18] Samuelson, P. A., An Exact Consumption-loan Model of Interest with or
without the Social Contrivance of Money, Journal of Political Economy,
66(6), (1958), 467 - 482.
[19] Wang W., and Rong Z., Housing boom and firm innovation: Evidence from
Industrial Firms in China, China Economic Quarterly, 1, (2014), 465 - 490.
[20] Wang Y., Gao X., Yuan Z., and Du J., Financial Development, Asset Bubble
and Real Economy: A Literature Review, Financial Research, 5, (2016), 191
- 206.
[21] Xu E., and Zhang W., The Impact of State-owned Equity of Chinese Listed
Companies on Technological Innovation Modes, Economic Management,
30(15), (2008), 42 - 46.
[22] Zahra, S. A., Neubaum, D. O., and Huse, M., Entrepreneurship in
Medium-size Companies: Exploring the Effects of Ownership and
Governance Systems, Journal of Management: Official Journal of the
Southern Management Association, 26(5), (2000), 947 - 976.