International experiences in developing environmental performance index and possible application in Vietnam
Bạn đang xem bản rút gọn của tài liệu. Xem và tải ngay bản đầy đủ của tài liệu tại đây (210.17 KB, 15 trang )
66
International experiences in developing environmental performance index…
INTERNATIONAL EXPERIENCES IN DEVELOPING
ENVIRONMENTAL PERFORMANCE INDEX AND POSSIBLE
APPLICATION IN VIETNAM
Dr. Nguyen Tung Lam1
Institute of Natural Resources and Environment Strategy and Policy
Abstract:
Environmental sustainability has been identified as important content and orientation in
socio-economic and environmental development policies in our country. Reviewing the
implementation of sustainable development goals of these policies, as well as
environmental policies will provide the basis for process of planning, revision and
monitoring of the progress of implementation of policies by central, local agencies
concerned. In the world, the method of assessment of environmental performance based on
reliable collected data has been developed and tested at national level, the approach of
this may be used to elaborate a method of evaluation at local level. This paper introduced
international experiences in developing global Environmental Performance Indicators and
the possibility of develop them in the context of Vietnam.
Keywords: EPI; Environmental Performance Index; Sustainable Development.
Code: 15052102
1. Introduction
Globally, environmental sustainability has increasingly been received due
attention in development policies of the country. Since the Rio Earth
Summit, many countries have made every effort to assess and demonstrate
their progress in the implementation of environmental policy, through
quantitative measures applied in pollution control and natural resources
management. Besides, governments are also facing a growing pressure of
how to prove that their environmental protection efforts were effective.
Sustainable goals can only be achieved if there are development policies
appropriate and the implementation of policies for environmental and
natural resources management effective. However, the policy making
process and the evaluation of such policy enforcement under a national,
regional context or the comparison, in narrower context, between different
regions or provinces in the country requires an effective scientific and
evidence-based approach. To meeting this requirement, scientists have
1
The author’s contact is at
JSTPM Vol 4, No 2, 2015
67
studied and developed a system of comprehensive indicators for assessment
purposes.
In Vietnam, under the pressure of economic development on environment,
the requirement of making appropriate policies, as well as their effective
implementation is becoming increasingly urgent. However, if without basis
to evaluate the effectiveness of already issued environmental policies in a
consistent manner, then it will be very difficult to revise the existing
applicable ones or develop the new policies suitable to reality. On the other
hand, although there have been indexes of environmental quality
assessment, monitoring programs and policy-making in our country still
face with challenges such as incomplete, synchronized, conflicting, low
reliability environmental data. So the approach to follow the methods
developed and being used globally for effective evaluation would be an
appropriate approach for Vietnam. There should be a standard database, a
set of quantitative indicators for analysis and evaluation of environmental
policies to assist the process of policy-making and policy enforcement be
more effective.
The Environmental Performance Index (EPI) of Yale and Columbia
University is an example for environmental assessment at global level,
however, the possibility of application in local context like in Vietnam still
exposes many issues to consider and address. This article introduces a new
approach in environmental performance assessment in the world, through
the example of EPI, and analyzes some difficult, favorable conditions when
applying in Vietnam.
2. Approach DPSIR in environmental performance evaluation
DPSIR is an approach to analyze comprehensive socio-economic and
environmental aspects to assess the sustainability, developed in 1993 by the
Organization for Economic Cooperation and Development (OECD), and
then applied by the European Environment Agency (EEA) since 1995.
DPSIR is the abbreviation in English words: Driving - Pressure - State Impacts - Response. Each specific word expresses different meaning to
describe the relationship between human socio-economic development
activities and the environment. Driving (D): is the social, demographic and
economic development in society and corresponding changes in lifestyle,
consumption and production patterns. More specifically, driving is often
meant as socio-economic branches to satisfy the human needs such as food,
water, housing, health, security, culture. Driving puts pressure on the
environment as a result of production and consumption processes. Pressure
(P): is meant the pressure (intentionally or unintentionally) from human
activities on the environment. Pressure includes: the use of natural
68
International experiences in developing environmental performance index…
resources, changes in land use, emissions of substances (chemicals, rubbish,
noise, radiation,…). Pressure makes influence on changed environmental
status. State (S): it describes the quality of environmental elements (air,
water, soil,...) in relation to the function of each element. Therefore, the
environmental status reflects geographic, chemical and biological
conditions of environment. Impacts (I): is the effect due to changes in the
environmental status on human life through services (functional or
potential) of the life-support ecosystem. Response (R): is meant the human
decision to remedy the impact on ecosystems or their values.
According to DPSIR approach, the development dynamics of the economy
create pressure on natural resources consumption and cause environmental
pollution. If this pressure exceeds the capacity of that territory, it shall be
considered as unsustainable and the direct result will be the degradation in
environmental quality. In order to make effective development policies,
there should be a system of indexes to support DPSIR model, these indexes
can be verified through its various components to establish a cause - effect
relationship of environmental ecological degradation. Approach by DPSIR
socio-economic development indicators are integrated with environmental
indicators under Driving and Impacts issues.
DPSIR has been applied in many countries as a new approach in analyzing
environmental policy towards sustainable development goals. DPSIR
effectively assists in assessing the success of the national targets on
environment; evaluating the impact of them when implementing
development policy and assessing the capacity for mitigating negative
impact of development activities by developing appropriate policies and
management methods. In Vietnam, the environmental statistical indicators
are developed by General Statistics Office following DPSIR approach to
help management agencies, policy makers easily assess the relationship
between development policies and related environmental impacts, or
identify which group of factors have made efforts to improve the
environment, etc...
The set of Environmental Sustainability Index (ESI) was initiated and
developed in 2000 by the Yale Center for Environmental Law and Policy
(YCELP) and the Center for International Earth Science Information
Network (CIESIN) at Columbia University. ESI was a precursor of the
environmental performance index (EPI) which was also developed later on
by Yale and Columbia. ESI was launched as a complement to the
Millennium Development Goals (MDGs) and was a comparator argument
for General Domestic Product (GDP) index, which has long been used to
refer to the level of prosperity. The objective of ESI is to provide science
JSTPM Vol 4, No 2, 2015
69
based quantitative data to review and evaluate long-term sustainable
development goals. Although the Millennium Declaration set out the goals
of sustainable development, it practically had no quantitative verifiable data
to support the implementation of these goals, unlike for other goals such as
poverty reduction, health care and education. ESI was published in the
same year to help solve the problem of lacking related quantitative data to
support the Millennium Development Goals and has helped governments to
integrate the sustainability into objectives of key policies.
ESI was the first attempt to rank countries according to 76 different criteria
on environmental sustainability, including natural resources, past and
present pollution level, environment management efforts, contribution to
the protection of the global community, and the ability of society to
improve environmental performance along the time. However, because of
broad research scope covering so many ideas, ESI looks like a guide for
policy makers.
The use of environmental sustainability index (ESI) was not continued for a
number of reasons. First, it was still difficult to obtain the same
understanding, acceptance and measurement on environmental
sustainability. Moreover, it remained limited for policy-makers to
immediately use of ESI due to the complexity of issues of study,
assessment, uncertainty of the scientific hypotheses on between cause effect relationship, the complexity and competitive relationship between
policy implementation actions with the socio-economic and environmental
aspects of sustainable development. To evaluate the environmental
effectiveness it needs a simpler approach, easier to measure for monitoring
environmental impacts.
To address this challenge, in 2006, the research team of Yale University
and Columbia University in the US shifted to do research on environmental
performance index (EPI), focusing on narrower environmental issues that
each government is responsible for implementation.
3. Environmental performance index (EPI)
After the UN Millennium Development Goals (MDGs) was launched to
promote the countries worldwide implement development policies towards
sustainable development, the formulation of standards for evaluation of the
result of pollution control and natural resource management became a very
urgent issue. MDGs set specific targets on reducing poverty, improving
health conditions and education and commitments to environmental
sustainability. However, there were many arguments that the environmental
sustainability aspect of the MDGs was fully defined with appropriate
70
International experiences in developing environmental performance index…
measurement. In 2006, Yale and Columbia universities of America studied
and proposed the development of the environmental performance index
(EPI) to address this deficiency. EPI focuses on two objectives of
environment protection, namely: (1) environmental health and (2) enhanced
health of ecosystems and better natural resources management. These two
EPI objectives were toughly analyzed by scientists of Yale and Columbia
universities based on environmental priority issues reflected in the relevant
policies and largely in environmental issues mentioned in UN MDGs.
EPI was developed on the basis of inheriting the results of ESI, it was an
attempt to elaborate further the concept of "sustainability" that had been
still abstract in ESI. EPI was also developed to assess current environmental
activities in countries around the world, within the scope of sustainability.
EPI includes many component indexes and divided into two major subjects.
The first group, called Environmental Health index group, is to measure the
effort to reduce pressure on the environment in respect of human health,.
The second group, called Ecosystem Health index, is to measure the
reduction of losses or degradation in ecosystems and natural resources. The
indicators were selected on the basis of consideration and thorough review
of environment policy researches, policy consensus through dialogue on
Millennium Development Goals, and from consultation with specialists.
These indicators can also express a range of priority quantitative and
measurable environmental issues based on existing data sources.
EPI is periodically reviewed and updated to compare the implementation of
national environmental policies and make assessment the environmental
quality status of countries. Proposed in 2006, EPI first consisted of 16
indicators. EPI report 2010 included 25 indicators monitoring over 10
policy categories, they were used to compare and rank the national
environmental protection effort of 163 countries. From the first trial in
2006, now there has been EPI implemented in 2008, 2010, 2012 and 2014,
respectively. Since 2012, EPI has been developed to assess, based on time
series data, the trend of EPI improvement over the years.
Yale University used objective approach by linking the policy objective
indicators to calculate EPI. For each country and each indicator, a value
close to the objective is determined based on the distance between the
current results of a nation and policy objectives. The policy objectives are
drawn from four sources: (1) international treaties or objectives highlighted
in international agreements; (2) standards set by international organizations;
(3) top priorities required by the country; (4) based on scientific consensus.
Scores are calculated for each of the ten policy, based on 1-4 basic
indicators. Each basic indicator represents a discrete set of data. This score
JSTPM Vol 4, No 2, 2015
71
is then calculated separately for the Health and Ecosystem targets.
Environmental Performance Index is determined by the average value of
the two above total points (current weight per points is 30/70 equivalent to
two groups Health and Ecosystem)2.
The EPI calculation includes four key steps, as follows3:
Step 1 - Handling raw data: there may be missing data or differences in
unit of calculation of the data collected from various sources, therefore it
requires a processing step to convert them to the same level. While
determining global EPI, Yale university was very careful to record the
missing data and the cause of missing (due to specific characteristics and
conditions of each country). Also in this step, the value of raw data (i.e, the
total waste) needed to convert by dividing it per the population, GDP or
some other form of data which can be compared across countries.
Conversion unit was usually % (i.e, deforestation rate in a period of time),
unit per each economic product (i.e, energy use per GDP), unit per area (i.e,
percentage of territory exceeding a certain threshold of water extraction),
unit per capita (i.e, CO2 emission per capita).
Step 2 - Conversion of data: in many cases, data compared on the same
indicator between countries do not differ too much, or the gap compared to
the objective was very small. At this step, the use of logarithmic conversion
technique to make the gap clearer before comparison. Using logarithmic
transformation will help to distinguish more clearly between best practice
countries (in case these countries had best achieved the results close to the
goals), furthermore it also clearly shows a significant difference between
the top and the bottom countries in the rank.
Step 3 - Converting data into indexes: the converted and logarithmic data is
then transformed into indexes. These data created a common unit of
analysis, allowing comparison between indexes as well as aggregated into
one indicator. Different indicators using different indexes/ calculations as
point z of index ESI (ESI's z-score) indicates hectares of biological
productivity land of ecological footprint and the use of USD of green GDP.
EPI used a method approaching to the target, i.e, the implementation of
each country of any index was to be measured based on the location of that
country within the scope defined for the worst performing country
(equivalent to 0 in the scale of 0-100) and the objective (equivalent to 100).
The calculation of indexes was by formula:
2
Yale Center for Environmental Law and Policy, Center for International Earth Science Information Network.
EPI 2012 Environmental Performance Index and Pilot Trend Environmental Performance Index.
3
Yale Center for Environmental Law and Policy. (2013) Measuring Progress A Practical Guide from the
Developers of the Environmental Performance Index (EPI),
72
International experiences in developing environmental performance index…
(international gap - distance to the target) x 100 / international gap
For example, scores of the index "hygiene access (i.e the percentage of
population have accessed to appropriate sanitation)" is calculated as
follows:
- The goal is 100% accessed sanitation
- The worst performing country could be 5% of the population have
access to appropriate sanitation
- Other countries may be: 65%
- International gap: 100 - 5 = 95
- Distance to the target: 100 - 65 = 35
- For countries with access rate 65%, the score close to the target is: (9535)*100/95 = 63,1
Step 4 - Identifying potential target for indexes: International goals (e.g the
goals stated in environmental conventions or by international organizations
like WHO), scientific standards or decisions made from expert consultation
processes can be used. For EPI, the achievement or over achievement of the
target is equivalent to score 100 in a scale of 0-100. The benchmark for the
poor performance is usually set out by the worst performing countries for
each specific index.
- Weighing and ranking: After the data is collected and standardized, the
final step is weighting and ranking. In calculating aggregate indexes,
weighting and ranking is particularly a sensitive and subjective matter.
There often is no clear consensus among experts about the formulation of
aggregate indexes, how to determine the methodology to deal with complex
issues such as those appeared in EPI. These weights had been used in the
indexes, policies and objectives in order to calculate EPI aggregate scores.
In the first EPI report, weights were 50-50 for two Environmental Health
and Ecosystem goals. However, this measure made EPI aggregate index be
strongly influenced by the results of the implementation of environmental
health goals. The results showed that there was more correlation between
EPI aggregate point with environmental health goals rather than Ecosystem
goals. In other words, countries perform well environmental health
objectives it looks as higher EPI aggregate points regardless to score of
Ecosystem goals. Therefore, in the later EPI report, specifically in EPI
2012, the Environmental health targets were adjusted down to 30% of the
total points meanwhile the Ecosystem objectives accounted for 70%.
According to Yale University, the change in the weight simply reflected a
JSTPM Vol 4, No 2, 2015
73
statistical correction which was necessary for aggregate method to calculate
more balanced EPI scores between the two objectives.
Environmental impact on health
Percentage of newborn child’s death
Indoor air quality
Protection
of human
health
Air quality
Dust pollution - average
concentration PM2.5 in air
Access to clean water
Water and sanitation
Access to environ. sanitation
Protection of water resources
Waste water treatment
Agricultural price subsidies
Agriculture
EPI INDEX 2014
Management of pesticide uses
Forest
Changes of forest coverage
Fish stocks
Aquaculture
Pressure of coastal areas
Protection
of vitality
of
ecosystems
Protection of habitats of national
importance
Protection of habitat of international
importance
Biodiversity and residencial places
Marine Protection Areas
Protection of critical habitats
Trend of CO2 emission/KWh
produced
Climate and Energy
Changes in CO2 emissions trends
Trend of CO2 emissions
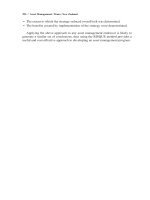
Source: />
Figure 1. Yale Model of EPI 2014
The EPI model proposed by Yale and Columbia is represented in Figure 1.
The two major objectives that EPI focused were the environmental health
74
International experiences in developing environmental performance index…
and ecosystem vitality. For each subject, relevant policies had been
reviewed using 18 specific goals. For example, with the goal of
environmental health, health policy, impacts of water and air quality on
human health were considered. Corresponding to these policies, group of
indicators used were environmental impact caused by disease, accessibility
to clean water or sanitation, urban dust, etc... The second goal the EPI
wanted to show was the vitality of ecosystems. In order to accomplish this
goal, the impact of policies on environmental quality on the ecosystem such
as air, water pollution, biodiversity, forests, climate change etc. was
considered. Correspondingly indicators were used to measure, for example,
level of NOx emission, protected landscapes, growth of reserves, forest
coverage, greenhouse gas emissions per capita, energy consumption, carbon
emissions per unit of electricity generated, or carbon emissions per unit
product produced by manufacturing industry, etc...
Through initial implementation of EPI, some advantages have been noted
when ranking some countries, as follows:
(1) It could be used to determine the effectiveness of policies for
environmental management, pollution control and identify the
difficulties and challenges in quantitative evidence based management
of natural resources. So the management or monitoring of
environmental development trends was better thanks to actual data
analysis, or clear comparison of success and failure factors of policies
on environmental protection, it was a new approach to help policy
makers develop and improve the policies be more appropriate with the
practical requirements.
(2) EPI was used to evaluate the effectiveness of the implementation of
environmental policies, serving as a basis for evaluating whether the
set out policy objectives have been fully implemented or not.
(3) EPI helped analyze policies more closely. To implement this method, it
should have systematic and unified reports, statistical data. Therefore,
EPI required better databases established.
(4) Based on EPI index, the overall rating had important implications in
indicating which country, region, locality that had done best
implementation of environmental policy with environmental pressures
that nation or locality were facing. Greater significance in terms of
policy analysis that the use of in-depth analysis results based on the
data to evaluate the effectiveness of policy implementation for specific
issues; the type of policy effective to groups/organizations in society, at
national or local level. Analytical results of such an assessment could
be useful in adjusting policy options to help better understand
JSTPM Vol 4, No 2, 2015
75
significant factors to environmental decision. More generally, EPI
provided a powerful tool for every locality, nation to measure the
environmental efficiency of their activities towards a sustainable
environment.
EPI was developed by Yale and Columbia using a set of indicators to
compare and rank environmental performance among countries. The basic
premise of the EPI was that if only quantitative information and subjective
judgment used it was not sufficient for environmental policy-making.
Quantitative measurements are not only useful in policy making, but also
help compare the implementation of feasible environmental policies. EPI
monitors effective environmental trends based on analysis of the most
reliable data from key policies. Additionally, through transparent and easy
visualized data, EPI helps leaders understand the strengths and weaknesses
of the environmental performance of the country compared with the others.
EPI reflects a screening by scientific method. DPSIR approach makes EPI
becomes more useful for policy makers because they can focus their
analysis on a narrower set of standards. These standards include core
indicators meeting higher requirements, such as the results must be directly
measured (rather than modeling of data), in a certain period of time, or
within an institutional commitment to maintain these data in the near future.
The strict application of standards thus allows tracking environmental
performance by time and may continue in the future by using a set of more
appropriate indicators.
At the provincial level, the application of EPI can help supplement the
information in the process of preparing national reports. In the context of
limited financial resources, this can help local governments be more
convenient to assess the objectives of the policy, determine priorities and
better implement environmental policy. However, it is difficult to interpret
the unsatisfactory results. At the central level, EPI helps compare, identify
which locality is leading or stays behind, EPI can determine results, clearly
indicate which locality has implemented best environmental practices, and
thereby can identify the priorities for appropriate actions.
Currently, some countries, such as China and Malaysia, have developed
provincial EPI index following the approach of Yale University. In China,
Yale University in cooperation with Chinese National Institute of
Environmental Planning and City University of Hong Kong4 from 2008 to
2010 to study and develop provincial EPI. This index aims to target three
4
Yale Center for Environmental Law and Policy, Center for International Earth Science Information Network.
Chinese Academic of Environmental Planning, City University of Hong Kong, 2013. Toward a Chinese
Environmental Performance Index
76
International experiences in developing environmental performance index…
major subjects, namely environmental health, ecosystems, and economic
sustainability, including 10 environmental policies with 32 environmental
targets. Experience in development of Chinese provincial EPI shows
difficulties and challenges in accessing data sources, particularly data on
status of environmental monitoring. Some data on fisheries stocks and salty
water quality had not met the requirement for calculating the general EPI.
China's experience can be an important source of reference when
developing provincial EPI in our country.
Another example is the case of Malaysia, the country also developed local
level EPI, namely at 16 respective states. This EPI was developed by the
Technical University of Malaysia in cooperation with the Ministry of
Natural Resources and Environment of Malaysia. The process of Malaysia
EPI development started around 2008 and by 2010 the first report
published. Currently, through a lot of effort of continued improvement,
Malaysia has announced EPI reports at local level for 2012, 2014. Unlike
China, Malaysia EPI local level had additional goals of socio-economic
sustainability (apart from the two goals of environmental health and
ecosystem vitality based on a global EPI approach of Yale University), with
14 policies, 33 targets. Through yearly EPI reports, so far Malaysia has
been able to compare the implementation progress of environmental
policies of the state.
4. Development of local level environmental performance index in
Vietnam
During past time, along with accelerated industrialization and
modernization, Vietnam has made remarkable achievements in socioeconomic development. The life of the people has been improved, the
country has become a middle-income country. However, with the effect by
global warming, our country also encountered with many pressing problems
of pollution and environmental degradation caused by development
process.
Bearing in mind of that, in the period 2005-2010, the Vietnam Government
developed a relatively comprehensive, synchronized system of policies and
laws on environmental protection, including Law on Environment
Protection 2005, Biodiversity Law 2008 with a system of complete underlaw guiding documents. The system of state management agencies on
environmental protection from central to local level, from ministries to
enterprises, has gradually been strengthened and in stable operation.
Since 1992, the Asian Development Bank (ADB) has launched a program
for expanded countries in Mekong sub-region to support countries in the
JSTPM Vol 4, No 2, 2015
77
Mekong River Basin to achieve the goals of sustainable development. ADB
has proposed and implemented the content of Environment Performance
Assessment (EPA) to strengthen national capacity in the preparation of
environmental reports and determination of environmental index set. But
the complete EPA type report had the main purpose to describe the picture
of the current state of the environment without reflecting the quality and
effective implementation of the policy on environment and natural
resources management. There has not existed a system of indicators to
compare localities regarding the effectiveness of implementation of policy
in natural resources and environment management in a systematic and
comprehensive way.
Approach to EPI calculation of Yale University following the method
"Proximity-to-target" is a suitable direction. This method determines the
results of implementation (can be quantified) of policies and compare with
the already set out objectives. Then making general scoring to rank with the
principle of the greater point the higher rank. EPI calculation is based on
the principle of integration, i.e environmental performance results are
determined by assessing a range of targets to measure the results of the
implementation of a certain relevant policies. Because the implementation
of policies and their impacts/ consequences created are very different, they
should be converted to a coordinate comparable system. With the method of
"proximity-to-target" calculation, different targets in policy group will be
integrated into a general EPI targets to ensure the level of contribution of
targets.
Proposed approach to develop provincial level EPI in Vietnam
EPI is a new approach in the world and currently is under pilot
implementation to compare environmental performance at national level.
Therefore, to formulate provincial EPI index, it needs to learn international
experiences in the development of set of EPI proposed at the national scale
(used to compare the effectiveness of environmental policies among
countries) to inherit what can be deployed at the local level.
Through actual study, some difficulties and challenges in elaborating
provincial EPI appropriate to conditions of our country are as follows:
- Definition of priority objectives in environmental policies at the national
and provincial level: The consideration and review of the policy
priorities in environmental management in Vietnam expressed specific
objectives of each policy. Approach to calculate global EPI proposed
and implemented by Yale University, defined the objectives of
environmental policies as a basis to assess the extent of "completion" by
78
International experiences in developing environmental performance index…
the country in respect of environmental commitments. However, with
local level, there have many goals in environmental policies not been
clearly stated, therefore in many cases, it may use national goals as a
basis of comparison;
- Lack of data on environment status and not synchronized data among
localities: Data is one factor playing a decisive role in the calculation of
targets. Therefore, it needs to revise the statistical system of
environmental targets which has been long developed and implemented.
Based on this content, it is necessary to analyze the need, the possibility
of developing suitable indicator set for Vietnam at the provincial level.
Experience of Yale University using independent, verifiable and open
access data sources. In local condition and capacity of Vietnam, the
access to environmental data is more difficult, and there exists a
incomplete database system on environment, so the identification of
necessary and feasible data is extremely important for the success of
EPI. In present conditions, the system of environment statistical
indicators is being developed by GSO, when finished, it will be an
important source of suitable data for EPI testing. However, it should not
be limited to data sources from there, it can use data sources from local
reporting systems and management agencies, or from independent
studies in order to compare and verify;
- Identifying appropriate environmental indicators to specific conditions
and characteristics of localities: in initial testing steps, the identification
of environmental indicators according to the priority environmental
issues will facilitate the development of provincial EPI. These indicators
should reflect the environmental situation, and minimize the overlap
when evaluating the issue using cause-effect approach. In reality, the
separation of factors in cause-effect relationship is very difficult, so
DPSIR approach is a suitable solution to determine target groups of
driving, pressure, state, impact or response. There is not always available
data on the status quo, so the selection of parameters under other
remaining groups may be appropriate, for instance, response target group
can reflect local efforts in implementation of environmental policies.
In the feasibility study stage, EPI at local level for Vietnam, approach by
the EPI method of Yale University is appropriate, however, the group
targets policy should be limited in environmental Health and ecosystem
Health. This limitation is to evaluate the pilot experienced in the condition
of existing environmental data (with the environment statistical indicators
available in the national and local statistical system). Through the
JSTPM Vol 4, No 2, 2015
79
evaluation of existing indicators, data and indicators accessibility it may
suggest the composition of local EPI as follows:
- Group of indicators for environmental health assessment:
This group of indicators aims to assess the enforcement of environmental
policies and their results via indicators of habitat quality. The most
important environmental issues to be considered including: water, air
quality, environmental sanitation, and waste management.
For water quality, the evaluation will consider the results of the
implementation of the goal of improved accessibility to clean water of the
people in urban and rural areas. Also, the accessibility to environmental
services such as waste water treatment is also subject to evaluation. Group
of evaluation criteria includes: Indicator regarding proportion of urban
population have access to clean water; Indicator of proportion of rural
population using hygienic water; Indicator of urban waste water is treated
in accordance with standards; Indicator of industrial waste water is treated
in conformity with standard.
Regarding air quality, the aim is to assess the possibility of reducing air
pollution based on the results of air environmental monitoring, with the
main parameters as NO2, CO and TSP. By assessing the current situation of
data available at localities, the results showed that in provinces, some air
quality monitoring stations have not covered all the area, only in major
cities and some provinces. The evaluation indicators of air quality objective
include: Indicators for NO2, CO, TSP.
As concerned the assessment of policies to improve the quality and
accessibility of the environmental sanitation services, it will be based on the
indicators of the proportion of people using appropriate standard hygiene.
The evaluation indicators for environmental sanitation: Indicator of
proportion of urban households having sanitary latrines; Indicator of
proportion of rural households having hygienic latrines.
Waste management is evaluated by indicators of collection and treatment of
solid waste in urban and rural areas. Through reviewing the available data,
primarily the figures from statistics of solid waste sources, the collection
and treatment rates were not accurate as the data based on estimates by
localities. The evaluation indicators of waste management is Indicator of
volume of urban solid waste collected; Indicator of number of solid waste
treatment facilities in urban area conformant with standard; Indicator of
rate of solid waste treated.
- Group of indicators for ecosystem vitality assessment.
International experiences in developing environmental performance index…
80
In this group, indicators to consider the relevance to activities of
rehabilitation of degraded lands, conservation of biodiversity and forests,
water resources. Due to the potential data have not yet met to carry out this
evaluation, the selection of intermediate indicators can indirectly help
reflect the local effort in reducing the impact of affected activities. Group of
indicators to assess ecosystem vitality are, as follows:
Indicator to assess soil quality: Indicator of pesticides used /ha of
cultivated land; Indicator of fertilizer used /ha of cultivated land;
Indicators to assess biodiversity conservation: Indicator of percentage
of biodiversity conservation area;
Indicators to assess the objective of protecting forest quality:
Indicator of forest coverage; Indicator of primeval forest area;
Indicators to assess the conservation of water resources: Indicator of
surface water quality.
The above recommended indicators for provincial EPI to be initially
developed, provided that there is condition and accessibility to the data at
the national and local level. Based on the assessment on pilot exercise, the
selection criteria will continue to be improved to better suit the actual local
requirement in respect of management and implementation of
environmental policies. The development of environmental performance
indicators will serve as a basis for boosting efforts to implement
environmental policies in localities. At the same time it would be an
opportunity to build up a database system on environment, enabling policymakers, academic, management agencies to get access, monitor and
evaluate the environmental implementation at local and national level./.
REFERENCES
1.
Yale Center for Environmental Law and Policy. (2013) Measuring Progress A
Practical Guide from the Developers of the Environmental Performance Index (EPI).
2.
Yale Center for Environmental Law and Policy, Center for International Earth
Science Information Network. EPI 2012 Environmental Performance Index and Pilot
Trend Environmental Performance Index.
3.
Yale Center for Environmental Law and Policy, Center for International Earth
Science Information Network. 2014 Environmental Performance Index - Summary
for Policymakers.
4.
Yale Center for Environmental Law and Policy, Center for International Earth
Science Information Network. Chinese Academic for Environmental Planning. Cities
University of Hong Kong, Toward a China Environmental Performance Index