The role of ecosystems for start ups: A comparative study between Korea and Finland
Bạn đang xem bản rút gọn của tài liệu. Xem và tải ngay bản đầy đủ của tài liệu tại đây (681.71 KB, 26 trang )
43
THE ROLE OF ECOSYSTEMS FOR START-UPS:
A COMPARATIVE STUDY BETWEEN KOREA AND FINLAND1
Matthias Deschryvere2
VTT Technical Research Centre Finland LTD, Espoo, Finland
Younghwan Kim
The Science and Technology Policy Institute, Sejong-si, Korea
Abstract:
The strategic importance of innovation ecosystems has received increased attention from
both the academic and policy perspectives. However, there is only limited empirical
evidence on the importance of these ecosys- tems from the perspective of younger firms.
This study focuses on the role of ecosystems for young innovative companies (YICs) and is
based on a unique set of phone survey data from Finland and South Korea. The re- sults
are threefold: (i) Finnish YICs participate more actively in ecosystems than Korean YICs;
(ii) on aver- age, Korean YICs report to have experienced lower ecosystem impact
compared to Finnish YICs; (iii) in both countries, key organizations of the ecosystems are
represented on the board of directors in about one-third of the sample firms.
Keywords: Innovation ecosystem; Start-up ecosystem; Finland start-ups; Korean startups; Ecosystem impact.
1. Introduction
The insight that innovation activities of firms and their success depend
increasingly on other actors has led to the introduction of the concept of
innovation ecosystems (Adner, 2012). Despite the recent interest in
innovation ecosystems, the original concept dates back over two decades and
refers to a loosely interconnected network of companies and other entities
that coevolve capabilities around a shared set of technologies, knowledge,
and skills, and that work cooperatively and competitively to develop products
and services (Moore, 1993). For the purposes of this paper, ecosystems are
1
This analysis is based on the research cooperation between VTT Technical Research Centre Finland Ltd., Ghent
University (Belgium) and Science and Technology Policy Institute (STEPI, South Korea) and is part of the
EnterGROW project (Number 40349/13) financed by TEKES - the Finnish Funding Agency for Innovation - and
VTT. The authors would like to thank Dr. Yoon-Jun Lee, Dr. Sunwoo Kim and Prof. Mirjam Knockaert for
discussions and comments. We also thank all participants from the “Analysis of Cluster Models and Cluster
Ecosystem” session at the 18th TCI Conference on November 4th, 2015 in Daejeon, Korea.
2
The author’s contact email:
44
defined as being characterized by dependencies between the members, by
common goals and objectives and by a shared set of knowledge and skills
(Nambisan & Baron, 2013). Members can be firms but also other
stakeholders such as universities, research institutes, financers, community
groups, standards setting organizations, or professional associations.
This study focuses on the role that innovation ecosystems play for young
innovative companies. While the vast majority of ecosystem literature
focuses on incumbent firms in ICT, little evidence exists on the interaction
between younger firms from other industries and the innovation ecosystems
they participate in. Our focus is on young innovative companies (YICs) that
are expected to have higher levels of turbulence and innovation than their
non-innovative counterparts (Iansiti & Levien, 2004). In this paper, YICs
are defined as firms founded less than eight years ago that have applied to
an innovation agency for public funding3.
The analysis is based on a data-set of innovative start-ups from Finland and
South Korea, two innovation-driven economies ranked 6th and 14th
respectively in the Global Innovation Index (Dutta, Lanvin, & WunschVincent, 2015). Both countries are among the top innovation performers in
their respective regions, with their global entrepreneurship index rankings
in 2015 being 14th and 28th respectively (Acs, Szerb, & Autio, 2014).
The contribution of this analysis lies in improving our understanding on the
role of ecosystems for start-ups from a broad range of industries in these
two benchmark countries. In the early 2000s, these two countries grew
their economies through contributions of global companies such as Nokia
(Finland) and Samsung Electronics (Korea). They have since found it
difficult to sustain previous levels of long-term economic growth due to
external environmental changes such as increasing global competition and
the shift in the industrial structure of IT from hardware to software. To over
come these environmental challenges, Finland and Korea are moving from
their large company-friendly policies to policies that promote start-ups and
grow small-and medium-sized companies (SMEs), especially those in hightech industries. Consequently, Nokia and Samsung have been replaced by
Rovio and Supercell, which are world-famous game companies, and Kakao,
which is the biggest mobile messenger in Korea, as leaders for the
countries’ future growth.
Finland and Korea have common innovation ecosystems features for
startups and SMEs in high-tech industries. However, these two countries
differ significantly in geography, demography, business environment,
3
See methodology section 4.1 for YIC definition details
45
market, and culture. Therefore, studying the impact of ecosystems in a
comparative country approach enables us to test the generalization of
research results of each country and to albeit only partially reveal the role
of different innovation systems and cultural contexts. We fill the research
gap on how ecosystems impact younger firms (Tukiainen, Lindell, &
Burström, 2014). In addition, empirical-based analyses on ecosystems
enable us to draw policy conclusions.
Our descriptive results show that while the business network activities of
Finnish and Korean YICs look similar at first, Finnish YICs feature more
complex innovation ecosystem activities. The comparatively smaller Finnish
internal market may explain why Finnish YICs depend more on
international support than Korean YICs do. On average, the reported impact
of innovation ecosystems on firm performance is higher in the Finnish
sample than in the Korean sample. While Finnish YICs record impact in the
start-up phase, Korean YICs note more impact in the growth phase of the
firm development. Unlike the ecosystem impacts, board performance and
board diversity is reported to be higher among Korean YICs than in Finnish
YICs. Overall, Korean YICs show more narrow networks with strong ties
while Finnish YICs show broader networks with weak ties.
The paper first summarizes the key international literature and the
ecosystem policy orientation in both countries. It describes the survey data
from the sample YICs in Finland and South Korea, and subsequently
examines how firm leaders see ecosystems and their characteristics in both
countries. In addition, we observe how they assess ecosystem impact and
what the performance and diversity of the board of directors look like.
2. Literature background on ecosystems and firm performance
Despite the importance of innovation ecosystems, few contributions (Adner
& Kapoor, 2010) have explicitly considered value creation and
appropriation (Autio & Thomas, 2013). The members of ecosystems can
create more benefits as a group than alone, and collaborations in an
ecosystem are expected to lead to superior performance (Tencati & Zsolnai,
2009). The good reputation of an ecosystem may also benefit its residents
(Van der Borgh, Cloodt, & Romme, 2012). In addition, ecosystem
participation may help members better manage unstable environments
(Zahra & Nambisan, 2012) by providing direction and reducing
uncertainty. By mobilizing ecosystem resources, firms can mitigate coinnovation risks upstream and downstream (Li & Garnsey, 2014). Due to
external economies of scaleecosystem members may further benefit from
access to unique ecosystem sources such as networks (Clarysse, Wright,
Bruneel, & Mahajan, 2014; Van der Borgh et al., 2012) and from cross-
46
industrial complementarities (Van der Borgh et al., 2012). Importantly,
additional complementary resources can generate complementary
innovations (Gawer & Cusumano, 2014). Other stated benefits include
easier access to established markets, branding and reputation advantages,
access to technical know-how and intellectual property (IP), and better
initial public offering opportunities, especially in the case of hub-based
innovation ecosystems (Ceccagnoli, Forman, Huang, & Wu, 2012;
Eisenmann, Parker, & van Alstyne, 2009). In the case of platform-based
eco- systems, participation brings potential benefits such as an increase in
product variety, lower production and inventory costs, and reduced time to
market (Gawer & Cusumano, 2014).
While the vast majority of the ecosystem literature analyzes ecosystems
from the perspective of focal firms or platforms, little empirical evidence
exists on the role of ecosystems for smaller and younger firms (Autio,
Kenny, Mustar, Siegel, & Wright, 2014; Li & Garnsey, 2014; Nambisan &
Baron, 2013). Therefore, in this paper, we focus on the role of ecosystems
related to the performance of YICs4.
3. Role of ecosystem orientation in Finland and Korean innovation and
industrial policy
3.1. Finland policies
Finland innovation policy is characterized by four trends (Palmberg, 2015):
(i) moving towards broader based policies, (ii) focusing on system-level and
ecosystem promotion, (iii) shifting from direct to indirect R&D support, and
(iv) re-inventing industrial policy to formulate Innovation Policy 2.0. As the
global nature of competition shifted from industries (1980s) to clusters
(1990s) and value chains and networks (2000s) to ecosystems (2010s),
Finland innovation policy began to redirect a considerable part of its focus
on ecosystems with special attention paid to joint value creation, platforms,
orchestration, and public-private partnerships.
Finland industrial and innovation policies worked well for a long time, but
the financial crisis of 2008 and the subsequent record-long recession required
strategic growth policy (Kosonen, 2016). According to former CEO of Nokia
Jorma Ollila (“Jorma Ollila: Suomi on kuilun partaalla”, 2016), established
companies have to learn much more from start-ups, which is a key point that
4
In the ecosystem literature, Iansiti and Levien (2004, p. 74) distinguish between four types of firms based on the
complexity of the relationships and the level of turbulence and innovation. For higher levels of innovation, a
distinction is made between keystone firms or value dominators and the rest, a category of niche firms. The focus
in this paper on young innovative firms goes beyond keystone firms.
47
should lead new policy orientation. For this new orientation, the focus should
be on supporting ambitious global ecosystems that are led or supported by
Finland firms (Kosonen, 2016). This implies that public support decisions for
individual firms require an understanding of the ecosystem(s) they belong to.
Key policy tools for enabling the development of ecosystems are public
procurement of innovation, public-private partnerships, and experimentation.
The ultimate aim of ecosystem policies is to raise global attention on and
foreign investment in Finland and to boost exports and employment. Second,
a policy focusing on “born-global ecosystems” requires a silo that has strong
cooperation between different actors, start-ups, medium firms, large firms,
RTO’s, universities, different ministries and different support in a holistic
approach (Kosonen, 2016). According to the Research and Innovation
Council, ecosystems that are defined as an extensive and interactive network
of many actors are a precondition for global high-class expertise. The role of
the public sector and innovation funding will be to promote of the
functioning of the ecosystems in current and new growth sectors (Research
and Innovation Policy Council, 2014, p. 20-21).
3.2. Korean policies
The key to Korea’s success in industrial and economic development over
the period of 1960-1980 was the “fast follower” strategy. Choosing several
fundamental industries with low-risk tech and products, the Korean
government concentrated its limited national resources into these industries
in order to lower production costs and secure profit towards national
wealth. While this “selection and concentration” strategy helped companies
to secure high market shares and keep their product prices competitive, it
created an economic inefficiency stemming from the dominance of a few
large companies (the chaebol conglomerates). Since 2008 American
financial crisis and the subsequent long economic recession, Korean
economic and industrial growth has been stunted by market saturation and
the stagnation of household disposable income. The limitation of the future
growth of large companies negatively affected the growth of employment.
In addition, later developing countries with relatively cheap labor, i.e.,
China and India, are catching up to Korea.
This dramatic change in the global economy and industrial environment
compels Korea to move from the fast follower strategy to the “first mover”
strategy in order to move up to the next level of in terms of national
economic growth. This latter innovation policy requires a different tactic,
such as the “creative economy”, the main slogan of the current Korean
administration. This approach includes new innovation policy supporting
creative start-up businesses that converge science and technology, ICT, and
48
culture to create new value-added products and jobs. To improve the
innovation ecosystem and promote a creative economy, the Korean
government is trying to change the education system to cultivate creativity,
provide a space for investment capital and transactions, and increase public
and private markets for firms.
Intensive support by the Korean government on entrepreneurship and startup activities dramatically changed the ecosystem for start-ups in Korea in
the last half-decade. The number of new start-ups increased from 41,728 in
2008 to 84,697 in 2014, and the number of angel investors grew from 2,608
in 2012 to 6,000 in 2014. The government spent over 2 billion USD for
financial support and programs that installed related infrastructure and
instilled entrepreneurial culture. Following government efforts, various
players in the private sector entered the start-up ecosystem, such as new
venture capital companies (VCs), corporate VCs, accelerators for earlystage start-ups, start-up media, co-working spaces for entrepreneurs, and
consulting firms for start-ups. This new variety of players in the start-up
ecosystem implies that the focus of public policy shifted from large
companies to start-ups.
4. Data, methodology and descriptive statistics
4.1. Data and methodology
This analysis is based on firm-level survey data capturing the ecosystem
awareness and ecosystem impact of Finnish and Korean innovative start-ups.
In Finland (FI) the survey population5 consists of all applicants to TEKES
(the Finnish Funding Agency for Innovation) over the period 2009-2013. In
Korea (ROK), the sample was randomly selected among “venture firms”6
and “Innobiz firms”7 (in machinery and software industry) with a random
sampling of firms in other industries added as a control group. Based on both
telephone surveys, we obtained data for 440 YICs, 240 from Finland and 200
5
For a summary of the Finnish survey results see Deschryvere, Lehenkari, Oksanen, Rilla, and Still (2015).
Venture firm is a verified small-sized enterprise by the Government in terms of innovativeness and
technological competitiveness. The Venture firm should satisfy the requirements established in Article 2, Item 2,
and Clause 1 of the ‘Special Law for the Promotion of Venture Business’. The public verification system of
venture firms in Korea is unique such that the system categorizes Korean venture businesses into venture capital
investment firms, research & development firms, technical evaluation certification firms, technical evaluation
loaning firms, and preliminary venture firms.
7
Innobiz is also a verification system operated by the Government. Among small-sized firms which are older than
3 years, the Innobiz firms are accredited by Korea Technology Finance Corporation which is a public agency that
considers the firms’ capability of technology innovation, technology commercialization, management and
operation, and performance.
6
49
from Korea. YICs are defined as firms that are less than eight years old8. The
YICs cover the ICT industry, the machinery industry, and all other sectors.
After merging the survey data to firm-level data from the ORBIS database,
our final sample consisted of 424 YICs (FI: 240; ROK: 184).
The telephone survey was addressed to decision-makers (CEOs) of
innovative firms to improve our scattered understanding on how firms
participate in networks and depend on other partners within the ecosystem,
how the ecosystem affects the firm (ecosystem impact) and how corporate
governance relates to firm development. Before describing the results, we
point out the risk that our samples are not representative for the firm
population of Finnish and Korean YICs due to possible selection bias.
However, we see the value of our data in informing stakeholders about
ecosystem awareness and the impact on smaller and younger players beyond
incumbents from the ICT sector. In addition, the data of two countries offer
an interesting comparison. We further acknowledge that differences between
country scores can be driven by a complex set of phenomena, and therefore
the interpretation of results have to be made with care.
The questionnaire was designed based on literature from the fields of
network, ecosystem, and corporate governance. Questions on ecosystem
impact are based on the additionality principles outlined in Falk (2007).
Ecosystem impact cannot be straightforwardly measured and it may take a
long time before the benefits of belonging to an ecosystem translate into
objectively measurable performance changes such as growth in sales and
employment. Therefore, we incorporated a set of perceptual measures in our
survey that capture the intermediate impact (Falk, 2007)9. However, the
causality between belonging to an ecosystem and experiencing a firm-level
effect of the ecosystem is complex. As our data are in essence crosssectional, our results should be interpreted as associations. Future research
with access to panel data could disentangle the complex relationship further.
4.2. Descriptive: size, age, intellectual property rights (IPR), and industry
distribution
In this section, the main characteristics of the firms in sample are
introduced. The size distribution of the samples for both countries shows that
8
For this analysis start-ups are defined as firms that have their date of incorporation (base on ORBIS database) in
the period 2007-2014. In the literature there is no clear-cut definition on how to define start-ups and they have
been alternatively defined as being maximum 3, 5, 7, 10, 12 years old.
9
Impact questions relate to the most important ecosystem the firm participates in. The answers refer to the
agreement with 9 statements (from 1 fully disagree to 7 fully agree) on the role of the ecosystem for the network,
the innovation, the progress, the market expansion, the market share, the ambition, the collaboration with RTO’s,
the skills, and the growth of the company.
50
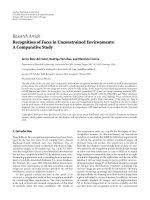
the majority of the innovative start-ups are small firms. Figure 1 illustrates
that in the Finland sample almost 80% of the firms are small (60% in the
Korean) that the Korean sample has a greater share of medium-sized firms
than the Finland sample10. Based on more detailed ORBIS data, average
employment for the sample firms is thirty-nine employees for Finland and
sixteen for Korea while average turnover amount is 5.8 million Euros for
Finland and 2.8 million Euros for Korea11. The average net income amounted
to 155,000 Euros for Finland firms and 42,000 Euros for Korean firms.
Despite the higher average size, Finland YICs have a younger average firm
age (4.63 years) than the Korean YICs (5.23 years) in sample.
The comparison of industry distribution also reveals some clear differences
between both samples (Figure 2). The Korean sample is dominated by the
manufacturing sector (ROK: 57.5% vs. FI: 20%) while the Finland
sample has more service sector firms (FI: 29.2% vs. ROK: 3.9%). For
other industries such as ICT (FI: 36.3% vs. ROK: 27.9%) and Retail (FI:
8.8% vs. ROK: 8.9%), the shares in both samples are fairly similar.
0%
20%
40%
60%
80%
100%
Small
Finland
Medium
Large
Korea
Figure 1. Firm Size Distribution in the Finnish and Korean Samples
0%
Finland
20%
40%
60%
80%
100%
Manufacturing
Retail
ICT
Korea
Services
Rest
Figure 2. Industry Distribution in the Finnish and Korean Samples
10
In the ORBIS database, large companies are defined as having an operating revenue ≥ US $13 million (EUR 10
million), total assets ≥ US $26 million (EUR 20 million), number of employees ≥ 150 while medium sized
companies are defined as having an operating revenue ≥ US $1.3 million (EUR 1 million), total assets ≥ US $2
million (EUR 2 million) and number of employees ≥ 15. The companies that are not included in the two
categories as decribed above are considered to be small.
11
Detailed ORBIS data on employment are available for 39% of the Korean sample and 50% of the Finnish
sample.
51
Looking at the IPR information further reveals that the average number of
patents is slightly higher for Korean YICs (ROK: 0.99 vs. FI: 0.84).
However, both samples have a very similar share of companies (75%) that
do not have patents. In the Finland sample, 18% of the firms have
trademarks while for the Korean sample the portion is only 1%.
Overall, the above descriptive statistics show that the Korea YICs in the
sample are larger and slightly younger on average. This may be due to
their higher share of firms in the service sector. Table A1 describes the
averages of the survey answers and test results for statistical differences in
the means. In addition, Table A1 shows statistical differences on the sample
means of Finland and Korea. For the interest of the reader, Table A3 and
Table A4 report separate descriptive statistics for the ICT and manufacturing
sectors.
5. Firm participation in networks and ecosystems
Despite the rising role of ecosystem awareness in policy and academic
circles, there is little evidence on how much firm leaders think in terms of
ecosystems and how often firms actually participate in ecosystems.
Therefore, the survey first collected information on ecosystem residency12
of Finland and Korean YICs and on key characteristics of ecosystems
(common targets, dependencies, and shared knowledge and skills). In
addition, we asked the CEOs about their network activities since they are
expected to be more familiar with the network concept.
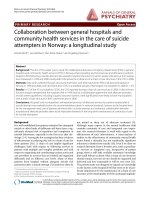
Figure 3 shows that Finland YICs report that they participate more often
in ecosystems than Korean YICs and that they have more complicated and
more mature networks than Korean YICs (see the portion of firms
participating in multiple ecosystems). In line with our expectations, the
data also reveal that broader (innovation) ecosystem residency is more
widespread than (business) network residency but that this difference is
clearly more pronounced in Finland than in Korea. When looking at
network residency in both countries (FI: 55% vs. ROK: 51%), no statistical
difference between both countries remains (Table A1). Indeed while 64.2%
of Finland firms participate in at least one ecosystem, less than half of the
Korean firms (48.4%) do so. The data suggest that Korean YICs belong to
more centralized and less connected ecosystems that are driven by large
firms or key players.
12
Ecosystem residency means that a firm stated it belongs to an ecosystem.
52
-100%
-80%
-60%
-40%
-20%
0%
20%
40%
60%
80%
Firm particpates in ecosystem
65%
48%
One Ecosystem
24%
19%
Multiple Ecosystems
41%
29%
Firm participates in a network of
external firms
55%
51%
Firm sets common targets with
other firms one depends on
54%
74%
Firm shares knowledge and skills
78%
87%
Figure 3. Ecosystem and Network Engagement of Finnish and Korean YICs
Figure 4 shows that the networks where Finland and Korean YICs reside
are at different stages of the lifecycle. On average, Finnish networks are
further developed. In the Finland sample, more firms reside in growing
networks (44%) while in Korea more firms participate in pioneering
networks (39%); the only exception is the Korean software industry13.
Figure 4. Network development phase distribution of Finland and Korean
YICs
13
More firms are residing in growing phase (48%) than in pioneering phase (38%) in the Korean software industry.
53
6. Level of globalization in ecosystems
As a result of network and ecosystem engagement, Finland YICs are more
likely than Korean YICs to receiving external support (Figure 5). In both
countries, the support of subsidies, loans, and capital from national public
financers (national subsidies) is the most popular and important support
channel for start-ups. This finding shows that in both countries the public
sector plays an important role in the ecosystem for YICs.
Further comparing the Finland and Korean sample reveals that there are
many more VC-backed firms (national and international) in Finland
(40.4%) than in Korea (8.7%). This can be explained by the tendency that
Korean YICs depend more on national subsidies than on funding from the
private sector. This fact can be clarified by several possible conditions such
as difference in ease of obtaining private funds for YICs due to a relative
portion of public subsidies compared to private sector. However, we would
need further analysis to provide the exact reason for the difference in
relative dependency on public funds between Finland and Korea.
The much lower dependency on family and friends in Korea is interesting
(35.8% in Finland versus 3.3% in Korea). From a cultural perspective, one
possible explanation is that the level of risk perception and a fear of failure
for start-up activities in Korea is higher than in Finland. The second
explanation is related to self-sufficiency. Founders and top managers in
Korean YICs are more likely to develop their businesses on their own. On
the other hand, Finland YICs are more active in requiring financial resources
including their neighbors’ help for their firms’ growth.
The largest difference between the Finland and the Korean ecosystems is
seen in the rate of support by international partners (subsidies and VCs).
Only one Korean YIC in our sample receives the support from
international VCs and subsidies, while 7.1% of Finland YICs are supported
by VCs and public financers respectively.
This finding shows that Finland has a more globalized ecosystem for startups. Finland YICs rely on international business partners to link to
international consumers since its domestic market and business
environment are small. In contrast, Korean YICs prefer domestic partners to
international partners for the growth of their businesses because they have a
relatively larger domestic market compared to Finland. The fact that
Korean YICs have few international partners is surprising, irrespective of
whether Finland YICs are more closely related with the EU market.
54
100%
Finland
Korea
80%
60%
40%
20%
0%
Public
research
National
VC
International
VC
Family and
friends
National
subsidies
International
subsidies
Accelerator
incubator
Figure 5. External Supporting Partners of Finland and Korean YICs
7. Impact of the innovation ecosystem
Start-ups usually do not have enough resources for firm growth. Therefore,
participation in ecosystems is essential to access capabilities and
competitiveness for their business. However, the reasons that start-ups
participate in ecosystems vary according to the firm’s situation. Because
start-ups do not encounter the same problems and obstacles in their
operations and management, they expect different impacts and benefits
from participation in ecosystems that would serve them.
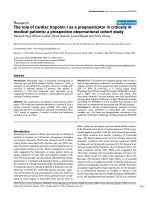
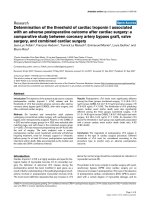
Figure 6 presents the proportions of two categories: “agree” and “disagree”
with statements on the different kinds of 5-year impact of the ecosystem on
the YICs. From the results, we find that Korean YICs have a less positive
view of the impact of the ecosystem compared to Finland YICs except for
“collaboration with knowledge centers” and “limited the growth of the
company”. Korean YICs think that the ecosystem is more useful to pursue
ambitious projects (69%), innovate better (62%), and collaborate with
knowledge centers (62%), while Finland YICs expect that the ecosystem is
more helpful for extending their networks (92%), doing ambitious projects
(81%), growing their firms faster (80%), and entering new markets (79%).
The largest gap between responses from firms in Finland and Korea exists in
the impact of entering new markets (36%), followed by extending networks
(35%), and growing faster (26%). Furthermore, clear differences are
observed in the ecosystem impact on collaboration with knowledge centers
(universities and research centers). As shown in Figure 6, the share of firms
in the sample from Korea that said they collaborate with knowledge centers is
almost three times larger than those that said they do not. On the other hand,
Finland YICs disagree on the impact of collaboration with knowledge centers.
The latter finding can partly be explained by differences in the industrial
composition of the sample and by differences in the national research support
systems for YICs. Comparing industries in Korea, the software sector
55
disagrees more often with the network statement and the new markets
statement than the other sectors. The impact of cooperation with knowledge
centers seems to hold more often for manufacturing firms in Korea.
From the results of the ecosystem impact on YICs, we see that Korean startups expect macroscopic and indirect impact of the ecosystem for upgrading
and developing the firm, especially in the growth phase. On the other hand,
Finland YICs expect microscopic and direct impact of ecosystem for
acquiring scare resources and competitive advantage, especially in the startup
phase. However, both Finland and Korean YICs want to conduct ambitious
projects by participating in ecosystems. We should carefully interpret these
results of ecosystem impact because the differences in the absolute values of
the ecosystem impact between Finland and Korea do not perfectly reflect the
gap in ecosystem performance between them.
-100%
Less extended network without
-80%
-60%
-40%
0%
92%
ecosystem
57%
75%
62%
80%
Slower progress without ecosystem
54%
Enter new markets
79%
43%
65%
Increase market share
49%
More ambitious projects
81%
69%
Collaborate with knowledge centres
37%
62%
67%
Not developing same skills without
ecosystem
48%
7%
0%
Note: Figure is based on the degree of agreement on nine statements (see left side figure)
that were self-assessed by the firms and that refer to the last 5 years. The original Likert
scale from 1 (totally disagree) to 7 (totally agree) was simplified into two categories (tend
to) disagree (1 to 3) and (tend to) agree (5 to 7).
Figure 6. Comparison of ecosystem impact on YICs between Finland and Korea
56
While the self-reported impact of ecosystem residency is overall positive, it
is of interest to compare the real performance between ecosystem residents
and other stand-alone firms. From Table A2, performance in terms of
employment, turnover, and profits does not show any strongly significant
differences14. However, in the case of Korean ecosystem residents seem to
be bigger than the stand-alone firms in the case of number of employees.
This evidence points to the existence of non-linearities in the relationship
ecosystem residence and its impact. In this context, there are four types of
firms: firms that do not want to belong to an ecosystem because they
perform better alone, firms that do not want to belong to an ecosystem but
that actually could perform better by belonging to one, firms that belong to
an ecosystem and that do well as a result, and firms that belong to an
ecosystem but that should not as it harms them. Further analysis with panel
data is needed to examine the exact effects of participating in an ecosystem
on a firm’s real performance.
8. Contribution and diversity of board of directors
Issues on corporate governance concerning top management teams, the
board of directors and the advisory board are important in the performance
of start-ups (Daily, McDougall, Covin, & Dalton, 2002; Knockaert &
Ucbasaran, 2013; Kor & Sundaramurthy, 2009). However, there is limited
literature on the relationship between board composition, board
performance, and ecosystems. In this section, focusing on the diversity and
the service performance of the board and board members, we provide
comparative results of Finland and Korean start-ups.
Over half of our Korean firms sampled do not have a board of directors
(57.1%) while most of Finland YICs have their own boards (97.1%). On
average, there are more people in the top management team and the board of
directors of Finland YICs (3.2 and 3.4 people respectively) than of Korean
YICs (2.4 and 2.8 people respectively). On the other hand, the average
number of inside board members for Korean firms (2.5 people) is greater
than for Finland firms (2.2 people).
The share of firms whose most important organizations in the ecosystem
are represented on the board is roughly one third of the firms in sample
(36.7% in Korea and 31.3% in Finland). However, there are clear
differences between the ICT firms and the manufacturing firms in Korea
(25.0% vs. 42.9%) and Finland (32.1% vs. 25.7%).
14
Note that the performance indicator data are not available for all firms in sample. In the case of employment,
data are available for 39% of all firms in Korea and 50% of the firms in Finland. Therefore, these results should
be interpreted with care.
57
Comparative results on the service performance of the board of directors
turn out to be different to those on the impact of the ecosystem. In other
words, Korean YICs have a more positive view on the service performance
of the board compared to Finland YICs. We considered three factors for
measuring the contribution of the board of directors: enhancing company
reputation, establishing external contacts, and giving counsel and advice.
As shown in Figure 7, over 70% of Korean YICs are in favor of a good
evaluation of the service performance of their boards. In both countries, the
most important service role of the board of directors for YICs is giving
counsel and advice. By industry, there is a more positive view in the
contribution of the boards among manufacturing firms than ICT firms in
both countries. In addition, the boards of directors in the ICT sector score
lower on establishing company reputation than in the other sectors in Korea.
The board performances of firms in both countries are higher when
participating in starting a network than growing a network. During the
developmental phase of networks, the role of board members plays a more
important and pioneering role in constructing initial networks.
-100%
Establish company reputation
0%
63%
73%
Establish external contacts
63%
73%
Give counsel and advice
75%
77%
Note: Figure is based on the extent of performance on three statements (see left side figure)
that were self-assessed by the firms and that refer to the last 5 years. The original Likert
scale from 1 (very small extent) to 7 (very large extent) was simplified into two categories
(tend to) weak performance (1 to 3) and (tend to) strong performance (5 to 7).
Figure 7. Service performance of the board of directors in Finland and
Korean innovative start-ups
58
Even if Korean YICs have small-sized boards of directors led by CEOs, they
believe in and depend on the capabilities of their boards. This may be
caused by the tendency for Korean firms to trust people within their firms
over those from the outside. However, Finland firms are more open to
those from the outside (i.e., from the ecosystem) and try to find
opportunities for growth. In other words, Korean firms are more boarddependent (low level of cooperation), while Finland firms are more
ecosystem-dependent (high level of cooperation), as we found from the
results of participation in ecosystems.
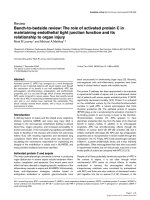
As shown in Figure 8, Korean YICs have a higher level of board diversity
than Finland YICs. The level of diversity of the board members measured
in terms of international experience is relatively low in Korean YICs. This
finding is consistent with the previous results that show lower levels of
international support for Korean YICs.
-100%
-80%
-60%
-40%
-20%
0%
20%
40%
60%
80%
100%
Functional background
53%
84%
40%
90%
1
Industrial foundation
47%
85%
Established experience
43%
59%
Made experience
38%
82%
International experience
40%
51%
Note: Figure is based on the degree of diversity on three statements (see left side figure) that
were self-assessed by the firms. The original Likert scale from 1 (very small degree of
diversity) to 7 (very large degree of diversity) was simplified into two categories (tend to)
smaller degree of diversity (1 to 3) and (tend to) greater degree of diversity (5 to 7).
Figure 8. Diversity of the Board of Directors in Finnish and Korean YICs
59
9. Conclusion
This study focuses on the role of innovation ecosystems for start-ups.
Through the parallel surveys for YICs in Finland and Korea, we examined
the rate of a firm’s participation in ecosystems (and networks), the impact of
the ecosystem on participating YICs, and the role of the boards of directors in
utilizing the ecosystem in terms of corporate governance.
The empirical results from the surveys show that Finland YICs participate
in ecosystems more actively than Korean YICs. In particular, considering
the portion of firms participating in multiple ecosystems, Finland firms have
more connected and complicated ecosystems than Korean firms. On the other
hand, no statistical difference in the rate of network participation was found
that could be explained by the fact that Korean YICs are more familiar with
the concept of networks rather than that of ecosystems.
Most YICs need the support of others for their survival and growth.
National subsidies are important for both Finland and Korean YICs. In
relative terms, there are more VC backed companies in Finland than in
Korea. Of further interest is that there is a much lower rate of dependence on
family and friends in Korea due to the fear of failure and self-sufficiency. In
addition, we found that Finland YICs more actively find supporting partners
(subsidies and VCs) from foreign countries, compared to Korean YICs. The
size of the domestic market, business environment, and geographical
location (Europe vs. Asia) might be reasons for the difference in the level of
dependence on international business partners between two countries.
In terms of the impact of an ecosystem, Finland YICs are more positive
than Korean YICs except for the impact of collaboration with universities
and research centers. Korean firms think that the ecosystem encourages
them to do more ambitious projects, to innovate better, and to collaborate
with knowledge centers while Finland firms report that the ecosystem
helps their activities that extend networks, pursue ambitious projects, grow
the firms faster, and enter new markets. These findings show that Korean
YICs expect macroscopic and indirect impacts from the ecosystem in the
growth phase of the firm’s development while Finland YICs expect
microscopic and direct impact of ecosystem in the startup phase. However,
from hard performance measures such as employment, turnover, and profits,
it is not clear if ecosystem residency is an advantage for the firms. Indeed,
firms that report not belonging to an ecosystem may either do better than
their ecosystem counterparts or worse but this would require further
research taking into account possible selection biases and non-linearities in
the relationships.
60
The results of the contribution and the diversity of the board of directors are
different from the results of the impact of an ecosystem. Even though over
half of Korean YICs do not have a board of directors, they have a more
positive view in the service performance of the board than Finland YICs. In
addition, Korean firms have a higher level of the diversity of board members
than Finland firms. A higher dependence on the board of directors in Korean
YICs is related to the tendency for Korean firms to trust people within their
firms over those from the outside. On the other hand, a higher dependence on
the ecosystem in Finland YICs is associated with the tendency of Finland
firms to try to find opportunities for growth from the outside.
From analysis of the empirical results, we find important policy
implications for developing the ecosystems of Finland and Korean YICs.
First, Finland YICs try to participate more actively in the ecosystem
involving international partners due to a relatively small-sized domestic
market and geographical characteristics. In Korea, even though there is a
low level of international relationships for start-ups due to a larger domestic
market, international networks play an important role for large firms, which
consider the expansion of target markets.
In terms of ecosystem participation, a higher level of firm participation in
multiple networks in Finland shows that Finland start-ups can acquire
resources and capabilities for early-stage growth through various
collaborative relations (broad network with weak ties). On the other hand,
Korean YICs want to build strong relationships with certain powerful
partners within the ecosystem for late-stage growth (narrow network with
strong ties). This explanation is consistent with the fact that Korean YICs are
older than Finland YICs in our sample.
There are also country differences in terms of the impact of ecosystem.
Finland YICs focus on the acceleration of firm growth by acquiring scarce
resources and capabilities, and Korean YICs high-light securing the outputs
of their innovation activities and growth engines. Therefore, the ecosystems
serve different purposes in Finland and in Korea. The ecosystem in Finland
is more helpful in marketing and strategic alliances. For Korean firms,
participating in the ecosystem can contribute to collaborative R&D
activities for development of products and future technologies.
A higher dependence on the board of directors among Korean YICs is
closely related to the responsibility for the growth and survival of the firms.
The CEOs of Korean YICs have confidence in internal resources and
personnel. On the other hand, Finland YICs find opportunity for growth by
finding the right balance point within the ecosystem rather than depending
on their internal board members.
61
From the findings presented above, the government of Finland and Korea
should build policies for supporting the relative ecosystems for YICs based
on the differences in ecosystem participation and the impacts of the
ecosystems. The Finland government should support an ecosystem for YICs
that pursue relatively long-term collaborative relationships among players
within the ecosystem for their innovation and survival. In addition, Finland
firms should trust the service roles of the boards and build strategies for
growth utilizing their advisory boards.
In Korea, YICs should understand the role of ecosystems in the growth
and survival of start-ups in the early-stage of firm development. They
should also find solutions for obtaining effective and efficient outcomes
through weak ties with various partners within the ecosystem. In addition,
the Korean government should promote the globalization of start-ups in the
early-stage by supporting activities and programs for entering foreign
markets and for making partnerships with international players for funding
and other operational purposes./.
REFERENCES
1.
Acs, Z., Szerb, L. & Autio, E. 2014. Global Entrepreneurship Index 2015. Washington,
D. C.: The Global Entrepreneurship and Development Institute (GEDI).
2.
Adner, R. 2012. “The wide lens: What successful innovators see that others miss”.
New York, NY: Portfolio/Penguin Adner, R., and Kapoor, R. 2010. Value creation in
innovation ecosystems: How the structure of technological interdepen- dence affects
firm performance in technology generations. Strategic Management Journal, 31(3),
306-333.
3.
Autio, E., Kenny, M., Mustar, P., Siegel, D., and Wright, M. 2014. “Entrepreneurial
innovation: The importance of context”. Research Policy, 43(7), 1097-1108.
4.
Autio, E., & Thomas, L. D. W. 2013. Innovation ecosystems - Implications for
innovation management? In M. Dodgson, D. Gann, & N. Phillips (Eds.), The Oxford
handbook of innovation management (pp. 204-228). Oxford, UK: Oxford University
Press. DOI: 10.1093/oxfordhb/9780199694945.001.0001.
5.
Ceccagnoli, M., Forman, C., Huang, P., & Wu, D. J. 2012. “Co-creation of value in a
platform ecosystem: The case of enterprise software”. MIS Quarterly, 36(1), 263-290.
6.
Clarysse, B., Wright, M., Bruneel, J., & Mahajan, A. 2014. “Creating value in
ecosystems: Crossing the chasm between knowledge and business ecosystems”.
Research Policy, 43(7), 1164-1176.
7.
Daily, C. M., McDougall, P. P., Covin, J. G., & Dalton D. R. 2002. “Governance and
strategic leadership in entrepreneurial firms”. Journal of Management, 28(3), 387412.
8.
Deschryvere, M., Lehenkari, J., Oksanen, J., Rilla, N., & Still, K. 2015. Impact of
ecosystems: Key results of the Finnish Entergrow survey (Policy Brief: Ekosysteemit
62
2015/4, TEKES). Retrieved from < />9.
Dutta, S., Lanvin, B., & Wunsch-Vincent, S. 2015. The global innovation index 2015:
Effective
innovation
policies
for
development.
Retrieved
from
< 2015-v5.pdf>
10. Eisenmann, T. R., Parker, G., & van Alstyne, M. W. 2009. Opening platforms: How,
when and why? In A. Gawer (Ed.), Platforms, markets and innovation (pp. 131-162).
Northampton, MA: Edward Elgar.
11. Falk, R. 2007. “Measuring the effects of public support schemes on firms’ innovation
activities: Survey evidence from Austria”. Research Policy, 36(5), 665-679.
12. Gawer, A., & Cusumano, M. A. 2014. “Industry platforms and ecosystem
innovation”. Journal of Product Innovation Management, 31(3), 417-433.
13. Iansiti, M., & Levien, R. 2004. “Strategy as ecology”. Harvard Business Review,
43(3), 51-58.
14. Jorma Ollila: Suomi on kuilun partaalla. 2016. Helsingin Sanomat. Retrieved from
< joitukset/a1451620055585>
15. Knockaert, M., & Ucbasaran, D. 2013. “The service role of outside boards in high
tech startups: A resource dependency perspective”. British Journal of Management,
24(1), 69-84.
16. Kor, Y. Y., & Sundaramurthy, C. 2009. “Experience-based human capital and social
capital of outside directors”. Journal of Management, 35(4), 981-1006.
17. Kosonen, M. 2016. Finland needs a strategic growth policy! SITRA Blog. Retrieved
from < />18. Li, J. F., and Garnsey, E. 2014. “Policy-driven ecosystems for new vaccine
development”. Technovation, 34(12), 762-772.
19. Moore, J. 1993. “Predators and prey: The new ecology of competition”. Harvard
Business Review, 71(3), 75-83.
20. Nambisan, S., & Baron, R. A. 2013. “Entrepreneurship in innovation ecosystems:
entrepreneurs’ self-regulatory processes and their implications for new venture
success”. Entrepreneurship Theory and Practice, 37(5), 1071-1097.
21. Palmberg, C. 2015. Finnish innovation policy and the role of Tekes - some trends and
challenges.
Globelics
Acedemy
2015.
Retrieved
from
< />22. Research and Innovation Policy Council. 2014. Reformative Finland: Research and
innovation policy review 2015-2020. Retrieved from < />sites/default/OPM/Tiede/tutkimus_ja_innovaationeuvosto/julkaisut/liitteet/
Review2015_2020.pdf>
23. Tencati, A., & Zsolnai, L. 2009. “The collaborative enterprise”. Journal of Business
Ethics, 85(3), 367-376.
24. Tukiainen, T., Lindell, M., & Burström, T. 2014. Finnish startups in globally
evolving ecosystems: Value for Finland. Helsinki, Finland: Hanken.
63
APPENDIX
Table A1. Descriptive statistics of the Korean (ROK) and Finland (FI)
samples based on the survey data and two tailed T-tests in means
Total
sample
S.D.
ROK
FI
Signif.
sample sample
CEO has founded company (dummy)
CEO’s years of experience in the sector (5 categories)
0.6998 0.0223 0.375 0.9498
3.1722 0.0688 3.5380 2.8917
***
***
Firm development phase (4 phases)
Current public research support receiver
Current national VC support receiver
Current international VC support receiver
Current family and friends support receiver
Current national subsidies support receiver
Current international subsidies support receiver
Current accelerator and incubator support receiver
Current support receiver: Missing data
Firm belongs to network (dummy)
Networks development phase (4 phases)
Sharing knowledge and skills in networks (dummy)
Common targets
1.7901
0.2241
0.2241
0.0425
0.217
0.6156
0.0425
0.0613
0.1486
0.5354
2.1233
0.9207
0.7489
0.0321
0.0203
0.0203
0.0098
0.02
0.0237
0.0098
0.0117
0.0173
0.0242
0.0707
0.0180
0.0228
1.8750
0.1522
0.0815
0.0054
0.0326
0.5489
0.0054
0.0435
0.3315
0.5109
1.9255
0.8723
0.7447
1.7250
0.2792
0.3333
0.0708
0.3583
0.6667
0.0708
0.075
0.0083
0.5542
2.2632
0.9549
0.7519
**
***
***
***
***
**
***
‘
***
Belongs to at least one ecosystem (dummy)
Belongs to an ecosystem: 1 One 2 Multiple 3 None
Ecosystem impact: Less extended network without
Ecosystem impact: Innovate better (from strongly
Ecosystem impact: Slower progress without ecosystem
Ecosystem impact: Enter new domestic and/or foreign
Ecosystem impact: Increase market share
Ecosystem impact: Engage in more ambitious projects
Ecosystem impact: Collaborate with knowledge centres
Ecosystem impact: Not developing same level of skills
Ecosystem impact: Limited the growth of the company
0.4837
2.2146
5.5744
5.095
5.2305
5.0628
4.8390
5.2934
4.0333
4.7137
1.7984
0.0240
0.038
0.0967
0.0994
0.1029
0.1124
0.1052
0.0969
0.1362
0.115
0.0734
0.4837
2.3261
4.6966
4.8202
4.6404
4.2360
4.3371
4.9213
4.7303
4.3820
2.0674
0.6417
2.1292
6.085
5.2549
5.5714
5.5533
5.1429
5.5098
3.6225
4.9079
1.6429
***
**
***
**
***
***
***
***
***
**
***
Number of people in Top Management Team (TMT)
Having a Board of Directors (dummy)
Size of the Board of Directors
2.8670 0.0666 2.4011 3.2455
0.7358 0.0214 0.4293 0.9708
3.2581 0.0766 2.8101 3.4113
***
***
***
**
**
64
Number of inside board members in BOD
Number of outside board members in BOD
Most important organisations of ecosystem are
Board of Directors Performance (from 1 (bad) to
Board of Directors Performance: Establish company
Board of Directors Performance: Establish external
Board of Directors Performance: Give counsel and
Board of Directors Diversity (from 1 (small) to 7
Board of Directors Diversity: Functional background
Board of Directors Diversity: Education
Board of Directors Diversity: Industry background
Board of Directors Diversity: Founding experience
Board of Directors Diversity: Executive experience
Board of Directors Diversity: International
Total
sample
T l
2.3087
0.8919
0.3305
0.063 2.4810 2.2466
0.0742 0.3291 1.0968
0.0305 0.3671 0.3125
*
***
4.9497
4.9831
5.4803
0.107 5.4051 4.7854
0.1044 5.3038 4.8664
0.0936 5.4937 5.4750
***
**
4.7980
4.3636
4.6879
4.1604
4.2718
4.0537
0.102
0.1116
0.11
0.1103
0.1053
0.1079
***
***
***
***
***
+
S.D.
ROK
FI
Signif.
sample sample
5.7722
5.9367
5.7975
4.7089
5.5696
4.3418
4.4450
3.7936
4.2877
3.9579
3.8037
3.9498
Having an Advisory Board (ADVB) (dummy)
0.1934 0.0192 0.163 0.2167
Statistical significance: *** p<0.01, ** p<0.05, * p<0.10, + p<0.15, ‘ p<0.20.
‘
65
Table A2. Two tailed T-test results comparing the means of the ecosystem
firms with the stand alone firms in Finland and Korea
FINLAND (N=240)
KOREA (N=184)
No
No
Ecosystem
Ecosystem
Ecosystem Signif.
Ecosystem Signif.
Mean
Mean
Mean
Mean
FIRM PERFORMANCE
Number of employees
54.9459
13.1087
Operating revenue (Turnover)
8317.1961 1281.5000
‘
(thousand EUR)
Profits/Losses for period [=Net
270.7086 -53.1429
income] (thousand EUR)
Total assets (last year) (thousand 3958.7351 904.5595
EUR)
SUPPORT
Current public research support
0.3377
0.1744
***
receiver
Current national VC support
0.3701
0.2674
*
receiver
Current family and friends support
0.3896
0.3023
‘
receiver
Current national subsidies support
0.6883
0.6279
receiver
Current international subsidies
0.0974
0.0233
**
support receiver
Current accelerator and incubator
0.0779
0.0698
support receiver
STRATEGY
Sharing knowledge and skills in
0.8741
0.5890
***
networks
Firm reports to have targets
0.6986
0.2338
***
BACKGROUND CEO (RESPONDENT)
CEO has founded company
0.9346
0.9767
+
CEO’s years of experience in the
2.9870
2.7209
+
sector
CORPORATE GOVERNANCE
Number of people in Top
3.3851
2.9737
**
Number of people in the Board of
3.5298
3.1875
*
Directors
Board of Directors Performance (from small to big extent):
Establish company reputation
4.9577
4.4675
*
Establish external contacts
4.9716
4.6711
Give counsel and advice
5.6567
5.1061
*
21.6857
10.4324
1997.4643 3520.5571
-19.2857
91.0571
*
‘
2058.8596 2096.6714
0.2472
0.0632
***
0.1011
0.0632
0.0562
0.0105
*
0.6629
0.4421
***
0.0000
0.0105
0.0787
0.0105
**
0.9254
0.7407
**
0.7761
0.6667
0.3034
3.3596
0.4421
3.7053
*
*
2.5730
2.8000
2.2366
2.8235
**
5.4667
5.4444
5.4444
5.3235
5.1176
5.5588
66
Board of Directors Diversity (small degree 1 to high degree 7):
Functional background
4.5915
4.1711
+
Education
3.9930
3.4211
**
Industry background
4.5245
3.8421
**
Founding experience
4.0500
3.7838
Executive experience
3.8112
3.7895
International experience
3.9930
3.8684
Firm has an external advisory
0.2468
0.1628
+
board (AB)
Importance of AB compared to
BOD: for company reputation (1
4.1351
3.7143
(7): AB (BOD) outperformed BOD
(AB))
Importance of AB compared to
BOD: for advice (1 (7): AB (BOD) 3.6486
2.5385
**
outperformed BOD (AB))
5.6667
5.9556
5.7556
4.1778
5.1556
4.0444
0.2472
5.9118
5.9118
5.8529
5.4118
6.1176
4.7353
0.0842
5.0909
5.6250
5.3182
5.8750
Statistical significance: *** p<0.01, ** p<0.05, * p<0.10, + p<0.15, ‘ p<0.20.
***
***
*
***
67
Table A3. Descriptive statistics of the ICT sector sub-samples based on two
tailed T-tests in means
ICT sector
KOREA
(N=50)
Mean
PERFORMANCE
Number of employees
9.9048
Operating revenue (Turnover) (thousand EUR)
859.4688
Profits/Losses for period [=Net income]
19.0323
Total assets (last year) (thousand EUR)
709.5000
SUPPORT
Current national VC support receiver
0.1400
Current international VC support receiver
0.0200
Current family and friends support receiver
0.0400
Current international subsidies support receiver
0.0000
STRATEGY
Firm reports to have targets
0.7333
Belongs to at least one ecosystem
0.5200
ECOSYSTEM IMPACT (1: disagree fully, 7: agree fully)
Less extended network without ecosystem
4.2692
Innovate better
4.5385
Slower progress without ecosystem
4.1154
Enter new domestic and/or foreign markets
3.6154
Increase market share
4.1923
Engage in more ambitious projects
4.5769
Collaborate with knowledge centres
4.1538
Not developing same level of skills without
4.2692
Limited the growth of the company
2.4615
CORPORATE GOVERNANCE
Firm has an external Advisory Board
0.1400
FINLAND
(N=87)
Mean
Signif.
5.8947
363.1149
-135.7791
398.2907
**
***
**
+
0.3333
0.0805
0.4023
0.0460
***
*
***
**
0.4405
0.6207
***
5.8889
4.8679
5.3519
5.5185
5.1132
5.1887
3.1569
4.3962
1.7222
***
0.2529
+
***
***
**
+
**
***
Statistical significance: *** p<0.01, ** p<0.05, * p<0.10, + p<0.15, ‘ p<0.20.