Application of empirical bayesian estimation to the optimal decision of a server-dependent queuing system
Bạn đang xem bản rút gọn của tài liệu. Xem và tải ngay bản đầy đủ của tài liệu tại đây (271.82 KB, 17 trang )
Yugoslav Journal of Operations Research
15 (2005), Number 2, 191-207
APPLICATION OF EMPIRICAL BAYESIAN ESTIMATION
TO THE OPTIMAL DECISION OF A SERVER-DEPENDENT
QUEUING SYSTEM
Pei-Chun LIN
Department of Transportation and Communication Management Science
National Cheng Kung University
Taiwan, R.O.C.
Received: November 2003 / Accepted: October 2004
Abstract: This paper presents a decision model that uses empirical Bayesian estimation
to construct a server-dependent M/M/2/L queuing system. A Markovian queue with a
number of servers depending upon queue length with finite capacity is discussed. This
study uses the number of customers for initiating and turning off the second server as
decision variables to formulate the expected cost minimization model. In order to
conform to the reality, we first collect data of interarrival time and service time by
observing a queuing system, then apply the empirical Bayesian method to estimate its
traffic intensity. In this research, traffic intensity is used to represent the demand for
service facilities. The system initiates another server whenever the number of customers
in the system reaches a certain length N and removes the second server as soon as the
number of customers in system reduces to Q. Associating the costs with the opening of
the second server and the waiting cost of customers, a relationship is developed to obtain
the optimal value of N and Q to minimize cost. The mean number of customers in the
system and the queue length of customers are derived as the characteristic values of the
system. Model development and the implications of the data are discussed in detail.
Keyword: Empirical Bayesian estimation, server-dependent queuing system, traffic intensity.
1. INTRODUCTION
The waiting line of service system is a widespread phenomenon. Customers
always wish not to have to wait and to receive service as soon as possible. As customers
put a higher value on their time, waiting is regards as a proportionally greater waste.
192
P.-C. Lin / Application of Empirical Bayesian Estimation to the Optimal Decision
Hence, managers face the challenge: how to reduce waiting time and achieve customer
satisfaction? In order to shorten the wait time, the number of servers must be increased,
which at the same time increases the cost of providing services. However, when the
demand declines, servers will be idle and resources are wasted, which incur unnecessary
cost. It is a critical issue for managers to decide how to allocate servers or resources in an
efficient way in order to reduce unnecessary facility cost, idle cost, the cost of losing
customers, and to meet the variation of demand.
For instance, the operations of Postal Remittances and Savings Banks (PRSB) in
Taiwan face fierce competition under the trends of financial liberalization and
internationalization. Customers not only focus on the quality of merchandise but also
emphasize the invisible service while making use of postal or financial services. In order
to provide better quality of service and reduce customers’ waiting time would increase
the cost of personnel. Decision makers face the dilemma of obtaining a balance point
between providing good quality of service and controlling costs to keep them reasonable.
Similarly, the speed of passengers go through an immigration terminal usually influences
the reputation of an airport. Travelers’ assessment mostly comes from their waiting time.
If managers are able to measure the gain and loss between customer waiting and facility
costs, it is possible to raise customers’ satisfaction and at the same time contain the costs
of doing so then they are successful at service facility requirement planning.
The main objective of this study was to establish an evaluation model as a
reference for service facility requirement planning. In daily life, it is common to meet all
sorts of queues for service, such as the queue for tickets at a cinema, queues of cars
waiting to be filled up at a gas station, or even the transfer of network image – all these
are situations for the implementation of queuing theory. The number and allocation of
servers serving the queue is a problem of service facility requirement planning. In the
practical procedure of planning, decision makers may base their plain on the regular flow
rate of customers and the expected service rate, or their subjective judgment, to decide
the required amount of service requirement and the number of facilities or servers
needed. There is a need for an objective and effective model to aid managers to operate
systems optimally. This research wishes to implement the empirical Bayesian approach
to estimate the service requirement based on the actual operation of queuing. It then
constructs a server-dependent queuing system. The controllable system initiates another
server whenever the number of customers in system reaches a certain length and turns off
the second server whenever the number of customers in system reduces to a certain
length. The specific objectives of this research includes:
1. Consider the randomness of customer arrival and service time and incorporate
the empirical Bayesian approach to estimate the amount of service required.
2. Construct a server-dependent M/M/2/L queuing system. The system initiates
another server whenever the queue length in front of first server reaches a
certain length N and closes the second server whenever the queue length in front
of first server reduces to a certain length Q. To analyze the system
characteristics such as the expected number of customers in system, the
probability of server being idle, etc.
3. Use N and Q as decision variables to construct a model to minimize the
expected cost associated with the opening of the second server and the waiting
of customers.
P.-C. Lin / Application of Empirical Bayesian Estimation to the Optimal Decision
193
2. LITERATURE REVIEW
In this section we first explain the reason for using traffic intensity to define the
amount of service requirement, then organize how to apply the empirical Bayesian
approach to discover the estimator of traffic intensity. Finally we describe the system
characteristics and development of a server-dependent queuing system and discuss the
related references.
2.1. Traffic intensity vs. the amount of service required
The definition of traffic intensity ρ is the ratio of arrival rate over service rate.
It is an important reference of queuing system and represents the utilization or proportion
of the server being occupied. This study utilizes traffic intensity as the indication of the
amount of service required. The larger traffic intensity means a larger arrival rate or a
lower service rate. When ρ ≥ 1 , it means the arrival rate is at least equal to the service
rate but it can also exceed the service rate. Obviously a single server is unable to cope
with the amount of service requirement. After a period of time, the system will blow up
(Winston, 1994). Queues happen due to the uncertainty of the tempo at which customers
will be arriving and the variation of service time. There is no waiting time only when
customers arrive at a fixed interval and service time is a constant. In reality, customers
arrive at random intervals that are unknown in advance and so is the time needed to serve
a customer. In order to avoid the assumption that the arrival rate and the service rate as
known, this research applies the empirical Bayesian method to estimate the traffic
intensity of a queuing system, which can meet the actual randomness and uncertainty and
make the model proposed by this study be more reasonable.
2.2. Empirical Bayesian approach
The empirical Bayesian method is based upon a given prior distribution. When a
suitable amount of observation values is collected, the prior distribution is used to
calculate the posterior distribution. It also applies the concept of maximum likelihood to
obtain the estimation of parameters. This section first aims to differentiate the Bayesian
and empirical Bayesian methods of estimation, then discusses various methods of
statistical analysis for a queuing system, and finally investigates the advantages and
adaptability of empirical Bayesian estimation.
Suppose that X 1 ,… , X n are independent random variables, each having a
probability density function given by
n
g ( x1 , x 2 ...... x n θ ) = Π f ( x i θ ) if X i = xi , i = 1,… , n (prior distribution)
i =1
where θ is unknown. Further, suppose that θ has the density function p (θ ) . The joint
distribution of x1, x2 ......xn and θ is
n
q( x1 , x2 ......xn , θ ) = g ( x1 , x2 ......xn θ ) p(θ ) = Π f ( xi θ ) p(θ )
i =1
194
P.-C. Lin / Application of Empirical Bayesian Estimation to the Optimal Decision
The marginal probability density of x1 , x2 ......xn is
k ( x1 , x2 ......xn ) = ∫ q ( x1 , x2 ......xn ) dθ
We have the conditional density of θ given X 1 ,… , X n is given by
h (θ x1 , x2 ......xn ) =
q ( x1 , x2 ......xn , θ )
(posterior density function)
k ( x1 , x2 ......xn )
Table 1 illustrates the difference between empirical Bayesian and Bayesian
methods in. It shows that the Bayesian method assumes the prior distribution and
parameters are known. For the empirical Bayesian method, the compound function of
prior distribution is designated such as the most common choice exponential distribution
in queuing theory, but the parameters ( θ ) are unknown.
Table 1: The difference between Bayesian and Empirical Bayesian
Method
Bayesian
Empirical
Bayesian
Prior
distribution
P (λ θ )
Known,
θ
known
P (λ θ )
Known,
θ
Posterior
distribution
P (λ X , θ ) ~ f ( X λ ) ⋅ P (λ θ )
P (λ X , θˆ) ~ f ( X λ ) ⋅ P (λ θˆ)
unknown
This research used traffic intensity as the indication of the amount of service
required. The accuracy of estimation has a major influence on the model of cost analysis
constructed subsequently. Mcgrath et al. (1987) applied a Bayesian approach to queuing
and pointed out the specification of uncertainty in the estimation of parameters.
Thiruvaiyaru et al. (1992) described the advantages of the empirical Bayesian approach
on parameter estimation in queuing systems and concluded that the empirical Bayesian
approach seeks to combine the logical advantages of the Bayesian techniques with the
objective practicality of the frequentist approach.
Other researches that implements empirical Bayesian approach include: Armeto
et al. (1994) who emphasized the Bayesian prediction in M/M/1 queues; Wiper (1998)
has implemented empirical Bayesian estimation to Erlang distribution; again Sohn (1996)
has concluded that the traffic intensity estimated by empirical Bayesian approach holds
the minimal mean square error.
2.3. Server-dependent queues
The major difference of a server-dependent queue from a general queuing
system is that the number of servers depends upon the queue length. It was first brought
to notice by Singh (1970) that a queuing system could operate in such a way that a new
service facility is provided whenever the queue in front of the server reaches a certain
P.-C. Lin / Application of Empirical Bayesian Estimation to the Optimal Decision
195
length. Garg et al. (1993) extended the concept and developed the queue M/M/2 with a
number of homogeneous or heterogeneous servers depending on the queue length. In a
two server heterogeneous system, the service rate for the first and the second server are
different. They also proposed the conditions for gaining the maximum profit – that the
second server should be applied at queue length N. Yamashiro (1996) revised the model
of Garg et al. (1993) and assumed that a queue with finite capacity is applicable
(M/M/2/L). Dai (1999) proposed the finite capacity M/M/3/L queuing system where the
number of servers changes depending on the queue length. Bansal et al. (1994) has
investigated the factors of cost for activating the second server.
Most of previous researches focused on turning on the second server when
queue length reached N. Some of them are set up so that the first server should not be
initiated until queue reach length N. Researchers such as Sapna (1996) analyzed the
optimal N value for activating the first server under Gamma distribution; Wang et al.
(1995) considered the server with unexpected failure to derive the non-reliable M/M/1/L
system; Wang et al. (15)[11] drew Erlang distribution into the non-reliable server in a
finite and infinite M/H2/1 queuing system. Hsie (1993) took into account that for a M/M/1
system, when there is no one to serve, the server would be turned off to reduce idling
cost. The above studies all used the optimal queue length N as the decision variable – to
decide when to turn on the first server, and constructed the objective function for the
minimum expected cost.
Wang et al. (1999) and Dai (1999) added cost in the objective function. This
research quantifies customers’ waiting cost and considers the cost of activating the
second server, and its idle cost to build the model of minimum expected cost. Yamashiro
(1996), Wang et al. (1995), Garg et al. (1993) and Dai (1999) didn’t describe how to
acquire the traffic intensity ρ . This study estimates ρ by the empirical Bayesian
approach. Besides, in order to fit the most conditions, we set up a system where the first
server is always operating. This study also brings in Wang’s (2000) idea and treats the
queue length for turning off the second server, as a decision variable.
3. RESEARCH METHOD
This paper applies the empirical Bayesian approach to estimate the demand for
service and constructs a server-dependent queuing system, then employs the queue length
for activating and closing the second server as decision variables to construct the model
of minimum expected cost for a decision maker. In part one we used simulation to
produce numerical data or we collect observational data and referred the traffic intensity
estimated by the empirical Bayesian approach proposed by Thiruvaiyaru (1992) to
indicate of the required amount of service. Next, we derived the probabilities of each
state for a M/M/2/L server-dependent queuing system. Finally, we add in the parameters
of cost and combine the first two parts to solve the optimal queue length N for starting a
second server and the optimal queue length Q for turning off the second server. We first
introduced the method to apply the empirical Bayesian approach and obtain observational
data to generate the estimation of traffic intensity.
196
P.-C. Lin / Application of Empirical Bayesian Estimation to the Optimal Decision
3.1. Empirical Bayesian estimator of traffic intensity
Thiruvaiyaru (1992) supposed there are H independent M/M/1 queues in which
the interarrival times { U ik , i = 1,..., n } of the first n customer, and the service times
{ V jk , j = 1, ..., m } of the first m customers are observed for k = 1,..., H . Given the arrival
rate λk , { U ik , k = 1,..., H } are i.i.d exponential ( λk ) random variables; that is
n
fU k (u k λ k ) = λkn exp{− λk Σuik }
i =1
where
U k = (U ik , i = 1,..., n)′
Also, given the service rate μk , {V jk , j = 1,..., m} are i.i.d. exponential ( μk ) random
variables; that is,
m
f Vk (vk μ k ) = μkm exp{− μk Σv jk }
j =1
where
Vk = (V jk , j = 1,..., m)′
The arrival rates {λ1 ,..., λN } are assumed to be i.i.d. Gamma (α1 , β1 ) (prior distribution)
and the service rates {μ1 ,..., μk } are assumed to be i.i.d. Gamma (α 2 , β 2 ) (prior
distribution). Also, the two sequences {λ1 ,..., λN } and {μ1 ,..., μk } are assumed to be
independent of each other. The empirical Bayesian estimator is derived as
ρˆ EB =
m
( n + αˆ1 )(Σ j =1V j + βˆ2 )
n
(m + αˆ 2 − 1)(Σ i =1U i + βˆ1 )
where αˆ1 , αˆ 2 , βˆ1 , βˆ2 are the one-step maximum likelihood estimators of α1 , α 2 , β1 , β 2 ,
respectively. First, let ηˆ = (αˆ , βˆ )′ , l = 1, 2 be the one-step Maximum likelihood
l
l
l
H n
U ik
U2
and m21 = ΣΣ ik ,
k =1i =1 Hn
k =1i =1 Hn
H n
estimators of ηl = (α l , βl )′, l = 1, 2 , respectively. Let m11 = ΣΣ
we can calculate m11 = β1 (α1 − 1)
estimators (α1 , β1 ) of α1 , β1 are
α1 = 2(m21 − m112 ) m21 − 2m112 )
β1 = m11m21 (m21 − 2m112 )
and m21 = 2β12 (α1 − 1)(α1 − 2) . The moment
P.-C. Lin / Application of Empirical Bayesian Estimation to the Optimal Decision
197
Again, let m12 = Σ k =1Σ j =1V jk ( Hm) and m22 = Σ k =1Σ j =1V jk2 ( Hm) , we obtain the
H
H
m
m
moment estimator of (α 2 , β 2 ) :
α 2 = 2(m22 − m122 ) (m22 − 2m122 )
β 2 = m22 m12 (m22 − 2m122 )
Then, the one-step maximum likelihood estimators of ηl = (α l , β l )′ , l = 1, 2 are given by
ηˆ l = ηl − Wl −1 ( η) ⋅ Sl ( η) , l = 1, 2
where the marginal likelihood function is
H
L = f ( x1 ,..., xn ) = Π f ( U k ) f ( Vk )
k =1
H ⎡
βα1
β2α2
Γ(α + n)
Γ(α2 + m) ⎤
⎥
= Π⎢ 1 ⋅ n 1
⋅
⋅
m
m+α2
α1 +n Γ(α )
k =1 ⎢ Γ(α1 ) (
u
v
β
)
(
β
)
+
+
2
Σi=1 ik 1
Σj=1 jk 2 ⎥⎦
⎣
and
ηl = (α l , β l )′ , l = 1, 2
and
′
⎡ ∂ ln L ∂ ln L ⎤
Sl ( η) = ⎢
,
, l = 1, 2
⎥
∂β l ⎦
⎣ ∂α1
ηl =ηl
and
⎡ ∂ 2 ln L
⎢
∂α l2
Wl ( η) = ⎢ 2
⎢ ∂ ln L
⎢
⎣⎢ ∂α l ∂β l
∂ 2 ln L ⎤
⎥
∂α l ∂βl ⎥
, l = 1, 2
∂ 2 ln L ⎥
⎥
∂βl2 ⎦⎥η =η
l
l
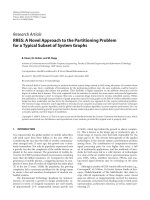
3.2. Server-dependent M/M/2/L queuing system
The major objective of this section is to establish a server-dependent M/M/2/L
queuing system with finite capacity L. This system has been set up so that the first server
is always on. When the number of customers in the system reaches N, the second sever
would be activated to release the congestion in the system; when the number of
customers in systems reduces to Q, it signifies the status of overcrowding has ceased so
we can turn off the second server to cut cost. The number of waiting line is only one as
shown in Figure 1.
198
P.-C. Lin / Application of Empirical Bayesian Estimation to the Optimal Decision
STATUS OF SERVER
NUMBER OF CUSTOMERS IN SYSTEM
Server 1 is always on
Server
1
On
When number of customer in system
reaches N, turn on server 2
0
1
2
Q
Q+1
N-1
N
N+1
L-1
L
On
Server
2
Off
The decision variable for
turning off the second server
The decision variable for
turning on the second server
The maximum capacity
of system
When number of customer in system
reduces to Q, turn off server 2
Figure 1: Server-dependent queuing system with single waiting line
The assumptions, parameters and variables used in the model are defined as follows:
Assumptions:
1.
2.
3.
4.
5.
6.
7.
The service rule is FCFS.
The interarrival time of customers is assumed to be exponential distribution with
unknown parameters.
The service time for each customer is assumed to be exponential distribution
with unknown parameters.
The service system could provide two servers at most, but at least one server
should remain on to serve customers.
The system has finite capacity L and L>>N.
The service rates of two servers are identical.
1< ρ < 2.
Definition of symbols
1. λ : arrival rate of customers
2. μ : service rate of server
3. ρ : traffic intensity =
4. i :
5. j :
λ
μ
number of servers in service, i = 1, 2
number of customers in system, j = 0...L
6. P (1, j ) : the steady-state probability of only one server is providing service as the
number of customers in system is j , where j = 0,1, 2,..., Q, Q + 1,..., N − 1
7. P (2, j ) : the steady-state probability of two servers are both providing service as the
number of customers in system is j , where j = Q + 1, Q + 2,..., N , N + 1,...L − 1, L
199
P.-C. Lin / Application of Empirical Bayesian Estimation to the Optimal Decision
Based upon the above assumptions and symbols, this research constructed a
server-dependent M/M/2/L system. The rate diagram of birth and death process is shown
as Figure 2 and the flow balance equations are as follows:
Number of customers in system (j)
0
Q -1
Number of server in service
λ
i=1
0
λ
1
μ
λ
2
μ
λ
3
μ
Q
λ
4
μ
Q
-1
Q+1
λ
Q
μ
λ
Q
+1
μ
N
N-1
λ
Q
+2
λ
Q
+3
μ
μ
λ
Q
+4
μ
λ
Q
+5
μ
λ
N
-3
N
-4
μ
N+1
L -1
L
λ
N
-2
μ
N
-1
μ
λ
2μ
λ
i=2
Q
+1
λ
Q
+2
2μ
λ
Q
+3
2μ
λ
Q
+4
2μ
λ
Q
+5
2μ
N
-4
λ
N
-3
2μ
λ
N
-2
2μ
λ
N
-1
2μ
λ
N
+1
N
2μ
λ
2μ
λ
N
+2
L
-2
2μ
λ
L
-1
2μ
L
2μ
Figure 2: Rate diagram for M/M/2/L queuing system
λ P (1, 0) = μ P (1,1)
(λ + μ ) P (1, j ) = λ P (1, j − 1) + μ P (1, j + 1)
where 1 ≤ j ≤ Q − 1
(λ + μ ) P (1, Q ) = λ P(1, Q − 1) + μ P (1, Q + 1) + 2μ P (2, Q + 1)
(λ + μ ) P (1, j ) = λ P (1, j − 1) + μ P (1, j + 1)
where Q + 1 ≤ j ≤ N − 2
(λ + μ ) P (1, N − 1) = λ P (1, N − 2)
(λ + 2 μ ) P (2, Q + 1) = 2 μ P(2, Q + 2)
(λ + 2 μ ) P (2, j ) = λ P (2, j − 1) + 2 μ P (2, j + 1)
where Q + 2 ≤ j ≤ N − 1
(λ + 2 μ ) P (2, N ) = λ P (2, N − 1) + 2 μ P(2, N + 1) + λ P (1, N − 1)
(λ + 2 μ ) P (2, j ) = λ P (2, j − 1) + 2 μ P (2, j + 1)
where N + 1 ≤ j ≤ L − 1
λ P (2, L − 1) = 2μ P (2, L)
To solve the above birth-death flow balance equations, we begin by expressing all the
P (1, j ) ’s and P (2, j ) ’s in terms of P (1, 0) .
1. i = 1 (only one server is providing service)
P (1, j ) = P (1, 0) , j = 0
P (1, j ) = ρ j ⋅ P (1, 0)¡ , 1 ≤ j ≤ Q
P(1, j ) =
ρ ⋅ ( ρ j −1 − ρ N −1 )
⋅ P(1, 0)¡ , Q + 1 ≤ j ≤ N − 1
(1 − ρ N −Q )
(1)
(2)
200
P.-C. Lin / Application of Empirical Bayesian Estimation to the Optimal Decision
2. i = 2 (two servers both provide service)
P(2, j ) =
P (2, j ) =
ρ
ρ N ⋅ (1 − ρ ) ⋅ [1 − ( ) j −Q ]
2
(2 − ρ ) ⋅ (1 − ρ N −Q )
⋅ P(1, 0)¡ , Q + 1 ≤ j ≤ N
ρ
ρ
ρ N ⋅ (1 − ρ ) ⋅ [1 − ( ) N −Q ] ⋅ ( ) j − N
2
2
(2 − ρ ) ⋅ (1 − ρ N −Q )
(3)
⋅ P (1, 0)¡ , N + 1 ≤ j ≤ L
(4)
3. The steady-state probabilities must sum to 1
2
L
P(i, j ) = 1
ΣΣ
i =1 j = 0
(5)
Substituting (1), (2), (3), and (4) into (5) yields
Q
ρ ⋅ ( ρ j −1 − ρ N −1 )
Σ (1 − ρ N −Q ) ⋅ P(1, 0)
j = Q +1
ρ
ρ N ⋅ (1 − ρ ) ⋅ [1 − ( ) j −Q ]
j
Σ ρ ⋅ P(1, 0) +
j =0
+
+
N
Σ
j = Q +1
L
Σ
j = N +1
N −1
(2 − ρ ) ⋅ (1 − ρ
2
N −Q
)
⋅ P (1, 0)
ρ
ρ
ρ N ⋅ (1 − ρ ) ⋅ [1 − ( ) N −Q ] ⋅ ( ) j − N
2
2
(2 − ρ ) ⋅ (1 − ρ N −Q )
⋅ P (1, 0) = 1
Thus
ρ
ρ
⎧
⎫
ρ N ⋅ {(2 − ρ ) ⋅ ( N − Q) + ρ ⋅ (1 − ρ ) ⋅ ( ) L − N ⋅ [1 − ( ) N −Q ]} ⎪
⎪⎪ 1
⎪
2
2
P(1, 0) ⋅ ⎨
−
⎬ =1
N −Q
2
ρ
−
1
ρ
ρ
−
⋅
−
(2
)
(1
)
⎪
⎪
⎪⎩
⎪⎭
We can solve for P (1, 0) , which is the steady-state probability of no customer in the
system:
−1
ρ
ρ
⎧
⎫
ρ N ⋅ {(2 − ρ ) ⋅ ( N − Q) + ρ ⋅ (1 − ρ ) ⋅ ( ) L − N ⋅ [1 − ( ) N −Q ]} ⎪
⎪⎪ 1
⎪
2
2
P(1, 0) = ⎨
−
⎬ (6)
2
N −Q
ρ
1
−
ρ
ρ
(2
)
(1
)
−
⋅
−
⎪
⎪
⎩⎪
⎭⎪
Then (6) can be used to determine P (1, j ) , P ( 2, j ) . Each of them is a function
of traffic intensity ρ , and the decision variables N, Q. Now we can incorporate the
parameters of costs and formulate an NLP to minimize the sum of expected costs due to
customer waiting and server operating.
P.-C. Lin / Application of Empirical Bayesian Estimation to the Optimal Decision
201
Formulation of objective function
Next we construct an objective function of minimizing expected cost for the
M/M/2/L controllable queuing system. The definitions of parameters are as follows:
Ec : expected cost
Cs : the fulltime operating cost for second server
Ci : the fulltime idle cost for second server
CL : the penalty cost for system being fully loaded
Ce : the penalty cost for system being empty
Con : the start up cost for turning the second server on back and forth
Coff : the shut down cost for turning the second server off back and forth
C w : the average waiting cost for each customer (we assume the expected
waiting cost is proportional to the queue length)
The expected cost function is given by
L
Ec( N , Q ρ ) = Cs ⋅ Σ P(2, j )
Q +1
N −1
+Cw ⋅ Σ Max[0, ( j − 1)] ⋅ P (1, j )
j =0
+ Cw ⋅
L
Σ Max[0, ( j − 2)] ⋅ P(2, j )
j = Q +1
(7)
N −1
+Ci ⋅ Σ P(1, j )
j =0
+Con ⋅ P (2, N )
+Coff ⋅ P (1, Q)
+Ce ⋅ P(1, 0)
+CL ⋅ P (2, L)
Next substituting i = 1 into (1) and (2) yields the sum of probability of one server
( P (1, j ) , j = 0,… , Q,… , N − 1 ) in system:
N −1
Q
j =0
j =0
N −1
Q
j = Q +1
j =0
Σ P(1, j) = Σ P(1, j) + Σ P(1, j ) = [ Σ ρ
j
⋅+
ρ ⋅ ( ρ j −1 − ρ N −1 )
] ⋅ P(1, 0)
(1 − ρ N −Q )
j = Q +1
N −1
Σ
where
Q
j
Σ ρ ⋅ P(1, 0) =
j =0
N −1
Σ
j = Q +1
ρ Q +1 − 1
⋅ P(1, 0)
ρ −1
ρ ⋅ ( ρ j −1 − ρ N −1 )
[( N − Q − 1) ⋅ ρ Q + N +1 + (Q − N ) ⋅ ρ Q + N + ρ 2Q +1 ]
⋅ P(1, 0) =
⋅ P(1, 0)
N −Q
(1 − ρ
)
( ρ − 1)( ρ N − ρ Q )
202
P.-C. Lin / Application of Empirical Bayesian Estimation to the Optimal Decision
Then substituting i = 1 into (1) and (2) yields the sum of j ⋅ P (1, j ) ,
j = 0,… , Q,… , N − 1 :
N −1
Q
N −1
j =0
j =0
j = Q +1
Σ j ⋅ P(1, j ) = Σ j ⋅ P(1, j) + Σ
Q
N −1
j =0
j = Q +1
= [Σ j ⋅ ρ j ⋅ +
Σ
j ⋅ P(1, j )
ρ ⋅ ( ρ j −1 − ρ N −1 )
] ⋅ P(1, 0)
(1 − ρ N −Q )
j⋅
where
Q
Σ j⋅ρ
j
⋅ P(1, 0) =
j =0
[Q ⋅ ρ Q + 2 − (Q + 1) ⋅ ρ Q +1 + ρ ]
⋅ P(1, 0)
( ρ − 1)2
and
ρ ⋅ ( ρ j −1 − ρ N −1 )
Σ (1 − ρ N −Q ) ⋅ P(1, 0) =
j =Q +1
N −1
ρ (Q + N +1) N − ρ (Q + N ) N + ρ (2Q +1) − ρ (Q + N +1) Q − ρ (Q + N +1) + ρ (Q + N ) Q
⋅ P(1, 0)
(− ρ Q + ρ N )( ρ − 1)
=
Substituting i = 2 into (3) and (4) yields the sum of probability P ( 2, j ) , for
j = Q + 1,… , N , N + 1,… , L
L
N
L
j = Q +1
j = Q +1
j = N +1
N
N
j = Q +1
j = Q +1
Σ P(2, j ) = Σ P(2, j ) + Σ
P(2, j )
where
Σ P(2, j ) = ∑
=
ρ
ρ N ⋅ (1 − ρ ) ⋅ [1 − ( ) j −Q ]
2
(2 − ρ ) ⋅ (1 − ρ N −Q )
⋅ P(1, 0)¡
(− ρ N − ρ + 2 N + 2( − N + Q ) ρ ( N +1−Q ) + ρ Q − 2Q) ρ N (1 − ρ )
⋅ P(1, 0)
( ρ − 2)(− ρ + 2)(1 − ρ ( N −Q ) )
and
L
Σ
P(2, j ) =
j = N +1
=
=
L
∑
j = N +1
ρ
ρ
ρ N ⋅ (1 − ρ ) ⋅ [1 − ( ) N − Q ] ⋅ ( ) j − N
2
2
(2 − ρ ) ⋅ (1 − ρ N −Q )
⋅ P(1, 0)¡
( ρ − 1)( ρ (Q + L +1) 2( N − L ) − ρ (Q + N +1) − 2(Q − L ) ρ ( N + L +1) + 2( − N + Q ) ρ (2 N +1)
⋅ P(1, 0)
( ρ − 2) 2 (− ρ Q + ρ N )
P.-C. Lin / Application of Empirical Bayesian Estimation to the Optimal Decision
Then substituting i = 2 into (3) and (4) yields the sum of
j = Q + 1,… , N , N + 1,… , L
L
Σ
j ⋅ P(2, j ) =
j = Q +1
N
Σ
j ⋅ P(2, j ) +
j = Q +1
L
Σ
203
j ⋅ P ( 2, j ) , for
j ⋅ P(2, j )
j = N +1
where
N
Σ
j ⋅ P(2, j ) = j ⋅
Σ
j = Q +1
j = Q +1
=
ρ
ρ N ⋅ (1 − ρ ) ⋅ [1 − ( ) j −Q ]
N
2
(2 − ρ ) ⋅ (1 − ρ N −Q )
⋅ P(1, 0)
⎡ (8 N + 8 N 2 − 8Q 2 + 4) ρ N + Q +1 + (2Q − N + 2 + 6 N ⋅ 2Q − N ) ρ 2 N + 2
⎤
⎢
⎥
2
2
N +Q
2
2
N +Q + 2
+ (5Q − Q − 5 N − 5 N − 4) ρ
⎢ +4(Q + Q − N − N ) ρ
⎥
⎢
⎥
Q− N +2
2 N +1
2
2
N +Q +3
+
−
⋅
⋅
+
−
+
+
(1
N
)
2
ρ
(
Q
Q
N
N
)
ρ
⎢
⎥
⎢⎣ −2Q +1− N ⋅ N ⋅ ρ 2 N + 3
⎥⎦
2 ⋅ ( ρ − 2)3 ⋅ ( ρ Q − ρ N )
⋅ P (1, 0)
and
L
Σ
j ⋅ P (2, j ) = j
j = N +1
= ( ρ − 1) ⋅
ρ
ρ
ρ N ⋅ (1 − ρ ) ⋅ [1 − ( ) N −Q ] ⋅ ( ) j − N
2
2
(2 − ρ ) ⋅ (1 − ρ N −Q )
⋅ P (1, 0)
⎡( L + 1) ⋅ 2Q − L +1 ρ Q − L +1 − ( L + 1) ⋅ 2N − L +1 ρ Q+ L +1 + 2N − L ⋅ L ⋅ ρ 2+Q + L ⎤
⎢ Q−L
⎥
2+ L + N
+ 2(1 + N ) ρ Q+ N +1 − 2Q− N +1 (1 + N ) ρ 2 N +1
⎢ −2 ⋅ L ⋅ ρ
⎥
⎢
⎥
N +Q + 2
Q− N
2+ 2 N
N
ρ
2
N
ρ
−
+
⋅
⎣
⎦
( ρ − 2)3 ⋅ ( ρ Q − ρ N )
⋅ P(1,0)
Then we rewrite (7) as function of traffic intensity ρ , and decision variables N, Q. ρ is
estimated by empirical Bayesian estimator ρˆ EB and substituting ρˆ EB into (6), we obtain
Pˆ (1, 0 ) :
−1
⎧
ρˆ EB L− N
ρˆ EB N −Q ⎫
EB N
EB
EB
EB
ˆ
ˆ
ˆ
ˆ
⋅
−
⋅
−
+
⋅
−
⋅
⋅
−
{(2
)
(
)
(1
)
(
)
[1
(
) ]} ⎪
N
Q
ρ
ρ
ρ
ρ
⎪⎪ 1
⎪
2
2
−
Pˆ (1,0) = ⎨
⎬
EB
EB 2
EB N −Q
ˆ
ˆ
ˆ
−
−
⋅
−
1
(2
)
(1
(
)
)
ρ
ρ
ρ
⎪
⎪
⎪⎩
⎪⎭
The expected cost minimization model is as follows:
204
P.-C. Lin / Application of Empirical Bayesian Estimation to the Optimal Decision
Minimize( N , Q ρˆ
+Cs ⋅
EB
) = Cs ⋅
N
Σ
( ρˆ EB ) N ⋅ (1 − ρˆ EB ) ⋅ [1 − (
Σ
2
ρˆ EB
) N −Q ] ⋅ (
ρˆ EB
2
2
(2 − ρˆ EB ) ⋅ [1 − ( ρˆ EB ) N −Q ]
j = N +1
) j −Q ]
(2 − ρˆ EB ) ⋅ [1 − ( ρˆ EB ) N −Q ]
j = Q +1
( ρˆ EB ) N ⋅ (1 − ρˆ EB ) ⋅ [1 − (
L
ρˆ EB
) j−N
⋅ Pˆ (1, 0)
⋅ Pˆ (1, 0)
Q
+Cw ⋅ Σ Max[0, ( j − 1)] ⋅ ( ρˆ EB ) j ⋅ Pˆ (1, 0)
j =0
+Cw ⋅
+Cw ⋅
+Cw ⋅
N −1
Σ
Max[0, ( j − 1)] ⋅
j = Q +1
N
Σ
ρˆ EB ⋅ [( ρˆ EB ) j −1 − ( ρˆ EB ) N −1 ] ˆ
⋅ P(1, 0)
[1 − ( ρˆ EB )]N −Q
Max[0, ( j − 2)] ⋅
j = Q +1
L
Σ Max[0, ( j − 2)] ⋅
j = N +1
( ρˆ EB ) N ⋅ (1 − ρˆ EB ) ⋅ [1 − ( ρˆ EB 2) j −Q ] ˆ
⋅ P (1, 0)
(2 − ρˆ EB ) ⋅ (1 − ( ρˆ EB ) N −Q )
( ρˆ EB ) N ⋅ (1 − ρˆ EB ) ⋅ [1 − ( ρˆ EB 2) N −Q ] ρˆ EB j − N ˆ
)
⋅(
⋅ P (1, 0)
2
(2 − ρˆ EB ) ⋅ (1 − ( ρˆ EB ) N −Q )
N −1 ˆ EB
⎡Q
⎤
ρ ⋅ [( ρˆ EB ) j −1 − ( ρˆ EB ) N −1 ] ˆ
+Ci ⋅ ⎢ Σ ( ρˆ EB ) j ⋅ Pˆ (1, 0) + Σ
⋅ P (1, 0) ⎥
EB N − Q
ˆ
−
[1
(
)]
ρ
j = Q +1
⎣ j =1
⎦
EB N
EB
EB
N −Q
ˆ
ˆ
ˆ
( ρ ) ⋅ (1 − ρ ) ⋅ [1 − ( ρ 2)
] ˆ
+Con ⋅
⋅ P (1, 0)
(2 − ρˆ EB ) ⋅ (1 − ( ρˆ EB ) N −Q )
+C ⋅ ( ρˆ EB )Q ⋅ Pˆ (1, 0)
off
+Ce ⋅ Pˆ (1, 0) + CL ⋅
( ρˆ EB ) N ⋅ (1 − ρˆ EB ) ⋅ [1 − ( ρˆ EB 2) N −Q ] ρˆ EB L − N ˆ
⋅(
⋅ P (1, 0)
)
2
(2 − ρˆ EB ) ⋅ (1 − ( ρˆ EB ) N −Q )
It is hard to solve the above NLP analytically and prove its feasible region is a
convex set which possesses the optimal N* and Q* and minimizes the expected cost
globally. Thus, we applied a numerical method to explore how changes in the NLP’s
parameters change the optimal solution.
4. SENSITIVITY ANALYSIS
In this section we illustrate some the results obtained in previous sections with a
hypothetical queuing experiment. First we applied Monte Carlo simulation to generate
random data for five queues and the one-step maximum likelihood estimator ( αˆ , βˆ ) =
1
1
(58.19542203, 11.31472722), ( αˆ 2 , βˆ2 ) = (28.31890446, 6.954543058). The empirical
Bayesian estimator of traffic intensity ρˆ EB =1.294695872.
Next, we perform numerical analysis to determine:
The influence of changing Cs on the minimum expected cost and optimal
N*, Q* as Con = Coff = 0 and Con = Coff = 25, respectively.
205
P.-C. Lin / Application of Empirical Bayesian Estimation to the Optimal Decision
The impact of changing Ci on the minimum expected cost and optimal N*,
Q* as Con = Coff = 0 and Con = Coff = 25, respectively.
The impact of changing the average waiting cost for each customer C w on
the minimum expected cost and optimal N*, Q* as Con = Coff = 25
The influence of CL and Ce on the minimum cost respectively.
The impact of changing Con and Coff on the minimum expected cost and
optimal N*, Q* while Cs = 0, Ce = 0 and Cs = 150, Ce = 250, respectively.
The influence of traffic intensity on the optimal solution.
The influence of system capacity L on the optimal solution.
We sum up the following results:
When there is no start up and shut down cost for the second server, in order
to attain the minimum cost the second server will be turned on and off
frequently. As the fulltime operating cost for second server gets higher, the
second server won’t provide service readily.
When the fulltime idle cost for second server gets larger, the second server
should be kept busy most of the time. As long as the average waiting cost for
each customer becomes larger, the system had better not to keep customer
wait so the second server should be turns on sooner.
We found the variation of penalty cost for system being fully loaded and
empty reveal no significant impact on the minimum cost. However, the
penalty cost for system being fully empty did change optimal N* and Q*
significantly.
If there were no cost for the second server to offer service, the second server
would be turned on as soon as possible. However, the start up cost and shut
down cost would prevent the second server from being turned on and off.
The higher the traffic intensity is, the sooner the second server should be
turned on to cease the congestion.
When the system capacity L is big enough, it makes no influence on the
optimal solution.
Table 2 presents the special case in which only one parameter is non-zero to
validate the accuracy of the proposed model. Finally we sum up the effect of increasing
parameters on the decision variables in Table 3.
Table 2: The special case in which only one parameter is non-zero
ρˆ EB =1.2947, L=50
Cs
Ci
Cw
CL
Ce
Con
Coff
N*
Q*
Ec
150
0
0
0
0
0
0
100
0
0
0
0
0
0
1
0
0
0
0
0
0
500
0
0
0
0
0
0
500
0
0
0
0
0
0
100
0
0
0
0
0
100
49
2
2
2
49
49
47
0
0
0
47
0
32.22
43.02
0.76
≈ 0.00
≈ 0.00
2.16
206
P.-C. Lin / Application of Empirical Bayesian Estimation to the Optimal Decision
Table 3: The effect of increasing parameters on the decision variables
Parameter
Cs
Cw
Con , Coff
Ce
C
CL
i
Decision
variable
Effect
*
*
N
Q
+
+
*
N
Q
-
-
*
*
N
Q
-
-
*
*
N
Q
+
-
*
*
*
N
Q
+
+
*
N
Q*
-
-
5. CONCLUSIONS
This paper applies the empirical Bayesian approach to estimate the demand for
service and constructs a server-dependent queuing system, then employs the queue length
as decision variables for activating and closing the second server to construct an NLP
model of minimum expected cost for a decision maker. Associating the costs with the
opening of the second server, the start up and shut down cost for turning on and off the
second server, and the waiting of the customers, a relationship is developed to obtain the
optimal value of N and Q to minimize cost. We also performed a sensitivity analysis to
discuss how changes in the NLP’s parameters ( Cs ; Ci ; CL ; Ce ; Con ; Coff ; C w ) affect
the optimal solution. From the numerical analysis, we conclude that (1) the fulltime
operating cost for the second server and the penalty cost for system being empty increase
would cause larger N* and Q*; (2) the fulltime idle cost for the second server, the
average waiting cost for each customer, and the penalty cost for system being fully
loaded increase would cause smaller N* and Q*; (3) the start up and shut down cost for
turning the second server on and off back and forth increase would cause larger N* but
smaller Q*. The results of the evaluation model present a reference for service facility
requirement planning.
REFERENCES
[1]
[2]
[3]
[4]
[5]
[6]
[7]
[8]
Armero, C., and Bayarri, M.J., “Bayesian prediction in M/M/1 queues”, Queueing Systems, 15
(1994) 401-417.
Bansal, K.K., and Garg, R.L., “An additional space special service facility heterogeneous
queue”, Microelectronics and Reliability, 35(4) (1994) 725-730.
Dai, K.Y., "Queue-dependent servers in an M/M/3 queueing system with finite capacity",
Master Thesis, National Chung Hsing University, Taiwan, 1999.
Garg, R.L., and Singh, P., “Queue dependent servers queuing system", Microelectronics and
Reliability”, 33(15) (1993) 2289-2295.
Hsieh, W.F., "Optimal control of the finite capacity and infinite capacity with a removable
service station subject to breakdown", Master Thesis, National Chung Hsing University,
Taiwan, 1993.
Mcgrath, M.F., and Gross, D., “A subjective Bayesian approach to the theory of queues Imodeling”, Queueing Systems, 1 (1987) 317-333.
Sapna, K.P., “An M/G/1-type queueing system with non-perfect servers and no waiting
capacity”, Microelectronics and Reliability, 36(5) (1996) 697-700.
Singh, V.P., “Two-server Markovian queues with balking. Heterogeneous vs. homogeneous
servers”, Operations Research, 18(1) (1970) 145-59.
P.-C. Lin / Application of Empirical Bayesian Estimation to the Optimal Decision
[9]
[10]
[11]
[12]
[13]
[14]
[15]
[16]
[17]
[18]
207
Sohn, S.Y., ”Influence of a prior distribution on traffic intensity estimation with covariate”,
Journal of Statistical Computation & Simulation, 55 (1996) 169-180.
Thiruvaiyaru, D., and Basawa, I.V., “Empirical Bayes estimation for queueing systems and
networks”, Queueing Systems, 11 (1992) 179-202.
Wang, K.H., and Huang, H.M., “Optimal control of a removable server in an M/Ek/1 queueing
system with finite capacity”, Microelectronics and Reliability, 35(7) (1995) 1023-1030.
Wang, K.H., and Hsieh, W.F., “Optimal control of a removable and non-reliable server in a
Markovian queueing systems with finite capacity”, Microelectron. Reliab.. 35(2) (1995) 189196.
Wang, K.-H., Chang, K.-W., and Sivazlian, B.D., “Optimal control of a removable and nonreliable server in an infinite and a finite M/H2/1 queueing system”, Applied Mathematical
Modelling, 23( 8) (1999) 651-666.
Wang, Y.L., "Optimal control of an M/M/2 queueing system with finite capacity operating
under the triadic (0,Q,N,M) policy", Master Thesis, National Chung Hsing University.
Taiwan, 2001.
Winston, W. L., Operations Research, 3rd edition, Duxbury, Indiana University, 1994.
Wiper, M.P., “Bayesian analysis of Er/M/1 and Er/M/c Queues”, Journal of Statistical
Planning and Influence, 69 (1998) 65-79.
Yamashiro, M., “A system where the number of servers changes depending on the queue
length”, Microelectronics and Reliability, 36(3) (1996) 389-391.
Yen, K.L., "Optimal control of the M/Hk/1 queueing system with a single removable server",
Master Thesis, National Chung Hsing University, Taiwan, 2000.