Future Vietnam-EU free trade agreement (Vietnam-EU FTA): An analysis of trade creation and trade diversion effects
Bạn đang xem bản rút gọn của tài liệu. Xem và tải ngay bản đầy đủ của tài liệu tại đây (619.12 KB, 18 trang )
RESEARCH ON ECONOMIC AND INTEGRATION
FUTURE VIETNAM-EU FREE TRADE AGREEMENT (VIETNAM-EU FTA):
AN ANALYSIS OF TRADE CREATION AND
TRADE DIVERSION EFFECTS
Nguyen Binh Duong*
Tu Thuy Anh**
Nguyen Thu Trang***
Abstract
This paper aims to analyze trade creation and trade diversion effects of future VietnamEU FTA, in a framework of negotiations from 2012 to ensure an effective environment
for trade and investment. The theory of trade creation and trade diversion will be used to
evaluate impacts of an FTA on Vietnam’s welfare. By using a gravity model and a panel
data analysis, we show that the reduction of tariffs in the framework of the FTA will have
a positive impact on bilateral trade between Vietnam and the EU. In addition, Vietnam-EU
FTA will offer many new opportunities such as trade creation in automotive industry, but it
also poses challenges for Vietnam.
Key words: FTA, Trade creation, Trade diversion, Vietnam- EU, Welfare
Date of submission: 3rd October 2014 - Date of approval: 10th January 2015.
1. Introduction
Since the Renovation in 1986, Vietnam
has achieved substantial progress in
macroeconomic management and international
integration. Vietnam’s recent accession to
ASEAN, APEC, and the accession process
to WTO offer substantial opportunities to
liberalize further its economic system. As a
rapidly developing and fast growing economy,
Vietnam holds substantial potential for EU
businesses. The Partnership and Cooperation
Agreement between the EU and Vietnam signed in June 2012 - offers a solid foundation under the Generalized Scheme of Preferences.
to intensify relations between the two part ies, Negotiations for a comprehensive free trade
Vietnam enjoys trade preferences with the EU agreement constitute an important step
PhD, Foreign Trade University(Vietnam). Email:
Assoc. Prof. Dr, Foreign Trade University. Email:
***
DEPOCEN and Foreign Trade University. Email:
*
**
No 72 (4/2015)
EXTERNAL ECONOMICS REVIEW
3
RESEARCH ON ECONOMIC AND INTEGRATION
towards further intensifying bilateral relations.
Both sides seek a comprehensive agreement.
Negotiations cover tariffs as well as non-tariff
barriers to trade and other trade related aspects
such as public procurement, regulatory issues,
competition, services, intellectual property
rights, and sustainable development.
Even though the integration into international
trading system increased trade with the rest
of the world, the effects of liberalization on
welfare of Vietnam remain a critical issue
among Vietnamese policy makers. A Free
Trade Agreement (FTA) between Vietnam
and the EU is expected to offer many new
opportunities, but also pose challenges for
Vietnam’s economy. Information on the
consequences of future FTA between Vietnam
and the EU is clearly needed as a basis for
decisions of policy makers.
In this context, this paper aims to analyze
the impact of future Vietnam-EU FTA on the
welfare of country. The first part analyses the
trade betweenVietnam and EU and VietnamEU FTA negotiations process. The next part
presents the theoretical framework of trade
creation and trade diversion effects of an
FTA. After that, a gravity model will be used
to analyze impacts of tariff reduction in the
framework of Vietnam-EU FTA on Vietnam’s
bilateral trade with EU. The last part analyzes
possible effects of Vietnam-EU FTA on some
key industries of Vietnam.
2. Overview of the Vietnam-EU Free Trade
Agreement
2.1. Vietnam- EU trade picture
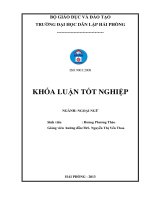
In 2013, the EU outstripped the United States
to become Viet Nam’s biggest export market
with its turnover figure of US$28.11 billion, up
38.45% compared to 2012 (Figure 1). Vietnam
is an export-driven economy, with 69% of
GDP exported in 2008 (64% in 2009 and 61%
in 2005); 16% of the GDP value is exported to
the EU, for a value of 14.9 bn. USD (14% in
2009 for 12.6 bn.) and it represents the 17% of
all Vietnamese exports (constant from 2005).
Characteristics in import – export structure
between Vietnam and EU is the high level
of mutual complement and less direct
competition. In 2013, two-way trade turnover
between Vietnam and EU reached 33.8 billion
USD, increasing by 16.11% over the figure
Figure 1: Vietnam’s trade with EU
Source: GSO (2013)
4
EXTERNAL ECONOMICS REVIEW
No 72 (4/2015)
RESEARCH ON ECONOMIC AND INTEGRATION
of 2012, in which export to and import from
EU were respectively 24.4 billion USD and
9.4 billion USD. Main exports to EU include
garments, footwear, coffee, wooden items,
aqua-products.
Vietnam’s imports from EU are dominated
by high tech products including electrical
machinery and equipment, aircraft, vehicles,
and pharmaceutical products. The EU has
a negative balance of trade in goods with
Vietnam. In 2012, EU-Vietnam trade in goods
was worth over €23.8 billion, with €18.5
billion in imports from Vietnam into the EU,
€5.3 billion in exports from the EU to Vietnam
EU is one of the largest foreign investors in
Vietnam. In 2012, EU investors committed
a total US$ 1.061 billion in Foreign Direct
Investment and thus remain Vietnam’s fourth
largest foreign investor’s partner (GSO,
2012). In 2013 registered capital invested in
Vietnam by EU businesses was over 17 billion
USD with nearly 1400 projects. EU investors
are present in most pivotal economic sectors,
mainly in industries, construction and service
sub-sector.
2.2. Vietnam - EU FTA negotiations
The EU and Vietnam, one of the 10 members
of ASEAN, announced the start of bilateral
FTA negotiations in Brussels in June 2012.
The EU and Vietnam have strong trade ties.
Vietnam is the EU’s fifth largest trading
partner within ASEAN (and 35th out of the
EU’s total trade). In 2012, two-way trade
amounted to almost €24 billion. The EU is
one of the largest foreign direct investors,
committing €1.37 billion in total. Vietnam
is the third ASEAN country to hold FTA
negotiations with the EU after Singapore
No 72 (4/2015)
and Malaysia, and followed by Thailand.
While pursuing a bilateral approach, the EU
is not losing sight of the ultimate goal of
achieving an agreement with ASEAN as a
whole, one of the most dynamic regions in the
world. The EU is therefore looking to reach
an ambitious agreement with Vietnam that
is coherent with other individual FTAs with
ASEAN member states.
EU – the huge market with 27 members- is one
of the most important trade partners of Vietnam.
In 1995, the two sides signed a Framework
Cooperation Agreement. Vietnam and EU
relation are further strengthened through
signing off Partnership and Cooperation
Agreement (PCA). Vietnam and EU intend to
launch a free trade negotiation with large and
deep market access commitments.
From 2012 to 2014, Vietnam and EU passed
7 negotiations rounds. The 7th negotiation
round of Vietnam – EU Free Trade Agreement
(EVFTA) was held from March 17 to 26,
2014 in Hanoi. Two sides have been active in
accelerating negotiation in all aspects, especially
is the fields both sides have benefits in.
Vietnamese Delegation of representatives
from Ministries and branches led by Deputy
Minister of Industry and Trade, Head of
Government’s Negotiation Delegation on
international economic and commercial
integration, participated in the negotiation
round. Negotiation was conducted at Head
Delegation level, Deputy Head Delegation
level and at 10 Working Groups including
Trade in Goods, Trade in Service, Investment,
Rule of Origin, SPS, Trade Protectionism,
Sustainable development, Legislation –
Institutions...
EXTERNAL ECONOMICS REVIEW
5
RESEARCH ON ECONOMIC AND INTEGRATION
On occasion of negotiation round, EU Trade
Commissioner had visit to Vietnam for
negotiation accelerating and promoting trade,
investment between Vietnam and EU. In the
talk between Vietnam’s Minister of Industry
and Trade and EU Trade Commissioner,
Vietnam and EU affirmed determination on
soon finalizing the comprehensive and high
quality agreement. In spirit of negotiation
accelerating as affirmed by EU Trade
Commissioner, Technical Groups had openminded and constructive negotiation.
During negotiation session, groups continued
having discussion on consolidated text based
on in-depth and detail exchange on view and
approach to specific issues, having further
introduction on legal system for clarifying
proposals and requests. Groups on Trade in
Goods, Trade in Service and Government’s
procurement had further negotiation on offers
and request in respective aspects.
Wrapping negotiation round, Technical
Groups such as transparency, dispute
settlement have basically agreed on the text.
Remaining Groups had narrowed the gap in
many questions. Black-bone and complicated
issues directly impacting negotiation schedule
have been exchanged by Heads of Negotiation
Delegations on solving roadmap for finding
out appropriate solutions satisfactory to
expectation of both sides, targeting on benefitbalancing based positive progresses.
3. Impact of FTA on the welfare of import
country
3.1. The theoretical background
From an analytical viewpoint, before 1950,
analysts often assumed that customs union
would be welfare improving, since some
tariffs would fall..
6
EXTERNAL ECONOMICS REVIEW
Jacob Viner (1950) shows that a customs union
will not necessarily improve welfare since
the tariff reductions occur, the formation of
a customs union would be welfare improving
depending on the source of the increased
trade. Viner mentions two important notions:
trade creation and trade diversion.Trade
creation takes place when Trade creation
takes place when economic integration results
in a movement in product origin to a lowercost member country. Trade diversion, on
the other hand, occurs when the removal of
tariffs causes trade to be diverted from a third
country to the partner country despite the fact
that, were the countries treated equally, the
third country would be the low cost source of
imports. In the Vinerian framework, welfare
therefore depends on the extent of trade
creation relative to trade diversion.
After the original Vinerian study (l950), the
magnitude of these effects would still be
of interest. Kimberly A. Clausing (2001)
examines the changes in trade patterns
introduced by the Canada-United States Free
Trade Agreement. Variation in the extent
of tariff liberalization under the agreement
is used to identify the impact of tariff
liberalization on the growth of trade both with
member countries and non-member countries.
Data at the commodity level are used, and the
results indicate that the Canada-United States
Free Trade Agreement had substantial trade
creation effects, with little evidence of trade
diversion.
Krueger (1999) studies effects of Mexican
entry into NAFTA. Although the fraction
of Mexican trade with the U.S. and Canada
has risen sharply, a number of factors have
contributed to this result. Mexican reduction
of tariffs and quantitative restrictions and the
No 72 (4/2015)
RESEARCH ON ECONOMIC AND INTEGRATION
Mexican alteration of exchange rate policy at
the end of l994 were both important. Based
on early returns, the impact of NAFTA over
its first three years does not appear to have
been large relative to the effects of these other
events.
Cline (1978) examines trade shares before
and after an agreement in order to assess what
effect the agreement may have had on trade
patterns. It is often implicitly assumed that the
share of trade occurring with partner countries
would not have changed in the absence of the
agreement. Krugman (1994) believes that
preferential arrangements between natural
trading partners are likely to be positive
developments.
Many empirical researchers have also had
difficulty reaching firm conclusions regarding
the effects of preferential trading agreements.
However, until now, many economists
followed the Viner’s point of view to evaluate
effects of trading agreement: welfare depends
on the extent of trade creation relative to trade
diversion.
The unilateral removal of a tariff generally
increases imports of the good in question,
increasing domestic consumption and
reducing domestic production (Kimberly A.
Clausing (2001), Krugman.P (2006). The
gains to consumers outweigh the loss of tariff
revenue and producer surplus, leading to
overall welfare gains. As Viner pointed out,
however, the analysis is more complex if the
tariff is only reduced on partner imports.
Trade creation refers to a situation where two
countries within the FTA begin to trade with each
other, whereas formerly they produced the good
in question for themselves. In international trade
terms it means the countries go from autarky (in
this good) to trading with zero tariffs, and they
both gain. Trade diversion, on the other hand,
occurs when two countries begin to trade within
the FTA, but one of these countries had formerly
imported the good from outside the FTA. The
importing country formerly had the same tariffs
on all other countries, but purchased from
outside the FTA because that was lowest. After
the union, the country switches its purchases
from the lowest – price to a higher – price
country, in this case there is negative efficiency
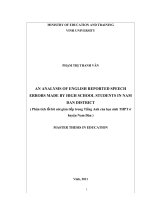
effect. An examination of Figure 2 makes this
ambiguity clearer.
Figure 2: Trade creation and trade diversion
S. Vietnam
PEU +T
A
PNon member+T
PEU post FTA
PNon member
No 72 (4/2015)
H
I
C
B
G
J
F
K
E
D
L
M
D. Vietnam
EXTERNAL ECONOMICS REVIEW
7
RESEARCH ON ECONOMIC AND INTEGRATION
Figure 2 above shows an analysis of a good
in Vietnam that is initially protected by a
tariff. Imports are equal to the quantity BC,
the difference between domestic demand and
domestic supply at the tariff-inclusive price.
Consider, firstly, the case where Vietnam
applies the same tariffs (T) on imports from
all countries. Vietnam’s consumer will buy
at price PNM + T. Secondly, once the tariff is
eliminated on EU’s goods, imports from the
EU replace those from the rest of the world.
Since the EU duty-free price (PEU post FTA)
is lower PNM + T, demand increases and
Vietnamese domestic production reduces.
Imports increases, equal to GD. Domestic
consumers gain the areas ACDH, domestic
producers lose the area ABGH, tariff revenue
falls by BCEF, and the overall welfare effects
are ambiguous. Trade creation leads to a gain
of BFG and CDE, but trade diversion leads
to a loss of FELK, as the imports from EU
replace imports from non member countries.
In practice, there are several cases when
the outcome would be less ambiguous. For
example, if the EU were already the low cost
producer before the FTA, trade creation would
result in welfare gains equal to areas JBK and
LCM, without any trade diversion losses.
However, if EU were instead uncompetitive
before the tariff reduction and just a very little
less than the rest of the world tariff inclusive
price after the FTA, only trade diversion
would take place, with a loss in tariff revenue
of BCLK but no noticeable gains.
3.2. Panel data analysis of the impact of
tariff reduction on trade
3.2.1. Model specification and data
Gravity models have become predominant
in the last four decades in empirical analysis
8
EXTERNAL ECONOMICS REVIEW
of bilateral trade because of its convenience
and high degree of flexibility. The basic
underpinning of gravity models is Newton’s
Law of Gravitation which states that two
celestial bodies are subjected to a force of
attraction that is positively proportional
to their mass and negatuvely proportional
to their distance. The application of
gravity equations to empirical analysis
of international trade was pioneered by
Tinbergen (1962). According to the early
gravity equations, the amount of trade
between two countries is explained by their
economic size and geographical distance:
Fij =
AYi Yj
Dij
where:
Fij is the trade flow (i.e. migration, trade,
capital) from country i to country j at time t
A is a constant of proportionality
Yi and Yj is a proxy of the country size (GDP,
or population)
Dij is the geographical distance between
countries’ capitals or economic centers
The estimations employ a log-linear form of
the above equation: the expected signs of the
coefficients state that bilateral flow between
country i and country j is positively associated
with size (Yi and Yj) and inversely related to
distance (Dij), the latter being a proxy for
transaction costs. The underlying assumption
is that a high level of income indicates a high
level of production which would lead to a
high level of exports in the exporting country.
In a similar way, a high level of GDP in the
importing country also implies a high level of
imports from the partner. On the other hand,
trade is restrained by longer distance as it
No 72 (4/2015)
RESEARCH ON ECONOMIC AND INTEGRATION
makes trade costlier.
Several modifications have contributed to the
improvement of the early gravity equations
by adding new variables such as the level of
economic development (per capita GDP), the
share of rural population, cultural similarities,
linguistic characteristics, tariff, political
stability and institutions et cetera. In the specific
case of preferential trading arrangements,
Aitken (1973) was the first to apply crosssection gravity models to assess the impact
of RTA membership on bilateral trade flows.
Since then, a huge number of empirical studies
used gravity models to explore the effects of
regional groupings. In a recent study, Nguyen
and Xing (2008) apply the gravity model to
analyze Vietnam’s exports; however, any
single-country approach needs to estimate
both exports and imports as the trade flows
are asymmetric. Nguyen (2002) attempts to
address the effects of AFTA on Vietnam by
examining both exports and imports: but his
cross-section regression was only estimated
for the years 1995, 1996, 1997 and 1998.
Also, Chaisrisawatsuk S. and Chaisrisawatsuk
W. (2007) use the gravity model to explain
simultaneously the imports, exports and total
trade of 29 Organization for Economic Cooperation and Development (OECD) countries
and 6 ASEAN member countries. But their
study did not mention Vietnam. By contrast,
Tumbarello (2006) investigates the extent to
which Vietnam’s favourable trade performance
may have been excessively centred on trade
with other countries in the region: however,
the study was applied to cross-country data for
only one year (that is 2002) and regressed for
the total trade.
Despite extensive literature using this approach,
the empirical studies based on gravity model
to estimate effect of tariff on trade are still
rather limited in the case of Vietnam. In a
recent study, MUTRAP III project applies
the CGE model to analyze effect of tariff on
Vietnam’s economy. But the limit of CGE is
that this model based on the assumption of
perfect competition market, rarely exist in
reality. So that, to overcome these limitations,
we use gravity model with a panel dataset to
estimate effects of tariff on trade. The main
reason for preferring panel data analysis is
that the cross-section specification is very
likely to suffer from omitted variable bias
because of the unobserved country specific
effects. Cross-section specification has also
the disadvantage to completely neglect the
temporal aspects of foreign trade. Therefore
adopting panel regression techniques allow us
to take advantage of these different types of
information.
Let us estimate effect of tariff reduction on
Vietnam’s bilateral trade. The empirical study
assumes a log-linear functional form for
gravity equations. Compared to the traditional
gravity equation, we add new variables such
as: GNI per capita (indicating the size of
economies), tariff for imports, exchange rate
(indicating factors that encourage/discourage
the trade flow). The model is defined and then
estimated as follows:
Log BTIc, d, t = a0 + a1 log (GNIc, t * GNI d, t) + a2 log (PCGNIc, t * PCGNId, t) + a3log (POPc,t
* POPd,t) + a4DISTc, d + a5 log (1 + TRd, c) + a6 log (1 + TRc, d) + a7 log EXTc, d, t + ec, d, t
No 72 (4/2015)
EXTERNAL ECONOMICS REVIEW
9
RESEARCH ON ECONOMIC AND INTEGRATION
where:
BTIc,d,t : Vietnam’s bilateral trade with country
d at time t
EXTc,d,t: Bilateral exchange rate between
Vietnam and country j (foreign currency in
terms of Vietnamese currency) at time t
GNIc,t and GNId,t: Gross national income of
Vietnam at time t and Gross national income
of country d at time t
ec, d, t: error (ec, d, t = uc+ vd + wt + ηc,d,t)
PCGNIc, t and PCGNId, t :Per capita gross
national income of Vietnam at time t and Per
capita gross national income of country d at
time t
w: time effects; h: random effects
POPc,t and POPd,t: Population of Vietnam at
time t and Population of country d at time t
DISTc,d: Distance (km) between Vietnam and
country d, which is time-invariant
TRd,c and TRc,d: Vietnam’s tariff for imports
from country d and EU’s tariff for imports
from Vietnam
u, v: captures all individual (country specific)
effects omitted from our model specification
We built a panel data including Vietnam and
27 EU countries (Appendix ), from 1997 to
2011. The data of Vietnam’s bilateral trade
(equal to the total value of Vietnam’s exports
and imports) are annual data, obtained at dollar
values from the General Statistics Office
and Trademap database. The Gross national
income (GNI) of both Vietnam and its trading
partners are collected from the World Bank
database, Per capita Gross national income
Table 1: Description of data
Variales
Standard
error
Min
value
Max value
1 GNIc,t (Bn.USD)
54,29
14,3
34,26
79,55
2 GNId,t (Bn.USD)
496,27
767
4,88
3.120,95
660,50
141,45
460,9966
905,58
15.194,07 2.274,164
69.495,52
PCGNIc,t (USD/
capita)
PCGNId,t (USD/
4
capita)
3
5 DIST (km)
24.189,59
8.256,17
1.145,75
3.961,51
10.532,99
18.200.000
22.600.000
375.236
82.500.000
7 TRd,c (%)
14,85
3,02
8,75
16,82
8 TRc,d(%)
5,70
0,79
4,19
7,5
14.460,88
9.103,89
50,21
40.918,57
6 POP (person)
9 EXT c,d,t ( VND)
10
Mean
EXTERNAL ECONOMICS REVIEW
No 72 (4/2015)
RESEARCH ON ECONOMIC AND INTEGRATION
Table 2: Matrix of correlation
Variable
lnY
lnPCY
lnPOP
lnY
1
lnPCY
0,5604
1
lnPOP
0,8789
0,1107
1
lnDIST
0,4518
0,4629
0,2881
1
lnTEU
-0,1577
-0,1264
-0,0339
-0,0196
1
lnTVN
-0,1522
-0,1150
-0,0331
-0,0204
0,7408
1
LnEXT
0,1871
0,3319
0,0295
0,0538
-0,1242
-0,1315
(PCGNI) data are calculated by the quotient
between GNI and population data, taken
from the World Bank database. The imports
duties data is MFN rate of Vietnam and EU
countries, taken from the website of the World
Bank. The bilateral exchange rates between
the VN and European countries are calculated
based on data of the exchange rate between
Vietnam( and its partners) and the U.S. dollar,
obtained from the World Bank database.
Geographical distances are obtained online
from the chemical - ecology.net website.
3.2.2. Description of data
The table 1 shows that the minimum value of
GNI is 4,878 (billion U.S. $), the largest value
is 3120.95 (billion USD). The minimum value
of GNI per capita is 460.99 (U.S. $ / person),
the maximum value of GNI per capita is
69495.52 (U.S. $ / person), we can see that
the gap between the richest and poorest is
relatively large, 150 times approximately.
From data collected, we can see that the average
tariff on imports of Vietnam is approximately
2 times higher than the EU’s average tariff on
imports. In addition, we also need to consider
No 72 (4/2015)
lnDIST
lnTEU
lnTVN
LnEXT
1
the correlation between variables. The table 2
shows that the correlation between variables is
weak, except that there is correlation between
lnPOP and LnY, we should pay attention in
the model
3.2.3. Empirical results
The model includes GNI, GNI per capita,
and population variab les. Including all of
these variables at the same time perhaps
create multicolinearity. To avoid this problem,
we estimate separately three models by
dropping either of these variables: the model
(1) dropping GNI per capita; the model (2)
dropping GNI; and the model (3) dropping
Population variable.
In all the three models, we use inspection
Breusch and Pagan Lagrangian multiplier
test for the selection between pooled OLS
and Random effect model (REM). The results
show that the REM model is chosen for three
models. Next, for the selection between
Random Effect Model and Fixed Effect Model
(FEM), the Hausman test result show that
the null hypothesis H0 is rejected in all the
three models, so the FEM model is chosen.
EXTERNAL ECONOMICS REVIEW
11
RESEARCH ON ECONOMIC AND INTEGRATION
Table 3: Gravity models results with fixed effects for model (1), model (2) and model (3)
So, we choose to estimate the gravity models
in a panel data framework with fixed effects.
Among the three models, the model (2) gives
the best results; we chose this model for the
next step of estimation (Table 2).
For the model (2) with fixed effects chosen, we
have to test the presence of heteroscedasticity,
correlation and autocorrelation on error
terms, cross section dependence. The
empirical results show that correlation and
autocorrelation between errors and cross
section dependence are absent, but there is
heteroscedasticity on error terms of the model;
this may arise due to misspecification of the
equation or variation in the coefficients. We
correct the heteroscedasticity and the result is
presented in below table. The table 3 below
shows the model (2) with fixed effects and
corrections for heteroscedasticity.
In the FEM with corrections for
heteroscedasticity, R2 equal to 0.74 shows
that independent variables explain 74% the
variations of dependant variable. As expected,
12
EXTERNAL ECONOMICS REVIEW
the coefficient associated with the gross
national income per capita of Vietnam and
EU is statistically significant in the model
at the 99 percent confidence level and of
positive sign, indicating that an increase
in national income per capita leads to an
increase in Vietnam’s bilateral trade with EU.
In the model, the coefficient explains that an
increase of 1% GNI leads to an increase of 1,
28% of Vietnamese trade. Vietnam’s export
oriented strategy is then partly explained
by supply capacity: a high level of national
income per capita indicates a high level of
investment, which increases the availability
of goods for exports. In addition, a high
level of trading partner’s income per capita
indicates a high level of consumption. Our
results confirm that, like most of the Asian
developing countries, Vietnam experienced
a dramatic increase in export growth and this
outstanding performance was mainly driven
by domestic supply capacity growth (Diaw,
Rieber and Tran, 2009). Another quantitative
No 72 (4/2015)
RESEARCH ON ECONOMIC AND INTEGRATION
Table 4: The model (2) with fixed effects and corrections for heteroscedasticity
research of Nguyen and Tran (2010) shows
that Vietnam’s economic structure tends to be
more dependent on imports, despite the option
for an export oriented strategy. Rather, the
latter may explain ceteris paribus an increase
in the income elasticity of imports and the
resulting constraint on balance of payments.
Vietnam’s bilateral trade is positively
influenced by population of Vietnam and EU
partner countries. The coefficient, statistically
significant and equal to 1.13, shows that
the bilateral trade of Vietnam with EU is
influenced much by the number of consumers
and producers. An increase of 1% population
leads to an increase of 1.13% in the bilateral
trade of Vietnam with EU.
As expected, the coefficient on distance is
statistically significant and has the expected
sign in trade. The model suggests that
geographical proximity is one of factors
explaining Vietnam’s bilateral trade with EU.
The coefficient on the bilateral exchange rate
is statistically significant in the model and
equal to -0.14. An increase of 1% exchange
No 72 (4/2015)
rate leads to a decrease of 0.14% of Vietnam’s
bilateral trade with EU, it shows that exchange
rate played a minor role in Vietnam’s bilateral
trade with the countries under study.
Finally, as expected, the coefficients of
EU and Vietnam’s tariffs for imports are
significant and equal to -0,51 and -0,95
respectively suggest that tariff reduction is
one factor promoting bilateral trade between
Vietnam and EU countries. In the model, the
coefficient explains that a decrease of 1%
EU’s tariffs for imports leads to an increase
of 0.51% of Vietnamese trade, and a decrease
of 1% Vietnam’s tariffs for imports leads to
an increase of 0.95% of Vietnamese trade
with EU According to the commitments in
the WTO, most of Viet Nam’s duties will
have been reduced to their final bound level
by 2014, except for certain fish products
(tariff line 0303.29 Other) and motor cars and
vehicles (under heading 8703), which will not
reach their final bound level until 2017 and
2019, respectively. So, in FTAs Viet Nam and
EFTA agree that an FTA should be established
EXTERNAL ECONOMICS REVIEW
13
RESEARCH ON ECONOMIC AND INTEGRATION
in accordance with WTO rules, thus aiming
to reduce and/or eliminate duties and other
restrictive regulations on substantially all
the trade. With regard to market access for
industrial goods, EFTA’s basic position is
to offer duty free access for goods of HS
chapters25-97, as of the entry into force of
the agreement (with very limited exceptions
for some agricultural products within these
chapters), depending on the overall balance in
the outcome of the negotiations. Fish and other
marine products are considered industrial
goods in accordance with the framework of
the WTO and are included in EFTA’s basic
position of duty free access. In all its existing
FTAs, EFTA has granted the total elimination
of duties on industrial products. In Viet
Nam’s existing FTAs, there is no distinction
between industrial and agricultural goods.
The coverage and time frame for overall tariff
reduction and abolition for Viet Nam varies
from FTA to FTA (e.g. ACFTA: 90% by 2018;
AIFTA: 70% by 2021; AJCEP: 84.6% by
2023; AJCEP:92% by 2025; AKFTA: 90%
by 2018). For industrial goods, the current
estimated proportion of tariff lines with zero
duty applied by Viet Nam is 37.2%, increasing
to 56% by 2012.
3.3. Trade creation and trade diversion
effects on some key industries of Vietnam: a
qualitative analysis
In the previous part, we have used a quantitative
analysis to evaluate impact of tariffs reduction
on the trade between Vietnam and EU. In
this part, we will use a qualitative analysis
to evaluate trade creation and trade diversion
effects on some key industries of Vietnam.
Before choosing the industries to analyze,
we compare the tariffs level of Vietnam with
ASEAN countries. Table 4 shows that the
automotive sector of ASEAN has the highest
CEPT and MFN tariff rate, at 5.72 and 19.17
per cent, respectively. The sector with the
lowest tariff rates is the healthcare sector, with
respective rates of 2.12 and 5.08 per cent.
The country with the highest MFN rate is
Vietnam, with an average rate of 21.98 per
cent. Cambodia is the country with the highest
CEPT rate with an average rate of 9.30 per
cent .The country with the lowest tariff is
Singapore, which has zero CEPT and MFN
tariffs.
We choose industries to analyze by basing on
Table 5: ASEAN’s Average Tariff Rate (%)
Sectors
Vietnam
Brunei
Cambodia Indonesia
Lao
Malaysia Myanmar Philippines Thailand
MFN CEPT MFN CEPT MFN CEPT MFN CEPT MFN CEPT MFN CEPT MFN CEPT MFN CEPT MFN CEPT
Agro-Based
23.8 5.91
0
0 12.9 6.94 3.55 0.32 22.42 7.54 2.06 0.76 4.48 4.09 8.35 2.69 26.8 4.38
Fisheries
32.7 5.79
0
0 19.08 14.83 5.03 0.58 14.03 4.46 2.62 0.83 7.7 4.21 8.81 3.06 6.94 4.79
Healthcare
11.3 3.12 2.19 0.9 6.24 2.03 5.29 1.74 9.34 4.69 1.3 0.4 3.52 3.16 4.14 2.44 7.47 2.69
Rubber-Based
18.6 4.46 9.7 2.5 18.57 8.53 11.02 3.95 8.67 4.63 19.2 4.37 4.09 3.74 7.63 3.59 16.6 1.82
Wood-Based
12.1 3.56 13.6 3.9 14.32 14.62 5.15 0.61 27.68 6.55 8.69 2.08 13.16 9.69 9.24 3.48 8.48 4.04
Textiles & Garments 37.4 6.14 0.71 0.56 16.46 11.36 10.98 1.61 9.6 2.92 13.1 3.98 12.14 8.59 11.6 4.08 20.4 0.49
ICT
9.01 3.29 9.88 2.04 18.31 9.3
5 1.64 7.76 3.93 2.96 1.08 4.14 2.85 2.97 1.13 5.75 1.99
Electronics
13 4.12 9.62 2.8 18.77 10.17 5.79 1.61 8.23 4.09 5.13 1.28 4.47 3.21 4.02 1.41 8.94 2.33
Automotives
39.9 9.8 18.14 5.73 21.41 5.91 24.85 3.83 22.27 8.8 21.1 6.84 11.35 7.67 16.7 3.93 16 4.65
Source: Rina Oktaviani, Amzul Rifin, and Henny Reinhardt (2007)
Note: Singapore’s tariff rates are close to zero
14
EXTERNAL ECONOMICS REVIEW
No 72 (4/2015)
RESEARCH ON ECONOMIC AND INTEGRATION
Table 6: Vietnam’s imports from European Union
Source: trade.ec.europa.eu
tariff levels and imports of these industries
compare to other industries. From theory, we
see that trade creation will be great when,
before FTA, the industry is much protected
and imports of this industry is great. This fact
shows that despite of the high protection by
tariff, domestic demand for these goods still
high. When we combine Vietnam’s tariff (table
4) with Vietnam’s imports (table 5) from EU,
we can see that transport equipment has the
highest tariff (39,9%, table 4), and also the
highest weight in total import in 2012 (21,4%,
table 5). This fact shows that demand for
EU’s transport equipment is great despite of
the high protection by tariff. If tariff reduce in
context of FTA, it maybe lead to trade creation
for Vietnam in this industry.
lead to trade diversion effects on electronics
and machinery industries. This problem will
be studied more clearly in the next part.
3.3.1. Impact on Vietnam’s automotive industry
The Vietnamese automotive industry is still at
its birth stage with only 25,480 cars produced
in 2009. Compared with the 13,790,994 cars
produced by China in the same year, it is clear
that the automotive sector is not yet playing an
important role in the industrial development
of Vietnam. A study of Emiko Fukase and
Will Martin (1999), a modern car industry
embodies relatively high technology both in
its processes and its products and provides
great scope for the development of backward
linkages to component manufactures. For this
reason, many countries have attempted to
persuade international auto firms to establish
domestic production in replacement of car
imports. In Vietnam, this has been done by
imposing high protection on car imports and at
the same time, by promoting self-sufficiency
in production through local content programs.
In terms of trade diversion, we remark that it
can occur when the import tariff pre-FTA is
high, but Vietnam had formerly imported the
good from outside the FTA. In context of tariff
reduction of FTA, imports from an EU can
lead to trade diversion because it can replace
imports from more efficient countries. For
example, in case of Vietnam, the EVFTA can The automotive industry is characterized by
No 72 (4/2015)
EXTERNAL ECONOMICS REVIEW
15
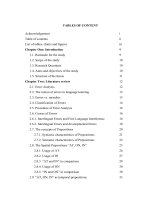
RESEARCH ON ECONOMIC AND INTEGRATION
considerable economies of scale. As is shown
in Figure 3.1, the firms face a downward
sloping average cost (AC) curve. The high
rate of protection on automobiles initially
allows automobile makers to sell at high prices
at P1 and produce at Q0. The initial firms are
extremely profitable because of the protection,
and this profitability attracts additional
entrants. Firms continue to enter until each
firm is operating at sub-optimal scale at Q1.
Given the strong scale economies prevailing
in this industry, the small output level of the
firms pushes up their average costs. The
rise in average costs eventually eliminates
all excess profits and hence removes the
incentive for additional firms to enter, until
a new equilibrium is reached where excess
profits are zero.
The high rate of protection on automotive
industry initially attracted fourteen foreign
automakers such as Toyota, Ford to set up
joint ventures in Vietnam. However, high
protection resulted in high production costs
rather than high profits.
Figure 3.1: Average cost of automotive
industry
turn, hampers the achievement of economies
of scale. Given the low level of per capita
income of $311 (around $1,590 in purchasing
power parity terms in 1997), demand for
vehicles is expected to be around 60,000
per year by the year 2,000 (GSO, 1997).
In addition, a proliferation of models and
corresponding fragmentation of production
among component suppliers has resulted in
small production runs and high costs for many
local component suppliers.
The problem is exacerbated by the
government’s local content policy. In addition
to imposing the localization ratio, Vietnam
pursues a localization objective through the
structure of tariffs and manipulation of quotas
on a variety of completely and semi knocked
down kits (CKD and SKD). For instance,
each approved SKD kit requires that some
parts be deleted in order that they might be
supplied by local producers, raising the costs
of producing the final goods expensive. Such
schemes lead to endless political pressure for
revision and fragmentation, and frequently
lock in production of vehicles using obsolete
technology.
Source: Emiko Fukase and Will Martin
(1999)
These policies are likely to be extremely
costly. Consumers lose from the high prices,
the government loses potential revenues, while
producers lose from sub-optimal scale and
high average costs. The industry continues
to lobby for further increases in protection
given the high costs of production. When
it is successful, a short period of increased
profitability follows, until the benefits are
reduced by additional entry. Then, profits
are again at normal levels, and the cycle of
lobbying starts over again.
Vietnam’s domestic market is small, which in
Claudio Dordi (2011) shows that, for what
16
EXTERNAL ECONOMICS REVIEW
No 72 (4/2015)
RESEARCH ON ECONOMIC AND INTEGRATION
concern the automotive sector, a reduction of
tariff and non tariff barriers from the Vietnam
side will produce an effect on the imports of
components from Europe and on the amount
of FDI. For what concern the import side,
due to the cost of transport and the vicinity of
competing car producers, a reduction in tariff
will not induce substantial increase in imports
of already assembled cars from Europe, as the
benefit of a preferential tariff reduction will
be offset by the cost of transport. This is not
true for the imports of parts and components,
which under some circumstances could be
imported in great number from European
manufacturers. Indeed, the price elasticity of
parts and components is high and a reduction
of tariff would theoretically have an impact on
the exports. On the other hand, without a robust
domestic industry and without European
investors located in Vietnam requiring
components to be assembled, even a reduction
in tariff will have only a limited effect on
the imports. For what concerns components
the real factor influencing the little demand
is the limited amount of investment in the
Vietnamese automotive industry. This limits
drastically the effect of a reduction in tariff.
However, the FTA will have a effect on FDI
in the automotive industry. Indeed, European
car manufacturers seem to be little attracted
by Vietnam as a productive platform for the
ASEAN area. By looking only at the tariff
component, the high protection accorded to
the Vietnamese producers, combined with
the parallel reduction in custom duties by the
other ASEAN members and ASEAN FTA
partners, would virtually render extremely
cheap to export cars from Vietnam to the
Asian region. Furthermore, the cheap labour
available in Vietnam would be another
No 72 (4/2015)
important factor. In reality, tariffs preferences
and cheap labour are not sufficient to drive
investment in the car manufacturing industry.
The deficiencies mentioned above (poor
infrastructures, lack of support industries, low
technology) clearly inhibit foreign investors
to locate the production in Vietnam. In this
respect, the reduction in tariffs on machinery
and components could facilitate the inflow
of European investment into Vietnam; in this
case, it can lead to a trade creation effects.
3.3.2. Impact on Vietnam’s machineries and
electronics industries
Firstly, in 2004-2009 Vietnam annual import
turnover of electronics increased by 33.6%
on average. From an import turnover of 2.6
bn. USD in 2005, after five years in 2008 it
tripled reaching 7.6 bn. The MFN tariff rate on
electronics is 13% (Table 4). For what concern
electronic sector, a simple business analysis
would endorse the conclusion that a reduction
in tariff would have definitely an impact on
the volume and prices of electrical products
and components imported from Europe.
Indeed, a reduction in tariff would at least
offset the costs of transport from Europe and
give a great business advantage to European
exporters vis-à-vis their Asian competitors
from Japan, Korea and China that are already
benefitting from lower distances and reduced
import duties (Claudio Dordi, 2011). In this
case, future Vietnam-EU FTA can lead to a
trade diversion effects because imports from
EU can replace imports from Japan, Korea
and China in the Vietnam’s market.
Secondly, concerning Vietnam’s machineries
industry, the EVFTA can lead to a trade
diversion effects. Table 3.3 shows that
machineries industry takes an 18.8 per cent
EXTERNAL ECONOMICS REVIEW
17
RESEARCH ON ECONOMIC AND INTEGRATION
of the total Vietnam’s imports from EU. In
addition, the MFN tariff rate of this industry
is quite great, equal to 15.7% according
to the research of Vietnam-EU joint study
group, 2011. Over the years Vietnam has
been constantly increasing its demand for
high quality machineries and has thus relied
heavily on importations. In 2008 Vietnam has
imported 11.1 bn.USD worth of machinery.
In this respect, the EU has around 14% of the
market with 1.5 bn. of export to Vietnam. China
is the biggest import partner with 2.75 bn. of
export to Vietnam. For the machinery sector,
a reduction of the already low tariff applied by
Vietnam on the imports of machinery will not
result in a substantial increase in imports. On
the other hand, Vietnam could benefit from
a consistent surge of FDIs from European
manufacturers that could decide to locate here
the production. Indeed, the growing domestic
industries coupled with the general economic
growth of Vietnam could have a domino effect
on all the other support industries, which are
now missing. In this respect, the general high
quality of the European products could have an
important market in Vietnam, and potentially
also in the neighboring countries, such as Laos
and Cambodia. ). In this case, future VietnamEU FTA can lead to a trade diversion effects
because imports from EU can replace imports
from China in the Vietnam’s market.
4. Conclusion
A Free Trade Agreement (FTA) between
Vietnam and the EU is expected to offer many
new opportunities, but also pose challenges
for Vietnam’s economy. Reduction on tax
rates for most of the products under the FTA
framework will give Vietnam an advantage
over its rivals in the EU market. According
to GSO, 2012, at present, the EU is imposing
18
EXTERNAL ECONOMICS REVIEW
high taxes on Vietnam’s main exports to the
market, including footwear (12.4 percent),
textiles and garments (11.7 percent), and
seafood (10.8 percent).
However, after the agreement is signed the
Vietnamese businesses will face certain
challenges, both sides of difficulties that may
arise thereafter. Firstly, technical barriers
related to epidemiology and hygiene as well
as animal and plant quarantines as challenges
for Vietnamese goods entering the EU market.
Secondly, product origins will be another
obstacle for Vietnamese businesses. The
EU presents the biggest challenges but the
development gap between both sides and the
competition pressure placed on Vietnamese
enterprises are also significant factors. To
coincide with the EU’s tax reduction move,
Vietnam will also have to cut taxes on
imported goods. How Vietnamese businesses
can survive and compete with similar items
imported from the EU, even on their own turf,
remains an open question. Lessons learnt from
joining the WTO in 2007 have shown that
increasing pressure from the outside will help
Vietnam improve its economy. Competition
with strong foreign businesses will push local
enterprises to either restructure themselves, or
fall apart.
This paper used the theory of trade creation
and trade diversion and gravity model to
evaluate impact of EVFTA on country
welfare. We reviewed existing bilateral
trade linkages between Viet Nam and the
EU countries and come to the conclusion
that there is a significant potential for Viet
Nam and the EFTA States to strengthen their
economic relationship by further developing
their framework for trade and investment. In
particular, we came to a positive conclusion
No 72 (4/2015)
RESEARCH ON ECONOMIC AND INTEGRATION
with respect to the feasibility of a FTA
between the EU countries and Viet Nam. The
quantitative result shows there is a negative
relationship between tariff rate and VNEU bilateral trade. In addition, qualitative
research shows that Vietnam-EU FTA will
offer many new opportunities; it perhaps
leads to trade creation in automotive industry.
Analysis of car industry in Vietnam shows
that this industry is now highly protected. So,
a tariff reduction in context of FTA will benefit
Vietnamese consumer and total country
welfare. Beside effect of trade creation, FTA
also poses challenges for Vietnam; it maybe
leads to trade diversion some industries like
electronics and machineries industries.q
References
1. Aitken, N.D. (1973): “The effect of the EEC and EFTA on European trade: A temporal
cross-section analysis”, American Economic Review, 63, 881-892.
2. Chaisrisawatsuk, S. and W. Chaisrisawatsuk, “Imports, exports and foreign direct investment
interactions and their effects”, Chapter IV in ESCAP, Towards coherent policy frameworks:
understanding trade and investment linkages – A study by the Asia-Pacific Research and
Training Network on Trade, (United Nations, New York), 2007, pp.97-115.
3. Claudio Dordi, Federico Lupo Pasini, “The impact of Vietnam – EU FTA on some selected
importing sectors of Vietnam”, wto center, 2011.
4. Cline, W.R, (1978), “Benefits and costs of economic integration in Central America,
Economic Integration in Central America: A Study”, ed. W.R. Cline and C. Delagado
(Washington, DC: Brookings Institution).
5. Diaw D., A. Rieber and T.A.D. Tran (2009), “On the role of Foreign Market Access in
South-South trade: Application to Sub-Saharan Africa and the Developing Asia”. Presented
at the international conference “Vietnam and East Asian countries facing the world crisis”,
Foreign Trade University (15 December 2009, Hanoi, Vietnam).
6. Emiko Fukase and Will Martin, “A Quantitative Evaluation of Vietnam’s Accession to the
ASEAN Free Trade Area (AFTA)”, World Bank report, 1999.
No 72 (4/2015)
EXTERNAL ECONOMICS REVIEW
19
RESEARCH ON ECONOMIC AND INTEGRATION
7. Kimberly A. Clausing,(Aug., 2001), “Trade Creation and Trade Diversion in the Canada
- United States Free Trade Agreement”, The Canadian Journal of Economics, Vol. 34, No.
3 677-696.
8. Krueger Anne.O, (1999), “Trade creation and diversion under NAFTA, National bureau of
economic research”, 1050 Massachusetts Avenue Cambridge, MA 02138, December 1999
9. Krugman, (1994), “Regionalism vs. multilateralism: analytical notes, New Dimensions
in Regional Integration”, ed. J. De Melo and A. Panagariya (Cambridge: Cambridge
University Press).
10.NGUYEN Binh Duong and TRAN Thi Anh Dao, « Sub-regional integration initiatives in
East Asia and their implication for Vietnam », Journal of Social and Policy Sciences, Vol 1,
Number 1, December 2010.
11.Nguyen T.X and Yuqing Xing, “Foreign direct investment and export the experiences of
Vietnam”, Economics of Transition, 2008, Vol 16, Issue 2, pp 183-197.
12.Rina Oktaviani, Amzul Rifin, and Henny Reinhardt, (2007), “An Investigation into the
Measures Affecting the Integration of ASEAN’s Priority Sectors, Review of Regional Trade
and Available Tariff Rate Data”, REPSF Project 06/001a , Department of Economics ,
Faculty of Economics and Management, Bogor Agricultural University.
13.The Vietnam-EFTA joint study group, “Report on the bilateral trade and investments
between Viet Nam and the EFTA States”, 2011.
14.Tumbarello, P, “Does Vietnam overtrade with its neighbouring countries? A regional
investigation using a gravity model”, IMF Selected Issues, 2006.
15.WTO center, “7th negotiation round of Vietnam – EU Free Trade Agreement”, 2014.
Sample countries
20
1. Autria
2. Belgium
15. Latvia
16. Lithuania
3. Bungaria
4. Cyprus
5. Crezch Republic
6. Denmark
7. Estonia
8. Finland
9. France
10.Germany
11.Greece
12.Hungary
13.Ireland
14.Italy
17. Luxumbourg
18. Malta
19. Netherlands
20. Poland
21. Portugal
22. Slovak Republic
23. Spain
24. Slovenia
25. Sweetden
26. Romania
27. United Kingdom
28. Vietnam
EXTERNAL ECONOMICS REVIEW
No 72 (4/2015)