Global warming, cyclone damages, and the issue of sustainable tourism in Southeast Asia
Bạn đang xem bản rút gọn của tài liệu. Xem và tải ngay bản đầy đủ của tài liệu tại đây (845.25 KB, 19 trang )
Tam Bang Vu & Eric Iksoon Im / Journal of Economic Development 23(1) 102-120
102
Global Warming, Cyclone Damages,
and the Issue of Sustainable Tourism
in Southeast Asia
TAM BANG VU
University of Hawaii-Hilo –
ERIC IKSOON IM
University of Hawaii-Hilo –
ARTICLE INFO
ABSTRACT
Article history:
This paper studies the feedback effect between damages caused by
cyclones and unsustainable tourism in Southeast Asia. The data are
constructed based on the Annual Tropical Cyclone Reports from the
United States National Climatic Data Center website for the period of
1995–2013. Establishing a cyclone damage index by combining the
maximum speed when each cyclone goes through a region and
characteristics of each region affected by cyclones in Southeast Asia,
we first attempt to quantify the two-way causality between these
cyclones and the proportion of tourist arrivals per capita. We then
analyze differences among the affected countries compared to the
aggregate effects. Based on the results, policy suggestions for
sustainable tourism are provided in order to mitigate the cyclone
damages.
Received:
Dec. 10 2015
Received in revised form:
Dec. 12 2015
Accepted:
Dec. 30 2015
Keywords:
Southeast Asia, cyclone
damages, sustainable
tourism, feedback effect.
Tam Bang Vu & Eric Iksoon Im / Journal of Economic Development 23(1) 102-120
103
1. Introduction
The past twenty years have witnessed rapid growth in tourist arrivals in Southeast
Asia (SEA). However, the same period has also observed rises in the intensity of the
cyclones in the SEA region even though the number of the events has decreased slightly.
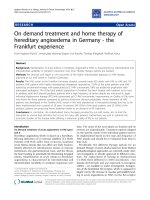
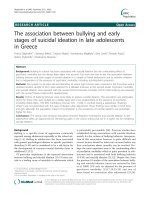
Figure 1 demonstrates this increasing frequency of the cyclones with the speed greater
than 100 knots (185 km per hour/kph) that occurred in the Pacific and Indian Oceans in
general and the ones landed in the SEA countries in particular over the past forty years.
There are concerns that unsustainable tourism contributes in part to the global warming
due to greenhouse-gas emissions and environmental pollution. This rising temperature
is believed to be one of the causes for the rising intensity of the cyclones and the increase
in cyclone damages worldwide.
12
10
8
6
4
2
All Cyclones
Cyclones Landed in SEA
0
Figure 1. Number of cyclones greater than 100 knots in Pacific and Indian Oceans
Sources: US National Climatic Data Center, US National Oceanic and Atmospheric Administration
Given the potential destruction caused by cyclones and the danger of unsustainable
tourism in addition to the inconsistent results in the existing literature, it is crucial to
study the possible feedback effects between cyclones and unsustainable tourism in order
to mitigate cyclone damages. This paper investigates the impact of cyclones from the
Pacific and Indian Oceans on tourism in SEA and the possible reversed impact of
unsustainable tourism on cyclone damages. A panel dataset on storm frequency and
intensity in SEA is constructed based on information provided by the US National
Oceanic and Atmospheric Administration (NOAA). We first set out to find the impact
104
Tam Bang Vu & Eric Iksoon Im / Journal of Economic Development 23(1) 102-120
of these disasters on aggregate ratio of tourist arrivals to population in these countries.
Next, we examine country differences which are potentially caused by country specific
characteristics. Finally, we propose prevention measures through sustainable tourism.
2.
Theoretical framework
Before 2006 literature on disasters could not find the link between rising temperature
and the increasing intensity of the cyclones or the cyclone damages. One of the first
papers that provided concrete results was authored by Michaels et al. (2006). These
scholars found that there is a threshold of sea-surface temperature (SST) where a tropical
storm develops into a typhoon. Specifically, when the SST is exceeding 28.25 o C, the
link between the rising temperature and the increasing intensity of the cyclones becomes
clear. Another paper that found evidence is written by Knutson et al. (2007), who used
simulation technique and predicted that the intensity of the Pacific cyclones would
increase due to global warming.
Bender et al. (2010), in a similar paper, also confirmed the link between rising
temperature and the intensity of the Atlantic cyclones. Overall, Mendelsohn et al. (2012)
pointed out that climate change increases the frequency of high-intensity storms in
selected ocean basins depending on the climate model in each region. Most recently,
Estrada et al. (2015) showed the intensity of hurricanes as well as the damages due to
cyclones both increase with the rising temperature in the North Atlantic basin. This
tendency is evident even for the US, one of the countries best prepared for countering
cyclone damages. Specifically, in 2005 between 2 billion and 14 billion US dollars of
the cyclone damages were attributed to climate change in the country.
Regarding the SEA region, Chang (2010) asserted that there is enough evidence to
show the link between high temperature and the rising frequency of the super storms in
SEA. Since Michaels et al. (2006) have already stipulated the threshold of 28.25o C, it
is easy to understand Chang’s result for SEA, which likely has SST exceeding this
threshold. The article also carried out a case study of an anomalous storm event in
Southeast Asia as an example of the link between global warming and increasing cyclone
damages: cyclone Vamei and the extremely high rainfall caused by global warming
in December 2006 in Malaysia. The author then called for increasing preparedness to
face climate changes.
Tam Bang Vu & Eric Iksoon Im / Journal of Economic Development 23(1) 102-120
105
Cyclones cause substantial damages to tourism. Most people still remember Super
Typhoon Haiyan, which killed 6,340 people in the Philippines and destroyed most of the
tourist facilities on November 8, 2013, before landing in Vietnam on November 11.
Although it had weakened significantly, Haiyan still packed heavy rain and winds of 110
kph in North Vietnam, uprooting hundreds of trees and tearing roofs off homes.
Recently, hundreds of tourists were stranded on islands in Quang Ninh Province as
Tropical Storm Kujira made its landfall on June 24, 2015. While 172 tourists were
evacuated by ships at Quan Lan Island, shipping was halted due to high wind on Co To
Island, stranding about 500 tourists.
Nevertheless, many authors found that the long-term effects of cyclones are not clear
although their short-term effects are negative. The impacts are also more severe in
developing countries than in developed ones. In addition, the research results are not
consistent. Bluedorn (2005) studied cyclone activities in developing countries of the
Central American and Caribbean region, showing that the median hurricanes will cause
output to fall by 0.3 percent, while Strobl (2008), examining the same region, suggested
a reduction in output by 0.8 percent. Coffman and Noy (2009) gave a detailed narration
of Hurricane Iniki in Hawaii and found that its shot-term effect on the Hawaiian
economy is small and that its long-term effect is insignificant.
Concerning tourism, Hitchcock and Parnwell (2010) discussed the historical
development of tourist arrivals in SEA and their contribution to the regional economies.
They indicated that the role of tourism in economic growth in SEA has been increasing
over the past twenty years. Mazumder et al. (2013) summarized six reasons that make
tourism important for the SEA countries. First, tourism yields foreign exchange earnings
used to import other goods. Second, tourism utilizes resources consistent with the
country’s factor endowment. Third, tourism increases employment in the host country.
Fourth, tourism encourages improvements in the infrastructure. Fifth, tourism fosters
technical transfers and knowledge spillovers. Finally, tourism creates linkages among
other sectors, such as agriculture, manufacture, and services.
However, unsustainable tourism can cause damages to the economy. UNESCO’s
“Save the Ifugao Terraces Movement” Team (2008) emphasized that unsustainable
tourism can destroy the environment in the host countries. Hitchcock and Parnwell
(2010) devoted three chapters on unsustainable tourism, including environmental
degradation. Le (2014) also pointed out that tourists can cause greater pollution and
106
Tam Bang Vu & Eric Iksoon Im / Journal of Economic Development 23(1) 102-120
landscape damages. In addition, the construction of new resorts and hotels are causing
deforestation and increasing wastes. These activities might contribute in part to the rise
in overall temperature due to tourists’ excessive use of air conditioners that increases
greenhouse-gas emissions and causes the increase in solid wastes raising the carbondioxide proportion in the air.
Hershberger (2014) outlined six challenges facing SEA tourism, namely endangered
species conservation, air pollution, destruction of coral reefs, deforestation, water
security, and disorganized urbanization. Ponnudurai (2015) analyzed the urgent issue of
environmental degradation due to unsustainable tourism in SEA. The author illustrated
the scientific forecasts that reveal a surge in heat extremes in the region due to
greenhouse-gas emissions and increasing solid wastes. The paper predicted that these
rising temperatures would lead to a significant increase in the maximum wind speed of
cyclones making landfall in Southeast Asia and a rise in cyclone damages due to the
subsequent heavy rains and flooding.
3. Data
Existing literature on the regional impact of cyclones often uses the number of
hurricane events or their maximum observed Saffir-Simpson scale. In reality, a cyclone’s
destructive impact on each country is very different, depending on the maximum wind
speed at each location and local characteristics of the region. In order to account for
these differences, we construct a dataset for this study.
The original dataset on the number and intensity of the SEA cyclones is based on the
Annual Tropical Cyclone Reports for the West Pacific, South Pacific, and Indian Oceans
provided by the Joint Typhoon Warning Center (JTWC) of the NOAA that posted the
information on the US National Climatic Data Center (NCDC) website for the period
between 1995 and 2013. To our best knowledge, this is the most comprehensive source
of cyclones for SEA.
In the West Pacific region, a cyclone with an estimated intensity of less than 34 knots
(63 kph) is called a "Tropical Depression," the one between 34 knots (64 kph) and 63
knots (116 kph) is designated a "Tropical Storm." A cyclone with an estimated intensity
between 64 knots (117 kph) and 129 knots (239 kph) is called a "Typhoon," while a
cyclone of 130 knots (240 kph) or greater is named a "Super Typhoon." In the Indian
Tam Bang Vu & Eric Iksoon Im / Journal of Economic Development 23(1) 102-120
107
Ocean and South Pacific Ocean, JTWC labels all cyclones as "Tropical Cyclones,"
regardless of estimated intensity.
The JTWC’s reports indicated no cyclone in Singapore and Brunei during 1995–
2013, so these two countries are eliminated from this study. Data for East Timor are not
comprehensive and therefore are also eliminated. Most of the cyclones that reached Laos
and Cambodia made their landfalls in Central and South Central Vietnam, interrupting
the flows of Vietnamese tourists to these two neighboring countries along the cyclone
trails. For example, Typhoon Yvette (27W) landed in South Central Vietnam on October
26, 1995, and continued its trail to reach Cambodia on October 27. Similarly, Typhoon
Fritz (22W) landed in Central Vietnam on September 25, 1997, reaching Laos on the
same day and Cambodia on September 26. Hence, the impacts of cyclones on the tourist
arrivals in Cambodia and Laos might still be significant although the cyclones had
become weak once they reached these two countries. For this reason, Cambodia and
Laos are included in the research.
Table 1 displays the distribution of the cyclones that went through the affected
countries in SEA during 1995–2013 based on the JTWC reports. The table shows that
the Philippines endures the highest frequency of cyclones with Vietnam coming in
second, whereas Laos endures the least and Cambodia, the second least. A panel dataset
on the cyclone-damage index in SEA is constructed based on the intensity of the
cyclones and the population density in each location where a cyclone made its landfall.
Table 1
Distribution of cyclones in affected SEA countries during 1995–2013
Country
Total
Mean
Std. dev.
Max
Min
Cambodia
16
0.8421
0.5165
3
0
Indonesia
32
1.6842
0.7609
4
1
Laos
14
0.7368
0.4183
2
0
Malaysia
22
1.1579
0.6335
3
1
Myanmar
24
1.6842
0.5824
3
1
Philippine
93
4.8947
2.4549
14
3
Thailand
26
1.3684
0.7471
5
1
Vietnam
79
4.4159
2.1072
12
2
Sources: US National Climatic Data Center, NOAA Website
Tam Bang Vu & Eric Iksoon Im / Journal of Economic Development 23(1) 102-120
108
We use a proxy of financial destruction introduced by Emanuel (2005), who showed
that the financial losses due to cyclones tend to rise roughly to the cubic power of
maximum wind speed when the cyclone makes its landfall on a specific country. Hence,
he suggested a simplified power index that can serve to measure the potential
destructiveness of cyclones as follows:
T
PI V 3dt
(1)
t 0
where V is the maximum sustained velocity of the wind at the landfall, and T is the
lifetime of the storm as accumulated over time intervals t.
Granvorka and Strobl (2010) used a weight on each local characteristic to estimate
the effect of hurricane on tourism in the Caribbean. To account for the different
characteristics, they used the time varying population density of each location. The
justification is that of two equally affected areas in terms of wind speed, the one where
more people live is likely to endure more incurred damages. We combine the approach
in Emanuel (2005) and the one in Granvorka-Strobl (2010) by expressing the damage
index of cyclones in a country at time t based on the total damage due to the n = 1, 2,…,
N cyclones that affected county i during this time when they make landfall in locations
j = 1, 2, …, J as:
J
N
DAM i ,t wi , j,n,tV j,3t
(2)
j 1 n 1
where V is the maximum velocity of the wind due to storm n observed in country i at
time t, and w is the weight assigned according to the characteristic of the affected country
in terms of population density at the landfall location.
Data on the number of tourist arrivals, infrastructure, education at all levels, and
capital formation come from the World Development Indicators, posted on the World
Bank Group website. Data on other variables are found on the US Department of
Agriculture Website and International Monetary Fund (IMF) website. Since yearly data
on tourism and the other variables are only available from 1995 to 2013, this is chosen
as our estimation period. Table 2 presents descriptive statistics on tourism for the eight
SEA countries affected by cyclones.
Tam Bang Vu & Eric Iksoon Im / Journal of Economic Development 23(1) 102-120
109
Table 2
Tourist arrivals in eight SEA countries affected by cyclones
Period
1995–1998
1999–2003
2004–2008
2009–2013
Country
Mean
Mean
Mean
Mean
Cambodia
246500
585400
1663400
3069200
Std. dev.
33071
170227
437739
827563
Indonesia
4787250
4889000
5386800
7564600
Std. dev.
394353
285071
536285
951677
Lao PDR
136500
206800
871600
1869000
Std. dev.
70638
32790
356705
481589
Malaysia
6592250
10959400
18541200
24737000
Std. dev.
874850
2156306
2816741
751750
Myanmar
413250
482000
678800
1094800
Std. dev.
146286
70470
42775
543546
Philippines
2045250
1960000
2797600
3881600
Std. dev.
203093
137525
350862
646486
Thailand
7333250
9863600
13234800
19643400
Std. dev.
371799
820146
1474876
4977454
Vietnam
1548500
2261800
3690600
5846200
Std. dev.
154161
320840
553646
1504221
Source: World Development Indicators, World Bank Website
The table reveals Malaysia as the country with the most tourist arrivals, and Thailand
stands as the second. While Laos has started with the lowest number of tourists and
Cambodia, the second lowest during 1995–1998, they have the highest growth rates and
so surpassed Myanmar by 2004.
Data on real exchange rate and consumer price index are from the database for
international macroeconomic data, provided by the US Department of Agriculture
Website. The real exchange rates are expressed relative to US exchange rate, which is
110
Tam Bang Vu & Eric Iksoon Im / Journal of Economic Development 23(1) 102-120
normalized to unity. Inflation is measured by the consumer price index of each country.
Data on interest rate are from IMF website.
4. Methodology
Obtaining the dataset on damage index (DAM) constructed in Section 2, we estimate
a system of equations to account for the possible feedback effects among the variables:
K
TOURi ,t 1 DAM i,t k DAM i,t k X i ,t qi st i ,t
(3.1)
k 1
L
FEEDBCi ,t Zi ,t l Zi,t l vi wt i ,t
(3.2)
l 1
where TOUR is tourism and is estimated alternatively as the ratio of tourist arrivals to
population or the growth rate of this ratio, i is country index among SEA countries, t is
the time index measured in years. k and l are the number of lagged periods. DAM is the
damage index caused by the cyclones. FEEDBC is any variable in the right-hand sides
of the two equations that might cause feedback effects among the variables. X and Z are
two vectors of potential control variables that might affect the dependent variables in the
system. The last three variables in each equation are country specific effect, time specific
effect, and idiosyncratic disturbances, respectively.
We perform the Variance Inflation Factors (VIF) test as discussed in Kennedy (2008),
which recommended the elimination of any variable that has VIF greater or equal to 10.
After eliminating variables with high correlations using the VIF test, we perform the
RAMSEY RESET test for omitted variables as discussed in Kennedy (2008). The pvalue for the test is 0.415, implying that there is no important omitted variable.
We then perform Granger-causality tests as discussed in Kennedy (2008) to
investigate the possible feedback effects among variables in the system. The t-statistics
for tourism and the F-statistic for joint significance of the current and lagged values all
indicate that TOUR does Granger-cause DAM. This is different from the assumption of
the weak exogeneity of the disaster measures used in Skidmore and Toya (2002) that
used aggregate disaster measures instead of cyclone damages. In addition, we find that
there is a feedback effect between DAM and growth rate of per capita income, which is
one of the control variables.
Tam Bang Vu & Eric Iksoon Im / Journal of Economic Development 23(1) 102-120
111
The Dickey-Fuller tests as proposed in Kennedy (2008) reveal that the series are
stationary, and a Hausman test shows that a random effect is more appropriate than a
fixed effect model. Hence, the random effect three stage least square estimations
(RE3SLS) are employed instead of the panel VAR procedures. The Akaike Information
Criteria procedures also show that the models with one lagged values are the most
appropriate. Hence, System (4) of our structural equations can be expressed as:
TOURi ,t 1 DAM i,t 2 DAM i,t 1 1 PERCAi ,t 2 EXCi ,t 3 INFRAi ,t qi st i ,t
(4.1)
DAM i,t 1TOURi ,t 2TOURi ,t 1 1PERCAi ,t 2 EDUi ,t 3 INFRAi ,t ri ut ei ,t
(4.2)
PERCAi ,t 1 DAM i,t 2 DAM i,t 1 1TOURi ,t 2 INITi ,t 3CAP vi wt i ,t
(4.3)
where PERCA is growth rate of per capita income, EXC real exchange rates, INFRA
infrastructure, EDU education, INIT the initial value of per capita income, and CAP
capital formation.
Lagged dependent variables are used as instrumental variables (IVs), and the system
generalized method of moments (SGMM), as discussed in Bond (2002), is employed to
control for any problem caused by the lagged dependent variables. System (5) presents
the reduced forms so that predicted values from the regression results of System (5) can
be used as IVs for System (4):
PERCAi ,t 11PERCAi ,t 1 12 EXCi ,t 13 INITi ,t 14 INFRAi ,t e1i ,t
(5.1)
TOURi ,t p 21TOURi ,t 2 22 EXCi ,t 23 EDUi ,t 24 INFRAi ,t e3i ,t
(5.2)
DAM i,t p 31DAM i,t 2 32 INITi ,t 33CAPi ,t 34 INFRAi ,t e2i ,t
(5.3)
Having estimated System (5) using SGMM procedure for p = 0 and 1, we obtain
predicted value of PERCA in Eq. 5.1 as the IV for PERCA in Eq. 4.1, predicted value of
TOUR in Eq. 5.2 as the IV for TOUR in Eq. 4.2, and predicted value of DAM in Eq. 5.3
as the IV for DAM in Equations 4.1 and 4.3. System (4) is then estimated simultaneously
to avoid simultaneity bias using the RE3SLS approach.
112
Tam Bang Vu & Eric Iksoon Im / Journal of Economic Development 23(1) 102-120
5. Results and discussions
Table 3 reports the aggregate effects between SEA cyclones and tourism, TOUR,
which is defined as the ratio of tourist arrivals to population (T-RATIO) or growth rate
of this ratio (T-GROW). Panels (3a), (3b), and (3c) present the results for Equations 4.1,
4.2, and 4.3 respectively. We also present the sums of the current and lagged values in
the three panels, as well as the p-values for the tests of their significances. For example,
the effect of DAM on T-RATIO in the current period (short-term impact) is -0.22, and
the effect after one year (long-term impact) is -0.04. The composite impact is -0.26 (= 0.22 - 0.04), and the p-value for this sum is 0.048. This implies that a one percentage
point increase in the damage index decreases the tourist-arrival ratio to population in
SEA by 0.26 percentage points, and the effect is statistically significant. Similar
interpretations are applied to the other variables.
Panel (3a) also reveals that the overall effect of DAM on T-GROW in SEA is negative
and weakly significant for the current value, whereas it is negative and statistically
significant for the lagged value. The composite effect as shown by the sum of these two
values is negative and significant, also implying an adverse impact of cyclones on the
growth rate of tourist-arrival ratio to population.
Panel (3b) shows that the short-term effect of TOUR on DAM in SEA is not
statistically significant, but the long-term effect is statistically significant: the sum of the
current and lagged values for the tourist-arrival ratio to population is 0.16, and the pvalue for this sum is 0.041.The sum of the current and lagged values for the growth rate
of tourist ratio is 0.13, and the p-value for this sum is 0.032. They imply that the rise in
unsustainable tourism in SEA does increase the damage levels of the cyclones.
From Panel (3c) we see that the overall effects of DAM on growth rate of per capita
income (PERCA) are smaller than those effects on tourism although they are negative
and statistically significant for the current value, insignificant for the lagged value, and
the sum of these two values is negative and significant. These results are consistent with
the results in literature on the effect of natural disasters on per capita income in general,
and can be explained by increasing public investment in new capital after a cyclone
strikes as an effort to mitigate the damages caused by the disasters. It can also be
explained by the private sectors that try to redirect their resources to other high-returned
investments to offset the losses in the tourism sector.
Tam Bang Vu & Eric Iksoon Im / Journal of Economic Development 23(1) 102-120
113
Table 3
Aggregate effects of cyclones on tourism and feedback effects
Panel (3a)
Dependent variable: ratio of tourist arrivals to population or growth rate of this ratio
T-RATIO
T-GROW
Variable
Current
Lag
Sum
Current
Lag
Sum
DAM
-0.22**
-0.04*
-0.26**
-0.03*
-0.12**
-0.15**
(0.035)
(0.097)
(0.048)
(0.076)
(0.041)
(0.034)
PERCA
EXC
INFRA
0.13**
0.22**
(0.038)
(0.034)
0.06**
0.03**
(0.047)
(0.043)
0.06***
0.04**
(0.005)
(0.018)
Panel (3b)
Dependent variable: cyclone damages
Variable
TOUR
PERCA
EDU
INFRA
Current
Lag
Sum
Current
Lag
Sum
0.02
0.14**
0.16**
0.01
0.12**
0.13**
(0.122)
(0.036)
(0.041)
(0.218)
(0.049)
(0.032)
0.12**
0.06**
(0.031)
(0.029)
-0.04**
-0.02**
(0.043)
(0.028)
-0.02**
-0.03**
(0.035)
(0.038)
114
Tam Bang Vu & Eric Iksoon Im / Journal of Economic Development 23(1) 102-120
Panel (3c)
Dependent variable: growth rate of per capita income
Variable
Current
Lag
Sum
Current
Lag
Sum
DAM
-0.04**
0.01
-0.03**
-0.02**
0.01
-0.01
(0.022)
(0.154)
(0.019)
(0.045)
(0.218)
(0.037)
TOUR
0.03**
0.04***
(0.011)
(0.000)
INIT
-0.03*
-0.01*
CAP
0.54***
0.29***
(0.003)
(0.006)
Number of observations
144
p-value for the F-test of the model
0.000
Average RMSE
0.214
p-value for AR(1)
0.216
p-value for AR(2)
0.542
p-value for heteroscedasticity
(White) test
0.365
Note: *, **, and *** denote significance levels of 10%, 5%, and 1% respectively. The p-values are in
parentheses.
The signs and significance levels of the control variables in each panel of Table 3 are
as expected. For example, an appreciation of the real exchange rate decreases tourist
arrivals, whereas improved infrastructure attracts more tourists. Note that an
appreciation (or depreciation) of the real exchange rate is represented by a decrease (or
increase) in the domestic currency required to exchange for one US dollar. Hence, the
estimated coefficients of EXC have positive signs (a data point on domestic currency
with a higher value relative to the US dollars implies a depreciation of the domestic
currency and increases tourist arrivals).
We then proceed to investigate the feedback effects of the two benchmark
variables―DAM and TOUR―in each country. Seven dummies are generated for
Cambodia (CAM), Indonesia (INDO), Laos (LAO), Malaysia (MAL), Myanmar
Tam Bang Vu & Eric Iksoon Im / Journal of Economic Development 23(1) 102-120
115
(MYAN), the Philippines (PHIL), and Thailand (THAI). These dummies are interacted
with the above benchmarks variables to form slope dummies for the study. Vietnam
(VIET) is used as the base-group dummy.
Table 4 reports the results of the benchmark variables in three panels equivalent to
those in Tables 3. The estimated coefficients of the original variables are for VIET. For
the other countries the first column presents the estimated coefficients of each dummy,
which is expressed as the comparative value of the dummy to VIET, whereas the second
column presents the absolute values for each country by calculating the sum of each
dummy coefficient and that of VIET. We then test for the significances of these sums
and report their p-values in each panel.
Table 4
Feedback effect of cyclones and tourism in SEA: Individual countries
Panel (4a)
Dependent variable: ratio of tourist arrivals to population or growth rate of this ratio
T-RATIO
Variable
Comparative
DAM (VIET)
CAM
INDO
LAO
MAL
MYAN
PHIL
T-GROW
Absolute
Comparative
Absolute
-0.24***
-0.14**
(0.009)
(0.026)
0.14**
-0.07*
0.10**
-0.04*
(0.044)
(0.065)
(0.031)
(0.075)
0.07**
-0.17**
0.02**
-0.12**
(0.028)
(0.032)
(0.045)
(0.033)
0.18**
-0.06*
0.09**
-0.05*
(0.048)
(0.079)
(0.035)
(0.064)
0.12**
-0.12**
0.05**
-0.09**
(0.042)
(0.039)
(0.034)
(0.043)
0.08**
-0.16**
0.03**
-0.11**
(0.031)
(0.026)
(0.046)
(0.035)
-0.25***
-0.49***
-0.15***
-0.29***
116
Tam Bang Vu & Eric Iksoon Im / Journal of Economic Development 23(1) 102-120
T-RATIO
Variable
THAI
T-GROW
Comparative
Absolute
Comparative
Absolute
(0.002)
(0.000)
(0.006)
(0.008)
-0.03**
-0.27**
-0.01**
-0.15**
(0.024)
(0.038)
(0.041)
(0.023)
Panel (4b)
Dependent variable: cyclone damages
Variable
Comparative
TOUR (VIET)
CAM
INDO
LAO
MAL
MYAN
PHIL
THAI
Absolute
Comparative
Absolute
0.14**
0.12**
(0.027)
(0.032)
0.03**
0.17**
0.03*
0.15**
(0.035)
(0.047)
(0.044)
(0.036)
0.03**
0.17**
0.02**
0.14**
(0.025)
(0.032)
(0.046)
(0.021)
0.04**
0.18**
0.02**
0.14**
(0.025)
(0.049)
(0.034)
(0.026)
-0.01
0.14**
0.01
0.12**
(0.274)
(0.027)
(0.396)
(0.032)
0.05**
0.19**
0.04**
0.16**
(0.039)
(0.028)
(0.026)
(0.033)
0.07**
0.21**
0.06**
0.17**
(0.031)
(0.046)
(0.032)
(0.024)
-0.01
0.14**
0.01
0.12**
(0.405)
(0.027)
(0.621)
(0.032)
Tam Bang Vu & Eric Iksoon Im / Journal of Economic Development 23(1) 102-120
117
Panel (4c)
Dependent variable: growth rate of per capita income
Variable
Comparative
DAM (VIET)
CAM
-0.06**
-0.02**
(0.035)
(0.041)
0.006
-0.02**
(0.217)
(0.035)
(0.386)
(0.041)
0.015*
-0.045**
0.008*
-0.012**
(0.079)
(0.049)
(0.064)
(0.035)
0.005
-0.06**
-0.003
-0.02**
(0.275)
(0.035)
(0.602)
(0.041)
0.045***
-0.015**
0.018***
0.002
(0.007)
(0.046)
(0.003)
(0.534)
0.006
-0.06**
-0.004
-0.02**
(0.291)
(0.035)
(0.367)
(0.041)
0.024**
-0.036**
0.005**
-0.015**
(0.029)
(0.045)
(0.034)
(0.031)
0.043**
-0.017**
0.009**
0.011**
(0.018)
(0.023)
(0.043)
(0.037)
MYAN
THAI
Absolute
-0.06**
LAO
PHIL
Comparative
-0.008
INDO
MAL
Absolute
Number of observations
144
p-value for the F-test of the model
0.000
Average RMSE
0.098
p-value for AR(1)
0.298
p-value for AR(2)
0.425
p-value for heteroskedasticity (White) test
0.396
Note: *, **, and *** denote significance levels of 10%, 5%, and 1% respectively. The p-values are in
parentheses.
Panel (4a) reveals that Vietnamese tourism endures slightly less cyclone damages
than the average for SEA. Considering that the number of cyclones landed in Vietnam
is more than twice the average in SEA, this is an encouraging result. The effect of
cyclone damages in Thailand is about the same as the average; those in Laos and
Cambodia are much less than average and only weakly significant, whereas those in
118
Tam Bang Vu & Eric Iksoon Im / Journal of Economic Development 23(1) 102-120
Indonesia, Malaysia, and Myanmar are all clearly below the average. The Philippines
suffers the heaviest losses (more than twice the average for SEA).
Panels (4b) shows that cyclone damages due to unsustainable tourism in Vietnam are
also slightly lower than the average; those for Cambodia, Indonesia, Laos, and Myanmar
are slightly higher than the average, whereas those for Malaysia and Thailand are about
the average. The damages in the Philippines are again much higher than the average for
SEA.
Panel (4c) demonstrates that the effects of cyclone damages on per capita income are
smaller than those on tourism for all of the SEA countries. These results imply that most
countries have made efforts to reinvest in new capital and infrastructure after a cyclone
strikes, or to redirect their resources to other sectors in the economy so that these
resources can be used more efficiently.
6. Policy suggestions and conclusion
Based on the estimated results, the following policies can be implemented to foster
sustainable tourism and reduce the cyclone damages.
First, encourage tourists to practice responsible uses of resources during their stays in a
hotel, such as turning off air conditioners when they go out, turning on fans in addition to air
conditioners when they are in hotel rooms, and avoiding continuously running water in
bathrooms, especially at washstands. Extra charge might be imposed beyond a certain level
of usage as a preventive measure.
Second, increase the uses of other transportation modes other than private cars or
motorcycles, such as busses, trolleys, subways, bicycles, and walking streets to reduce air
pollution.
Third, impose fines to individual tourists or organizations engaging in any activity that
causes deforestation, the number-one cause of increasing cyclone damages due the flash
floods after a cyclone strikes.
Fourth, encourage reforestation to block high wind and reduce land erosion that increases
the level of flash floods after a cyclone makes its landfall.
Finally, prevent disorganized urbanization due to excessive development of new tourist
facilities that increases deforestation, traffic jams, environmental pollution, solid wastes, and
Tam Bang Vu & Eric Iksoon Im / Journal of Economic Development 23(1) 102-120
119
contributes further to greenhouse-gas emissions that raise the air temperature and increase
the cyclone-damage levels.
In sum, this paper shows that there is a two-way causality where cyclone damages reduce
tourist arrivals, which in turn exacerbate the cyclone-damage levels due to unsustainable
tourism. Hence, it is crucial to practice the aforementioned policies for sustainable tourism
in order to mitigate the impacts of cyclones on economic development.
Similar to any empirical research, better data will yield more reliable results. Ideally, one
can repeat the exercises with data on tourist expenditures, which are only available for the
period of 2003–2013 at this moment. Hence, the lack of comprehensive data on tourist
expenditures in addition to the data on tourist arrivals hinders a complete examination of the
issue between cyclones and sustainable tourism. When tourist-expenditure data becomes
available for a longer period, new estimations should be performed to obtain more
comprehensive and precise results
References
Bender, M. A., Knutson, T. R., Tuleya, R., Vecchi, G. A., Sirutis, J. J., Garner, S. T., & Held, I. M. (2010).
Modeled impact of anthropogenic warming on the frequency of intense Atlantic hurricanes. Science,
327(5964), 454–458.
Bluedorn, J. C. (2005). Hurricanes: Intertemporal trade and capital shocks (Nuffield College Economics
Paper 2005-W22).
Bond, S. R. (2002). Dynamic panel data models: A guide to micro data methods and practice (CEMMAP
Working Paper, CWP09/02). London, UK: Centre for Microdata Methods and Practice.
Chang, C. H. (2010). The impact of global warming on storms and storm preparedness in
Southeast Asia. Kajian Malaysia, 28(1), 53–76.
Coffman, M., & Noy, I. (2009). Hurricane Iniki: Measuring the long-term economic impact of a natural
disaster using synthetic control (University of Hawaii Economics Working Paper 09-05). HI:
University of Hawaii Economics.
Emanuel, K. (2005). Increasing destructiveness of tropical cyclones over the past 30 years. Nature, 4, 686–
688.
Estrada, F., Botzen, W. J., & Tol, R. S. J. (2015). Economic losses from US hurricanes consistent with an
influence from climate change. Nature Geoscience, 8, 880–884.
Granvorka, C., & Strobl, E. (2010). The impact of hurricanes strikes on the tourism in the Caribbean (UWI
Conference
Paper).
Retrieved
from
/>documents/C%20Granvorka.pdf
120
Tam Bang Vu & Eric Iksoon Im / Journal of Economic Development 23(1) 102-120
Hershberger, M. (2014). Six environmental challenges facing Southeast Asia. Retrieved from
/>Hitchcock, M., King, V. T., & Parnwell, M. (eds.) (2010). Tourism in Southeast Asia: Challenges and new
directions. HI: University of Hawai‘i Press.
IMF. (2015). IMF finances. Retrieved from />Joint Typhoon Warning Center. (2015). Annual tropical cyclone reports. US National Climatic Data
Center,
National
Oceanic
and
Atmospheric
Administration.
Retrieved
from
/>Kennedy, P. (2008). A guide to econometrics (6th ed.). MA: MIT Press.
Knutson, T. R., Sirutis, J. J., Garner, S. T., Held, I., & Tuleya, R. (2007). Simulation of the recent
multidecadal increase of Atlantic hurricane activity using an 18-km-grid regional model. American
Meteorological Society BAMS, 1549–1565.
Le, T. (2014). Sustainable tourism: A balancing act. Retrieved from
/sustainable-tourism-a-balancing-act/
Mazumder, M. N. H., Sultana, M. A., & Al-Mamun, A. (2013). Regional tourism development in
Southeast Asia. Transnational Corporations Review, 5(2), 60–76.
Mendelsohn, R., Emanuel, K., Chonabayashi, S., & Bakkensen, L. (2012). The impact of climate change
on global tropical cyclone damage. Nature Climate Change, 2, 205–209.
Michaels, P. J., Knappenberger, P. C., & Davis, R. E. (2006). Sea-Surface temperatures and tropical
cyclones in the Atlantic basin. Geophysical Research Letters, 33, l–4.
Ponnudurai, P. (2015). Climate change conjures up 'alarming' scenarios in Southeast Asia. Retrieved from
07022013165938. html
Skidmore, M., & Toya, H. (2002). Do natural disasters promote long-run growth? Economic Inquiry, 40(4),
664–687.
Strobl, E. (2008). The macro-economic impact of natural disasters in developing countries: Evidence from
hurricane strikes in the Central American and Caribbean region. Retrieved from />8957&ID_FICHE=13021.
US Department of Agriculture. (2015). International macroeconomic data set. Retrieved from
/>World Bank Group. (2015). International tourism, number of arrivals. Retrieved from
/>