Determinants of Vietnam’s outward direct investment: The case of Cambodia
Bạn đang xem bản rút gọn của tài liệu. Xem và tải ngay bản đầy đủ của tài liệu tại đây (955.22 KB, 27 trang )
Journal of Asian Business and Economic Studies
Volumn 25, Special Issue 01 (2018), 24-49
www.jabes.ueh.edu.vn
Journal of Asian Business and Economic Studies
Determinants of Vietnam’s outward direct investment:
The case of Cambodia
VO THANH THUa, LE QUANG HUYb, LE THI BICH DIEPc
a
University of Economics HCMC
b
University of Finance-Marketing
c
Ho Chi Minh City University of Technology
ARTICLE INFO
ABSTRACT
Received 01 Oct. 2015
This research focuses on the determinants of Vietnam’s outward FDI by
studying simultaneously the influence of two pull factors and push
factors. In addition, the work examines the differences in assessing the
impact of two factors groups on investment decisions by market entry
method. The authors conduct qualitative research interviewing six
experts as the managers have an important role in the decision to
invest directly abroad for their business and quantitative research by
multiple regression methods studying samples consisting of 248
enterprises. Push factors group from Vietnam includes competitive
pressure of Vietnam market, monetary policy, interest rates of Vietnam,
regulations and procedures for licensing investment abroad of
Vietnam, incentive policy, and investment incentives to overseas. Pull
factors group from host country includes culture–geography,
macroeconomics and market, infrastructure, regulations and policies
related to investment. Through two groups of factors, the authors
withdraw into four groups that impact the Vietnam’s FDI abroad
including: (i) culture–geography, (ii) infrastructure; (iii) the macroeconomic and market; and (iv) regulations and policies related to
investment. The results indicate that two groups of factors, both pull
factors and push factors, have impact on Vietnam’s FDI abroad.
Revised 20 Dec. 2015
Accepted 1 Jan. 2018
Available online
12 January 2018
JEL classifications:
E22; F21; H54
KEYWORDS
FDI
Vietnam’s OFDI
FDI from Vietnam
a
Email: *, correspondent author
Email:
c
Email:
b
Vo Thanh Thu et. al. / JABES Vol. 25(Special 01), Feb. 2018, 24-49
25
1. Introduction
At the end of 20th and the beginning of the 21st centuries, one of the characteristics of
the process of international economic integration was the intensification of direct investment
abroad, not only the industrialized countries, but also developing countries (OECD, 2008).
Many scientific studies explain the role of offshore direct investment for investors seeking
to find effective returns from attractive returns in markets (Agarwal, 1980; Moosa, 2002); or
to make diversification (Markowitz, 1959; Moosa, 2002; Rose et al., 2005); or affected by the
output and market size of the host countries (Moore, 1993; Wang et al., 1995). Kerinin et al.
(1999) concluded that "protection of market share is the most important motive for FDI".
About the role of FDI in attracting countries, according to the OECD (2008), FDI creates
a spillover effect on technology, supports human capital investment, contributes to
international trade integration, helps create competitive business environment, and increase
the development of business. All of them contribute to boosting economic growth and is
seen as an effective tool for economic growth in developing countries. Grossman et al. (1991)
and Hermes et al. (2003) found that FDI plays an important role in modernizing and
promoting the development of the economy in the recipient country. Johnson (2005), in the
study of the impact of FDI on economic growth, concluded that FDI impacts on receiving
countries, especially developing country groups, are mainly through physical capital and
technology, In particular, technology is the key factor. Kemp’s (1962) with marginal
productivity theory explained that capital mobility is due to differences in marginal
productivity. Capital moves from low margin to high margin. This theory is based on the
perfect market assumption that there is no risk, so profit is the only variable of the
investment decision. As a result, a country with abundant capital has a lower return on
capital than a country with limited capital. However, this theory does not explain why
capital flows are moving away from a country, and theories do not explain why countries
lack capital and high technology like Vietnam where companies directly invest abroad?
What are the factors from the capital exporter and from the capital importer impact on direct
investment from one developing country to another developing country? What factors affect
the intention to invest abroad of enterprises from developing countries that have little
capital, technology is not high and have not built up a valuable brand? We need research
for exploring these and then contributing to the richness of economic science in various
aspects.
Recognizing the benefits of OFDI, since 1989, when Vietnam did not have regulations on
investment activities abroad, the first project with a total investment of nearly 564 thousand
USD invested in Laos. By October 2015, Vietnam has had 1032 investment projects in 65
countries and territories of all five continents. Among the countries that Vietnam investing
overseas, the Kingdom of Cambodia is the second largest country in terms of total number
of projects and investment capital. By the end of October 2015, Vietnamese businesses have
26
Vo Thanh Thu et. al., JABES Vol. 25(Special 01), Feb. 2018, 24-49
registered 184 projects and more than $3.6 billion invested in Cambodia, accounting for
17.8% of total projects and nearly 16,8% of the total registered investment capital of Vietnam.
However, according to the survey of the Association of Investors in Cambodia and the
comments of the consultative group of direct investment activities of Vietnamese enterprises
in Cambodia, these results still have many problems, the investment results commensurate
with the potential for offshore investment of Vietnamese enterprises. Therefore, the study
to find out the factors that affect the impact of the investment of Vietnamese enterprises in
Cambodia is very significant. To date, there have been many studies in the world that
investigate factors affecting OFDI (Goh, 2011; Masron et al., 2010; Gammeltoft, 2008; Cheng
et al., 2007; Deng, 2004; Andreff, 2003). However, all of them often focus on push factors or
focus on pull factors, which are relatively few study examines the synergies of both groups
(Aykut et al., 2004). Therefore, with the desire to consider the impact of both push and pull
factors on investment decisions abroad, the authors propose to study the topic:
“Determinants of Vietnam’s outward direct investment: The case of Cambodia”.
2. Theoretical background
According to the OECD (2008), Foreign Direct Investment (FDI) is a category of
investment that reflects the objective of establishing a lasting interest by a resident enterprise
in one economy (direct investor) in an enterprise (direct investment enterprise) that is
resident in an economy other than that of the direct investor.
Many theories try to explain the activity and development of FDI, such as perfect market
theory, imperfect market theory, internationalization theory, locational theory, etc.
According to the perfect market theory, FDI enterprises to seek different return rate in the
market (Agarwal, 1980; Moosa, 2002) or to make the diversification (Markowitz, 1959;
Moosa, 2002; Rose et al.,2005) or be affected by output and the market scale of capital flow
(Moore, 1993; Wang et al., 1995). Locational theory assumes that the FDI exist due to the
immobility of a number of factors of production such as labor, natural resources, etc. (Horst,
1972; Wheeler et al., 2001).
Besides studying the internal factors of the business, there are many studies to examine
the external factors impacting FDI (Lu et al., 2011; Goh, 2011; Masron et al., 2010;
Gammeltoft, 2008; Cheng et al., 2007; Deng, 2004; Andreff, 2003). In that trend, two research
ways have been taken place which are the researches focus of the promoting factors from
domestic countries (Lu et al., 2011; Masron et al., 2010; Kayam, 2009; UNCTAD, 2006) and
the researches focus on attracting factors from foreign countries (Anil et al., 2014; Duanmu
et al., 2009; Dunning, 2002; Sun, 2002).
In 2009, Kayam conducted empirical research to test domestic factors that motivate
offshore direct investment firms. Through the results of linear regression with secondary
data, he suggests that there are differences between the factors motivating Asian, African
Vo Thanh Thu et. al. / JABES Vol. 25(Special 01), Feb. 2018, 24-49
27
and African companies to decide to invest abroad. In particular, the level of competition in
the domestic market will positively affect the offshore direct investment of Asian, American
and African companies. But, the labor-population ratio has a negative impact on OFDI in
Asia and Africa. Infrastructure has significant implications for FDI from Asia. Inflation and
economic development have a negative impact on OFDI from the Americans.
In the same study, Masron et al. (2010) looked at factors influencing Malaysian and Thai
firms' offshore investment decisions during the period 1980–2006, consisting (i) market
conditions; (ii) cost of production; (iii) domestic business conditions; and (iv) government
policy. The results of the linear regression analysis show that all four factors affect the
decision to invest abroad. In particular, domestic market conditions play the most important
role in economic factors, followed by government incentives.
With his research results, Lu et al. (2011) also stated that there are three factors affecting
the decision to invest abroad of Chinese enterprises. They are the resources of the business
itself, the domestic market and the support of the government in the country. In particular,
the support of the government is the strongest factor influencing the decision to invest
abroad. The Lu et al.’s research model was tested using a Structural Equation Modeling
(SEM) with 883 companies from seven provinces in China responding to the survey.
In conclusion, according to this research, researchers believe that the incentive for
enterprises to invest in foreign countries may be because the domestic market is no longer
attractive (Lu et al., 2011; Masron et al., 2010; Kayam, 2009; UNCTAD, 2006), the cost of
doing business in the country is too high (Masron et al., 2010; Kayam, 2009), the resource is
increasingly exhausted or difficult to reach (Masron et al., 2010; UNCTAD, 2006),
infrastructure (Kayam, 2009). In addition, for FDI enterprises to have favorable conditions
to invest abroad, they need a great deal of support from local governments in making
regulations and policies (Lu et al., 2011; Masron et al., 2010; UNCTAD, 2006).
In 2002, Dunning conducted an empirical study of the factors influencing the choice of
locations for offshore direct investment by firms. By analyzing UNCTAD statistics from 1985
to 2001 in conjunction with expert interviews, Dunning pointed out that there are three
factors influence the choice of investment location as below:
(i) Policy on attracting investment, including: political-economic stability; preferential
policies in fdi; private sector development policy; visa entry and exit regulations; customs
policy; tax policy; open economy policy, integration level;
(ii) Group of economic factors, including: investment engines of multinational
corporations; the market size; the market demand; production resources; labor costs and
skills; business infrastructure; cost and business efficiency; education and training;
(iii) Group of utility factors for business, including: Post and telecommunication
system;financial and banking services system; administrative procedures; corruption
situation; social utility; protection of intellectual property rights and investors.
28
Vo Thanh Thu et. al., JABES Vol. 25(Special 01), Feb. 2018, 24-49
Duanmu et al. (2009) conducted a study examining the factors that attract foreign direct
investment from India and China. The factors considered are: (i) market; (ii) depreciation of
foreign currency; (iii) good institutional environment; (iv) geographical distance; (v)
political stability; and (vi) natural resources. With the research results, the authors conclude
that there are differences between the factors that attract investment from India and China.
In particular, the geographic distance and natural resources are not significant for the
attraction of investment from India. In addition, natural resources have no meaning in
attracting investment from China.
Anil et al. (2014) provided valuable information on investment attraction in emerging or
transitional countries. With data from seven Turkish companies investing in Romania, the
results show that there are four factors that motivate businesses to invest in foreign
countries: (i) operating costs; (ii) institutions (political stability, cultural identity,
international integration); (iii) resources; and (iv) attractive market. In general, the findings
of this study help to better understand the behavior of businesses as they invest in emerging
markets or transitions.
Focusing on attractiveness factors, researchers argue that firms that decide to invest in a
foreign country may derive from the attractiveness of the market in which they intend to
invest (Buckley et al., 2007; Dunning, 2002; Sun, 2002), low operating costs (Anil et al., 2014;
Dunning, 2002; Sun, 2002), geographically near or similar in culture (Anil et al., 2014;
Duanmu et al. 2009), business infrastructure (Dunning, 2004), business support by local
government (Anil et al., 2014; Duanm et al., 2009; Buckley et al., 2007; Dunning, 2002; Sun,
2002), or good international economic integration (Anil et al., 2014; Dunning, 2002).
In addition to these studies, Aykut et al. (2004) concluded that there are two groups of
factors influencing direct investment decisions abroad, including push and pull factors. By
using FDI inflows from the World Bank and the International Monetary Fund during the
1994–2000 period of three groups (OECD member countries, non-OECD countries,
developed countries), the analysis shows that when deciding to invest directly in foreign
countries, enterprises are affected by the following factors:
(i) Push factors group includes abundant domestic capital, rising labor costs, fierce
competition, low profitability and growth rates, regulations and policies. The government
encourages investment abroad.
(ii) Pull factors group includes large and rapidly growing markets, close geographical
and cultural similarities, cheap labor costs, abundant raw materials, development
infrastructure, open investment policy and many incentives.
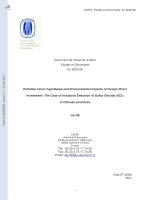
Summarizing works close to the topic of the study, we found that in addition to Aykut
et al. (2004), the majority of scientists studied in two separate directions in explaining the
causes of investment directly offshore (Figure 1). The first is the push factors (viewed from
the capital-exporting countries). The second is the pull factors attract foreign firms (viewed
from the capital-importing countries). Two these factors groups are summarized in Table 1
Vo Thanh Thu et. al. / JABES Vol. 25(Special 01), Feb. 2018, 24-49
and Table 2 below:
Figure 1. Simulation of factors affecting FDI’s decisions of enterprises
Table 1
Factors promoting investment from home country (push factors)
No
1
2
3
4
Push factors from the capital
outward country
Group
The size of the market of the
capital exporting country is not
large enough for development
The growth rate of domestic
market not meet expectation
Masron et al. (2010), UNCTAD (2006)
Market
Condition
The competitive pressure is very
high, making domestic business
difficult
5
6
The transport system between
the capital exporting and the
capital importing countries
Lu et al. (2011), Masron et al. (2010),
UNCTAD (2006), Aykut et al. (2004)
Lu et al. (2011), Masron et al. (2010),
Kayam (2009), UNCTAD (2006),
Aykut et al. (2004)
Labor cost is high
Cost of input raw materials is
high
References
Business costs
Masron et al. (2010), Kayam (2009),
Aykut et al. (2004)
Masron et al. (2010)
Infractructure
Kayam (2009)
29
30
No
7
8
9
10
Vo Thanh Thu et. al., JABES Vol. 25(Special 01), Feb. 2018, 24-49
Push factors from the capital
outward country
Availability of resources: land,
water, minerals are reduced,
difficult assessing
Group
Natural
resources
Regulations and procedures for
licensing investment abroad
The incentive and incentive
policies for overseas investment
of exporting countries
Regulations on natural resource
exploitation increasingly tight,
difficulties
References
Masron et al. (2010), UNCTAD (2006)
Lu et al. (2011), Masron et al. (2010),
UNCTAD (2006), Aykut et al. (2004)
Regulations
and policy
relating to
investment
Lu et al. (2011), Masron et al. (2010),
UNCTAD (2006), Aykut et al. (2004)
Lu et al. (2011), Masron et al. (2010),
UNCTAD (2006), Aykut et al. (2004)
Table 2
Factors attract investment from host country (pull factors group)
No
Pull factors from the capital
importing country
Factors group
Findings sources
Anil et al. (2014), Dunning (2002)
1
Market is available for a
development of some sectors
2
The market’s growth rate is fast
Anil et al. (2014), Duanmu et al. (2009),
Aykut et al. (2004), Dunning (2002),
Sun (2002)
3
The competitive pressure is
quite low
4
Labour cost is quite low
5
Cost of input raw materials is
quite low
6
Availability of resources: land,
water, minerals are reduced,
difficult assessing
Market
condition
Duanmu et al. (2009), Dunning (2002)
Anil et al. (2014), Aykut et al. (2004),
Dunning (2002), Sun (2002)
Business costs
Natural
resources
Anil et al. (2014), Dunning (2002)
Anil et al. (2014), Duanmu et al (2009),
Aykut et al. (2004), Dunning (2002),
Sun (2002)
Vo Thanh Thu et. al. / JABES Vol. 25(Special 01), Feb. 2018, 24-49
7
Regulations and procedures for
licensing FDI are convenient
Duanmu et al. (2009), Aykut et al.
(2004), Dunning (2002), Sun (2002)
Regulations
and policy
relating to
investment
8
Regulations on natural resource
exploitation easing.
9
Ownership of private property is
ensured
Duanmu et al. (2009), Aykut et al.
(2004), Dunning (2002), Sun (2002)
11
Geographical location of capital
importing countries compared
with capital exporting countries
Duanmu et al. (2009), Aykut et al.
(2004)
Culture geography
Duanmu et al. (2009), Aykut et al.
(2004), Dunning (2002)
12
Cultural similarity
Anil et al. (2014), Aykut et al. (2004)
13
Tranport system develop
Aykut et al. (2004), Dunning (2002)
14
Good Infrastructure for
industrial zones/export
processing zones
15
Reach closer to the customer
16
Serving local businesses
investing in importing capital
country (providing supporting
materials…)
17
18
19
International economic
integration (member of WTO,
enjoying general preferential
tariffs, bilateral and multilateral
trade agreements, etc.)
Government stability,
corruption, racial discrimination,
etc.
Good political relations with
capital exporting countries
31
Infractructure
Aykut et al. (2004), Dunning (2002)
Anil et al. (2014), Sun (2002)
Anil et al. (2014), Sun (2002)
Marketing
and sale
Anil et al. (2014), Dunning (2002)
Internationl
integration
Anil et al. (2014), Duanmu et al. (2009),
Vichea (2005), Dunning (2002)
Political risk
Anil et al. (2014), Vichea (2005),
Dunning (2002)
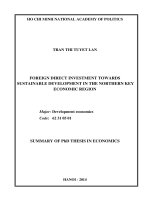
According to the theoretical study on FDI and Aykut's research model as well as related
empirical research (Table 1, Table 2), we identify two main groups influencing investment
activities of Vietnamese enterprises to Cambodia: push factors from Vietnam and pull
factors from Cambodia. We identify seven sub factors in these two groups, which jointly
affect the decision to invest in Cambodia (Figure 2): macroeconomics and markets (Anil et
al., 2014; Lu et al., 2011; Masron et al., 2010; Duanmu et al., 2009; Kayam, 2009; UNCTAD,
32
Vo Thanh Thu et. al., JABES Vol. 25(Special 01), Feb. 2018, 24-49
2006; Aykut et al., 2004; Dunning, 2002; Sun, 2002), labor costs, raw materials (Anil et al.,
2014; Masron et al., 2010; Kayam, 2009; Aykut et al., 2004; Dunning, 2002; Sun, 2002);
infrastructure (Kayam, 2009; Aykut et al., 2004; Dunning, 2002), regulations and policies
related to investment (Maslow et al., 2010; Duanmu et al., 2009; UNCTAD, 2006; Aykut et
al., 2004; Dunning, 2002; Sun, 2002), culture and geography (Anil et al., 2014; Duanmu et al.,
2009; Aykut et al., 2004), and political risk (Anil et al., 2014; Duanmu et al., 2009; Vichea,
2005; Dunning, 2002). The model hypotheses are as follows:
H1: Macroeconomic and market impact positively on investment decisions in Cambodia.
H2: Labor costs and material resources impact positively on investment decisions in
Cambodia.
H3: Infrastructure impacts positively on investment in Cambodia.
H4: Resources impact positively on investment decisions in Cambodia.
H5: Regulations and policies related to investment impact positively on investment
decision in Cambodia.
H6: Culture-geography impacts positively on investment decision in Cambodia.
H7: Political risk impacts positively on investment decision in Cambodia.
Macroeconomic and market
trường
H1(+)
Costs
0
H2(+)
0
H3(+)
Infrastructure
H4(+)
Natural resources
Cambodia
H5(+)
Regulations and policies
)
H6(+)
0
Culture-geography
FDI’s decision of Vietnam in
H7(+)
Political risk
Figure 2. Proposing research model
Vo Thanh Thu et. al. / JABES Vol. 25(Special 01), Feb. 2018, 24-49
33
3. Research method
The study used a combination of two methods: (i) qualitative research; and (ii)
quantitative research.
Qualitative research was conducted through group discussion with six experts who have
been investing directly in Cambodia. This study aims to adjust the scale. Specifically, in
addition to adjusting words and meanings for the observational variables to suit the
Cambodian market, the qualitative study added three observation variables for the
macroeconomic and market scale and cost scale. The results from the first 40 observations,
after the focus group discussions, enabled the authors to add three observation variables.
Finally, scales include the observable variables as shown in Table 3. The scales used in the
model are inherited and adjusted from Anil et al. (2014), Masron et al. (2010), Aykut et al.
(2004) and Dunning (2002). Specific scales are used as follows:
- Macroeconomics and markets: using scale of Aykut et al. (2004) and Dunning (2002).
- Cost: using scale of Masron et al. (2010), Aykut et al. (2004), Dunning (2002).
- Infrastructure: using scale of Masron et al. (2010), Aykut et al. (2004) and Dunning
(2002).
- Natural resources: using scale of Aykut et al (2004) and Dunning (2002).
- Relevant regulations and policies: using scale of Aykut et al (2004).
- Culture-geography: using scale of Aykut et al (2004).
- Political risk: using scale of Dunning (2002).
Table 3
Scales after adjustment through qualitative research
Variables
Definitions
Macroeconomics and markets
KT1
Cambodia market size is big enough for Vietnamese businesses to expand their
investment abroad
KT2
The low competitive pressure of the Cambodia market
KT3
Growth speed of the Cambodia market is fast
KT4
The macroeconomic environment of Cambodia is stable
KT5
Competitive pressure in the Vietnamese market increasing
KT6*
The monetary policy, interest rates of Vietnam or adverse changes for investors
KT7*
Cambodia enjoys a lot of tariff preferences of other countries than Vietnam (GSP
program, Import Tax = 0)
34
Vo Thanh Thu et. al., JABES Vol. 25(Special 01), Feb. 2018, 24-49
Costs
CP1
The cost of employing unskilled labor in Cambodia is low
CP2
The cost of using human resources and social insurance in Vietnam increased
CP3
The cost of transport and using infrastructure in Vietnam is increasing.
CP4
The cost of using infrastructure and mining in Cambodia is relatively low
CP5
The cost of implementing FDI projects in Cambodia is not high (applying for licenses,
administrative procedures to deploy FDI projects)
CP6*
The cost of skilled labor (governance and specialists) in Cambodia is relatively low
Infrastructure
HT1
The traffic system (bridges, ports, yards, vehicles ...) of Cambodia is convenient
HT2
Transport system connecting Vietnam and Cambodia is convenient (water, air, ...)
HT3
Information system, internet of Cambodia are convenient
HT4
Cambodia's electricity and water supply system meets the requirements of FDI
enterprises
HT5
Human resources in Cambodia meet the project requirements of Vietnam
HT6
Cambodia medical services meet the requirements of FDI enterprises
HT7
The traffic system (bridges, ports, yards, vehicles ...) of Cambodia is convenient
HT8
Entertainment services of Cambodia meet the requirements of foreign investors
Natural resources
TN1
The availability of seafood in Cambodia is plentiful
TN2
The level of scarcity of marine resources in Vietnam is increasing
TN3
The availability of forest products in Cambodia is plentiful
TN4
The availability of agricultural products in Cambodia is plentiful
TN5
Minerals in Cambodia meet the mining requirements
TN6
Water resources in Cambodia are abundant
TN7
The availability of land for production and business in Cambodia is plentiful
Relevant regulations and policies
QC1
Regulations and procedures for licensing investment abroad of Vietnam is
increasingly convenient
QC2
Regulations and procedures for FDI licensing of Cambodia are easy
QC3
The incentive policy, investment incentives to overseas, especially with Cambodia of
Vietnam increasingly improved
Vo Thanh Thu et. al. / JABES Vol. 25(Special 01), Feb. 2018, 24-49
QC4
Cambodia's low resource regulation
QC5
The incentive policy, investment incentives for FDI of Cambodia are increasingly
improved
35
Culture - Geography
VD1
The attitude, religious beliefs of the two countries are quite similar
VD2
Both cultures and cuisines are quite similar
VD3
Customs and practices of the two countries are similar
VD4
Customs and practices of the two countries are similar
VD5
Cambodia and Vietnam are geographically close to each other
Political Risk
RC1
Cambodia and Vietnam have close political relationship
RC2
Cambodia's image is increasingly enhanced
RC3
Politics in Cambodia is becoming more stable
RC4
Racism in cambodia has been declining
RC5
The corruption of Cambodia is less and less
Investment decision in Cambodia
DT
*: Observed
Enterprises will invest/increase investment in Cambodia
variables are supplemented by experts.
From corrected scales, the formal questionnaire is established. The authors selected fivelevel Likert scale, with: (i) completely disagree; (ii) disagree; (iii) neutral; (iv) agree; and (v)
completely agree. Each sentence is a statement about a certain criterion in a concept of the
model. The formal questionnaire consists of 44 observational variables corresponding to
eight scales in the research model. Given the survey method, direct interview method is
considered the method that has the highest response rate. In addition, this method allows
the authors to clarify obscene statements with the respondent as well as reducing possible
deviations. For the above reasons, this study uses direct interview method to collect data.
However, with this method, the cost of implementation is quite high. Due to time
constraints, cost of implementation, research samples were selected according to the
convenient method and seed development. Accordingly, the survey was sent to businesses
in Ho Chi Minh City that have invested in Cambodia. Then, they would support information
about other businesses also investing or intending to invest in Cambodia through the
question for clarification (direct investment in Cambodia, intention to invest directly in
Cambodia, or no intention to invest directly in Cambodia).
The main data analysis method used for this study is the multiple regression analysis
36
Vo Thanh Thu et. al., JABES Vol. 25(Special 01), Feb. 2018, 24-49
(MLR). To obtain reliable estimates for this method the sample size should be large (Raykov
et al., 1995). However, at present the determination of how big the sample size is remains
unclear. In addition, the sample size depends on the method used for estimation (ML, GLS,
ADF, etc.). According to Hair (2010), the sample size is at least 100 to 150. According to
Hoelter (1983), the sample size is at least 200 (Nguyen et al., 2011). In addition, Bollen (1989)
considers that the sample size is at least 5 for an estimated parameter (Nguyen Dinh Tho et
al., 2011). In this study, all 44 parameters were estimated, so the sample size was at least 220.
However, the larger the sample size, the less the sampling deviation. Therefore, this study
produced 300 questionnaires for businesses operating at the Cambodia-Vietnam Friendship
Association and the Association of Investors in Cambodia, and questionnaires were sent
directly to Enterprises participating in the 3rd and 4th Vietnam-Cambodia Investment
Promotion Conference (600 delegates of government officials and enterprises participating
each time). From the results 248 valid votes were cast. Through the questionnaire, the
samples identified were those who have invested in the Cambodian market and those who
intend to invest in Cambodia (whose business is in Cambodia import, export,
transportation, tourism, etc.). Specifically, the sample structure is as follows:
Table 4
Sample description
Number of enterprises
Percentage (%)
Invested, is investing directly
33
13.3
Intent to invest (import, export, service)
215
86.7
Total
248
100
The collected data were processed and analyzed using software SPSS 20. Through this
data, the scales were evaluated for reliability using the Cronbach's Alpha coefficient. The
scale is accepted when the Cronbach's Alpha coefficient is greater than 0.6 (Nunnally &
Bernstein, 1994; Nguyen, 2011) and the coefficient of correlation-total ≥ 0.3. Next, observable
variables are validated through factor analysis (EFA). Factor loads are less than 0.35 and
weight differences less than 0.3 (Hair et al., 2009) will continue to be rejected. The method
used to extract the coefficients is Principal Components with Varimax rotation. The scale is
accepted when the deviation total is ≥ 50% (Nunnaly & Bernstein, 1994; Nguyen, 2011).
The linear multiple regression model (with Stepwise method) is used to determine what
factors actually influence the decision to invest in Cambodia of Vietnamese enterprises and
consider the magnitude of this impact.
Vo Thanh Thu et. al. / JABES Vol. 25(Special 01), Feb. 2018, 24-49
37
4. Analysis results of official research
4.1. Data description
Research data series have slight variation between mean value, maximum value,
minimum value and standard deviation. Most observational variables have left-handed
distributions, except for KT2, CP1, CP2, CP3, QC4 (skewness greater than 0). In terms of
distribution shape, all the observation variables are low in shape and imprisoned with two
long tails.
Table 5
Research data description
N
Min
Max
Mean
Std.
deviation
Skewness
Kurtosis
KT1
248
1
5
3.06
0.758
-0.101
-0.047
KT2
248
1
5
3.42
0.744
0.027
0.350
KT3
248
1
5
3.23
0.845
-0.304
-0.261
KT4
248
1
5
3.35
0.771
-0.439
0.642
KT5
248
1
5
3.16
0.746
-0.153
-0.302
KT6
248
1
5
3.67
0.822
-0.599
0.759
KT7
248
1
5
3.81
1.125
-0.592
-0.471
CP1
248
3
5
4.37
0.515
0.195
-1.160
CP2
248
3
5
4.46
0.508
0.053
-1.773
CP3
248
3
5
4.44
0.505
0.167
-1.742
CP4
248
2
5
4.13
0.758
-0.670
0.291
CP5
248
3
5
4.43
0.535
-0.107
-1.158
CP6
248
3
5
4.21
0.571
-0.018
-0.272
HT1
248
1
5
3.12
0.968
-0.371
-0.081
HT2
248
1
5
2.79
0.905
-0.175
0.017
HT3
248
1
5
3.07
0.973
-0.085
-0.289
HT4
248
1
5
3.00
0.975
-0.282
-0.370
HT5
248
1
5
3.21
0.831
-0.230
0.270
HT6
248
1
5
2.85
0.975
-0.207
-0.269
HT7
248
1
5
3.04
0.836
-0.210
0.401
38
Vo Thanh Thu et. al., JABES Vol. 25(Special 01), Feb. 2018, 24-49
N
Min
Max
Mean
Std.
deviation
Skewness
Kurtosis
HT8
248
1
5
3.82
1.129
-0.607
-0.471
TN1
248
1
5
3.28
0.940
-0.267
-0.287
TN2
248
1
5
3.21
0.727
-0.209
0.583
TN3
248
1
5
3.10
0.945
-0.348
-0.108
TN4
248
1
5
3.30
0.901
-0.534
0.436
TN5
248
1
5
3.35
0.860
-0.320
0.158
TN6
248
1
5
2.87
0.883
-0.234
0.316
TN7
248
1
5
3.18
0.805
-0.099
0.420
QC1
248
1
5
3.29
0.884
-0.143
-0.195
QC2
248
1
5
3.54
0.814
-0.440
0.284
QC3
248
1
5
3.54
0.843
-0.447
-0.095
QC4
248
1
5
2.94
0.882
0.118
-0.228
QC5
248
1
5
3.15
0.927
-0.217
-0.282
VD1
248
1
5
3.67
0.683
-0.385
0.590
VD2
248
1
5
3.32
0.769
-0.357
0.343
VD3
248
1
5
3.21
0.784
-0.345
-0.400
VD4
248
1
5
3.60
0.752
-0.334
0.142
VD5
248
1
5
3.43
0.963
-0.600
0.023
RC1
248
1
5
3.80
1.034
-0.896
0.458
RC2
248
1
5
3.87
0.913
-1.093
1.479
RC3
248
1
5
3.77
0.949
-0.835
0.640
RC4
248
1
5
3.44
1.059
-0.510
-0.387
RC5
248
1
5
3.75
0.948
-0.783
0.448
Y
248
2
4
3.23
0.334
-0.408
0.191
4.2. General assessment of scale reliability and factor analysis
After the scales are included in the assessment, the results show that six variables are
excluded due to ineligibility (corected item total correlation<0.3). Excluded variables are
KT7, CP4, HT3, HT8, TN1 and TN2. The Cronbach's alpha coefficients for these seven scale
groups are also eligible (Table 6). Thus, 37 observations of these seven scale groups are
Vo Thanh Thu et. al. / JABES Vol. 25(Special 01), Feb. 2018, 24-49
39
further included in the factorial exploratory analysis (EFA) for validity testing.
Table 6
Result of scale’s reliability
Scale mean
deleted
if
item
Scale variance if item
deleted
Corrrected Item Total Corelation
Cronbach's
Alpha if item
deleted
Macroeconomics and markets: α = 0.798
KT1
16.84
7.874
0.588
0.759
KT2
16.48
7.919
0.593
0.758
KT3
16.67
7.769
0.524
0.775
KT4
16.55
7.828
0.587
0.759
KT5
16.74
8.265
0.497
0.779
KT6
16.23
7.832
0.532
0.772
CP1
17.53
3.141
0.681
0.856
CP2
17.44
3.170
0.676
0.857
CP3
17.46
2.922
0.853
0.815
CP5
17.47
2.906
0.799
0.827
CP6
17.69
3.201
0.549
0.890
Costs: α = 0.876
Infrastructure: α = 0.778
HT1
14.90
10.872
0.397
0.777
HT2
15.22
10.438
0.527
0.744
HT4
15.02
9.571
0.633
0.715
HT5
14.81
10.804
0.522
0.746
HT6
15.16
10.101
0.531
0.743
HT7
14.97
10.639
0.552
0.739
Natural resources: α = 0.755
TN3
12.70
5.864
0.659
0.656
TN4
12.50
6.453
0.548
0.701
TN5
12.45
7.277
0.379
0.759
TN6
12.93
6.704
0.501
0.719
40
TN7
Vo Thanh Thu et. al., JABES Vol. 25(Special 01), Feb. 2018, 24-49
12.62
6.892
0.528
0.710
Relevant regulations and policies: α = 0.728
QC1
13.18
5.979
0.535
0.662
QC2
12.93
6.254
0.531
0.666
QC3
12.93
6.408
0.459
0.692
QC4
13.53
6.315
0.448
0.697
QC5
13.32
6.064
0.472
0.689
Culture-geography: α = 0.767
VD1
13.56
5.672
0.629
0.699
VD2
13.91
5.963
0.434
0.758
VD3
14.02
5.643
0.518
0.731
VD4
13.63
5.197
0.707
0.667
VD5
13.80
5.247
0.456
0.765
Political risk: α = 0.789
RC1
14.83
7.823
0.724
0.693
RC2
14.76
9.316
0.525
0.762
RC3
14.87
8.432
0.679
0.713
RC4
15.19
9.142
0.439
0.794
RC5
14.88
9.338
0.490
0.773
The results of the first EFA analysis show that TN5 does not reach convergence value
and is rejected. Similarly, variables RC1, HT1, and VD1 are excluded in the second, third
and fourth analyses because of non-discriminating values. The results of the final EFA
analysis are as follows:
Vo Thanh Thu et. al. / JABES Vol. 25(Special 01), Feb. 2018, 24-49
41
Table 7
Results of the last EFA
Component
1
CP3
0.920
CP5
0.884
CP1
0.807
CP2
0.800
CP6
0.678
2
KT1
0.738
KT2
0.736
KT4
0.736
KT6
0.683
KT3
0.676
KT5
0.656
3
HT4
0.790
HT7
0.747
HT5
0.708
HT6
0.686
HT2
0.680
4
QC1
0.731
QC2
0.730
QC5
0.678
QC3
0.666
QC4
0.648
5
TN3
0.833
TN6
0.750
TN4
0.704
TN7
0.669
6
0.230
VD3
0.751
VD4
0.728
7
42
Vo Thanh Thu et. al., JABES Vol. 25(Special 01), Feb. 2018, 24-49
VD2
0.705
VD5
0.242
0.624
-0.211
RC2
0.752
RC5
0.739
RC4
0.690
RC3
0.668
Eigenvalue
3.580
3.196
3.103
2.775
2.400
1.973
1.399
Extraction sums of square loadings
10.849
20.535
29.939
38.347
45.619
51.598
55.838
Cronbach's Alpha
0.876
0.798
0.777
0.728
0.759
0.699
0.693
The analysis results show that 33 observational variables are grouped into seven factors
at eigenvalue, with an extraction sums of 55.838%. Each factor includes the following
observation variables:
Factor 1 (cost-symbolized CP) consists of five observation variables: CP1, CP2, CP3, CP5,
and CP6.
Factor 2 (macroeconomics and market-symbolized KTTT) consists of six observation
variables: KT1, KT2. KT3, KT4, KT5, and KT6.
Factor 3 (infrastructure-symbolized CSHT) consists of five observation variables: HT2,
HT4, HT5, HT6, and HT7.
Factor 4 (regulation, policy related-symbolized QDCS) includes five observation
variables: QC1, QC2, QC3, QC4, and QC5.
Factor 5 (resources-symbolized NTN) consists of four observation variables: TN3, TN4,
TN6, and TN7.
Factor 6 (culture, geography-symbolized VHDL) consists of four observation variables:
VD2, VD3, VD4, and VD5.
Factor 7 (political risk-symbolized RRCT) consists of four observation variables: RC2,
RC3, RC4, and RC5.
4.3. Analysing regression results of factors influencing the direct investment decision of
Vietnamese enterprises to Cambodia
The results of the regression analysis show that with seven factors taken into account in
determining the impact of Vietnam's direct investment decision in Cambodia, four models
are created (Table 8). The fourth model has the highest correlation coefficient (0.867), which
is satisfactory (≥0.50). Thus, the 4th model is chosen. The results also show that the
assumptions are not violated. The linear regression equation represents the relationship
Vo Thanh Thu et. al. / JABES Vol. 25(Special 01), Feb. 2018, 24-49
43
between the four factors affecting the decision to invest directly in Cambodia as follows:
Decision on investment in Cambodia = a0 + a1 * culture, geography + a2 * infrastructure
+ a4 * macroeconomics and market + a5 * regulations and policies related to investment
Table 8
Model summarye from the Stepwise method
Model
R
R Square
Adjusted R Square
Std. Error of the
Estimate
1
.557a
.310
.307
.278
2
.759b
.576
.572
.218
3
.873c
.762
.759
.164
4
.931d
.867
.865
.123
a. Predictors: (Constant), VHĐL
b. Predictors: (Constant), VHĐL, CSHT
c. Predictors: (Constant), VHĐL, CSHT, KTTT
d. Predictors: (Constant), VHĐL, CSHT, KTTT, QĐCS
e. Dependent Variable: Y
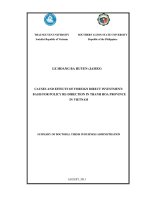
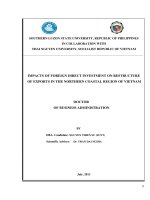
Figure 3. Regression Standardized Residual
Durbin-Watson
1.893
44
Vo Thanh Thu et. al., JABES Vol. 25(Special 01), Feb. 2018, 24-49
Figure 4. The Scatter Plot Between The Standardized Residual
Figure 5. P-P Plot of Standardized Residual
Table 8 shows the fourth regression model selected, which explains 86.7% of the data set,
with a 95% confidence level. This means that there are four accepted hypotheses: H1, H3,
H5 and H6. The decision to invest in Cambodia is affected by: (i) culture, geography; (ii)
infrastructure; (iii) macroeconomics and markets; and (iv) relevant regulations and policies.
The rest is due to errors and other factors.
Vo Thanh Thu et. al. / JABES Vol. 25(Special 01), Feb. 2018, 24-49
45
Table 9
Model’s coefficientsa
Model
4
Unstandardized
Coefficients
B
Std. Error
(Constant)
-.181
.088
VHĐL
.350
.014
CSHT
.266
KTTT
QĐCS
Standardized
Coefficients
t
Sig.
Beta
Collinearity Statistics
Tolerance
VIF
-2.068
.040
.600
25.575
.000
.994
1.006
.012
.503
21.475
.000
.997
1.003
.255
.014
.438
18.672
.000
.992
1.008
.171
.012
.325
13.882
.000
.999
1.001
a. Dependent Variable: Y
In summary, the main determinants of investment in Cambodia are rewritten as follows:
Investment decision in Cambodia = -0.118 + 0.350*Culture-geography + 0.266*
Infrastructure + 0.255*Macroeconomics and market + 0.171*Regulations and policies related
to investment
Accordingly, the group of factors-geography culture has the most important impact on
investment decisions of Vietnamese enterprises in Cambodia (0.35), followed by
Infrastructure (0.266), the macroeconomic and market group (0.255) and finally the group of
regulations and policies related to investment (0.171).
5. Conclusions and policy implications
The results of this research have suggested that the decision to invest directly in
Cambodia is influenced by four factors: (i) culture-geography; (ii) infrastructure; (iii) market;
and (iv) regulations and policies related to investment. This study again reaffirms Aykut et
al.’s (2004) reasoning that direct investment abroad is influenced by factors motivating and
attracting investment. However, in the Cambodian market, the cost, resource, and risk
factors were not statistically significant in this study. This finding is consistent with the
results of Duanmu et al. (2009) in China and India that the resources were not statistically
significant. However, the cost factor and political risk have been confirmed by many
researchers in their studies. Therefore, in the future study, additional models for these
factors are needed.
The purpose of this paper is to develop a framework for analyzing the factors that
influence the direct investment abroad, namely Cambodia. This study suggests that not only
the factors that influence the decision to invest in Cambodia, but also the motivating factors.
46
Vo Thanh Thu et. al., JABES Vol. 25(Special 01), Feb. 2018, 24-49
Based on the existing literature, the research model has been developed. The results show
that both groups of push-pull factors impact simultaneously on Vietnam's FDI abroad in
which pull factors play a key role.
Push factors, the rules and procedures for licensing of Vietnam's FDI abroad, are more
meaningful in influencing Vietnamese companies. To help Vietnamese enterprises quicker
and deeper to penetrate into foreign markets, and the State management agencies of
Vietnam should simplify the regulations and procedures for investment licensing.
Pull factors group with influence on the FDI of Vietnamese enterprises into Cambodia
include the geography-culture factors (including religious factors, customs, attitudes,
beliefs, languages and communication of the two countries, the geographic location of the
two countries close together), these factors strongly influence the decision of direct
investment of Vietnamese enterprises into Cambodia. In fact, many researches also
confirmed this conclusion: border disputes, ethnic discrimination of some groups of factions
within the National Assembly and some areas in Cambodia have a considerable impact on
business activities in particular and investing commonly.
In our opinion, it is very urgent that Vietnam and Cambodia set up common border
clearly, strengthen cultural exchanges, organizing local and inter-communal relations
between the two countries, contributes to stabilizing the political system, are important
impact on increasing Vietnam's FDI in Cambodia. In addition, the opening of language
classes, learning about Cambodian culture for investors, professionals, traders who have
done and will carry out business with this market will contribute to strengthen friendship
between two countries.
Infrastructure factors group is the second most important factor influencing the decision
of direct investment by Vietnamese enterprises in Cambodia (including Cambodia's
transport system, traffic system linking the two countries, convenient communication
system, convenient post office, power supply system, water supply system, human resource
training, medical services). Vietnam Government needs to coordinate with Cambodia to
strengthen the construction and expansion of bridges and roads such as the East-West
Economic Corridor, roads, waterways, and airways to facilitate further investment and
trade of the two countries' businesses. In addition, it needs to encourage the transport,
telecommunication, electricity, etc. businesses to invest in the country.
Furthermore, the two sides should have special mechanisms to encourage health care
projects such as hospitals, clinics, etc. of Vietnam deploying in Cambodia. To solve the
macro and market problems the government of both countries should establish a
mechanism for intergovernmental cooperation with the participation of scientists and
representatives of the Association of Investors in Cambodia to review policy and mechanism
relating to direct investment (mechanisms of investment in foreign countries of Vietnam,
mechanism of attracting investment of Cambodia), indicating the macro-economy and
market control of two countries aiming to propose perfect solutions.
Vo Thanh Thu et. al. / JABES Vol. 25(Special 01), Feb. 2018, 24-49
47
Limitations of the study and suggestions for future studies: The authors mainly took
surveys of enterprises investing and intending to invest in Cambodia by convenient
sampling method, so the generalization of the research is limited. In addition, the study did
not indicate how different the sectors in which Vietnamese businesses invest abroad are.
The study focused on affirming the research design with Cronbach’s Alpha reliability
coefficient and the EFA exploratory factor analysis and linear multiple regression. Future
studies should enhance sample size and use the SEM model to examine the causal
relationship between main determinants
References
Agarwal, J. P. (1980). Determinants of foreign direct investment: A survey.
Weltwirtschaftliches Archiv, 116(4), 739–773.
Andreff, V. (2003). The newly emerging TNCs from economies in transition: A comparison
with third world outward FDI. Transnational Corporations, 12(2), 73–118.
Anil, I., Ekrem, T., & Ozkasap, G. (2014). Ownership and market entry mode choices of
emerging country multinationals in a transition country: Evidence from Turkish
multinationals in Romania. Journal for East European Management Studies, 19(4), 413–452.
Aykut, D., & Ratha, D. (2004). RESEARCH NOTE South-south FDI flows: How big are they?
United Nations Conference on Trade and Development Division on Investment, Technology and
Enterprise Development, 13(1), 149.
Bollen, K. A. (1989). Structural equations with latent variables. John Wiley and Sons, Inc., New
York.
Cheng, S., & Roger, R. S. (2007). The pattern and magnitude of China’s outward FDI in Asia.
ICRIER Project on Intra–Asian FDI Flows in New Delhi, April 2007, 25–26.
Deng, P. (2004). Outward investment by
implications. Business Horizons, 47(3), 8–16.
Chinese
MNCs:
Motivations
and
Duanmu, J.-L., & Guney, Y. (2009). A panel data analysis of locational determinants of
Chinese and Indian outward foreign direct investment. Journal of Asia Business
Studies, 3(2), 1–15.
Dunning, J. H. (2002). Theories and paradigms of international business activity: The selected essays
of John H. Dunning. Edward Elgar, UK.
Gammeltoft, P. (2008). Emerging multinationals: Outward FDI from the BRICS
countries. International Journal of Technology and Globalisation, 4(1), 5–22.
Goh, S. K. (2011). Malaysia's outward FDI: The effects of market size and government policy.
Journal of Policy Modeling, 33(3), 497–510.
Grossman, G. M., & Helpman, E. (1991). Innovation and growth in the world economy. MIT
Press, Cambridge, MA.