Investigating the gender wage gap in Vietnam by quantile regression: Sticky floor or glass ceiling
Bạn đang xem bản rút gọn của tài liệu. Xem và tải ngay bản đầy đủ của tài liệu tại đây (628.78 KB, 20 trang )
Journal of Asian Business and Economic Studies
Volumn 25, Special Issue 01 (2018), 04-23
www.jabes.ueh.edu.vn
Journal of Asian Business and Economic Studies
Investigating the gender wage gap in Vietnam by
quantile regression: Sticky floor or glass ceiling
TRAN THI TUAN ANHa
a
University of Economics HCMC
ARTICLE INFO
ABSTRACT
Received 19 July 2017
Inequality between men and women in the labor market is one of the
issues that is of great interest in labor economics. The sticky floor effect
occurs when the gender wage gap widens at the lower tail of the wage
distribution. The glass ceiling effect in wage exists if the gender wage
gap at the top of the wage distribution is wider than other positions.
This study uses the dataset of VHLSS2014 and adopts quantile
regression to investigate the existence of glass ceiling and sticky floor
in the Vietnam’s labor market. The overall results obtained of the entire
sample show that there is sticky floor effect but no glass ceiling in the
Vietnam’s labor market. However, the results are different when it
comes to each labor group. In terms of urban and rural areas, the sticky
floor exists, but the glass ceiling does not in both areas. In terms of
state and private sectors, while the glass ceiling exists in state sector,
the stick floor is only present in the private sector.
Revised 15 Nov. 2017
Accepted 1 Jan. 2018
Available online
12 January 2018
JEL classifications:
E24; J16; O18
KEYWORDS
Gender wage gap
Glass ceiling
Sticky floor
Quantile regression
Mincer-type wage
equation
Gender discrimination
Tran Thi Tuan Anh, JABES Vol. 25(Special 01), Feb. 2018, 04-23
5
1. Introduction
Inequality between men and women in the labor market is one of the issues that are of
great interest in labor economics. Many empirical studies have shown that wages of males
are higher than for female workers. This happens in most countries around the world. Most
of these studies focus on the average gender wage gap. However, in modern labor
economics, an interesting phenomenon also attracts the attention of researchers: the gender
wage gap at the upper and lower tails of wage distribution are usually higher than that at
the middle one. If the gender wage gap at lower tail quantiles is wider than that at the middle
quantiles, it will result in a sticky floor effect. If the gender wage gap at upper quantiles is
higher than the middle units, the glass ceiling is perceived to come in existence.
Glass ceiling can be interpreted as the phenomenon whereby women do quite well in the
labor market up to a point after which there is an effective limit on their prospects. Glass
ceiling implies that there seems to be an invisible barrier to female workers in occupation,
in promotion or in wage that prevents females to reach the top compared to male workers
who have the same productivity characteristics. The glass ceiling effect in wage exists if the
gender wage gap at the top of the wage distribution is wider than other position, suggesting
that females in wage ceiling have lower pay than their male counterparts.
The sticky floor effect occurs when the gender wage gap widens at the lower tail of the
wage distribution. This refers to the case where women at the bottom of the wage
distribution are more discriminated against than men and they may face greater
disadvantages than at other quantiles.
Nowadays, sustainable development is a global concern. Gender equality is one of the
important criteria for assessing the sustainable development of a country. Vietnam is also
oriented toward sustainable development. Therefore, the improvement of gender wage gap
is also one of the urgent requirements in global integration context. Investigating the
existence of the glass ceiling sticky floor effect will determine the segments where the gender
wage inequality actually occurs, and thereby help the government to build strategies for
improving the gender inequality efficiently and effectively.
In addition, many studies reveal that inequality hurts economic growth. The 17th
sustainable development goals of United Nation are to “achieve gender equality and
empower all women and girls”. The fact that female workers are stuck in low-income or
bound by invisible barriers in high-income workers may limit their ability to contribute.
Overcoming the effect of sticky floor and glass ceiling will create conditions for both men
and women to contribute significantly to a country’s development.
In Vietnam there are some empirical studies that demonstrate statistical evidence of
gender wage gap. Liu (2004) used data from VHLSS 1992-1998 to investigate gender wage
inequality in Vietnam by multiple linear regression and the Oxaca-Blinder (1973)
6
Tran Thi Tuan Anh, JABES Vol. 25(Special 01), Feb. 2018, 04-23
decomposition. Hung and Reilly (2007) employed quantile regression to analyze the gender
wage differential with the data for the period from 1992 to 2002. Anh (2015) also adopted
quantile regression, while Machado (2015) analyzed the gender wage gap. All the above
studies show the existence of gender wage inequality in Vietnam with strong statistical
evidence. However, none of these papers have really focused on analyzing glass ceiling and
sticky floor effects.
In addition, it is important to know at which quantiles of wage distribution the wage
inequality is stronger. If the existence of the glass ceiling and sticky floor effects is confirmed,
this will provide important guidance for policy makers to focus specifically on specific
income groups where the gender wage inequality is the most serious.
Many studies in the world have examined the existence of glass ceiling and stick coatings
in wage functions in many countries. However, very few studies are conducted in Vietnam.
So, this article aims to investigate the existence of glass ceiling and sticky floor on the
Vietnam’s labor market in Vietnam. Not only are they investigated in the overall Vietnamese
labor market, floor stickiness and glass ceiling effects are also verified by groups formed by
living areas (urban/rural), sectors (state/private), education, and occupation.
This research contributes to the existing literature in several ways. Firstly, this study
reinforces the empirical evidence of the existence of gender wage inequality in Vietnam.
Secondly, this paper sheds light on the gender wage inequality in Vietnam. By investigating
the existence of glass ceiling and sticky floor of wages, we confirm that the gender wage
inequality mainly occurs in the low wage group (sticky floor effect) and is less severe in high
wage group (no glass ceiling effect). Thirdly, this study also clarifies the glass ceiling and
sticky floor effect in several groups of labor, such as urban/rural, state/private, educational,
occupational groups.
The remaining of this study is organized as follows. Section 2 deals with a theoretical
background and literature review. Section 3 presents the research methodology used in this
study to investigate the sticky floor and glass ceiling effect. Section 4 reports and discusses
the findings of the research. Finally, Section 5 summarizes some key results besides
suggesting some policy implications and limitations of the study.
2. Literature review
In the representative studies of Albrecht et al. (2003) and Arulampalam et al. (2007), the
statistical evidence was accumulated of the glass ceiling and sticky floor, indicating the
wider gender wage differentials at the lower and upper tails of the wage distribution. On
average, the gender wage gap can possibly be estimated using ordinary least squares and
other mean regressions. However, OLS cannot be employed to investigate the gap beyond
of the mean of the dependent variable, so it does not help in examining the glass ceiling and
the sticky floor. Many statistical tools have been introduced to perform regression in other
Tran Thi Tuan Anh, JABES Vol. 25(Special 01), Feb. 2018, 04-23
7
quantiles of wage distribution. With the introduction of the quantile regression by Koenker
and Bassett (1978), nevertheless, the investigation of gender wage differentials throughout
the wage distribution becomes more convenient. Since then quantile regression has become
an effective empirical tool for examining the existence of sticky floor and glass ceiling.
Adamchik et al. (2003) measured the relative economic welfare of women in Poland
during the transition. The authors analyze the male–female wage differential over the period
from 1993 to 1997 after providing an account of gender differences in several labor market
outcomes. Their results show that most of the explained portions of the wage differentials
may be contributed to industrial and occupational segregation. They also verify that a
substantial part of the wage gap remains unexplained.
Albrecht et al. (2003) used the 1998 data to show that the wage gap between males and
females in Sweden rises throughout the wage distribution and moves faster in the top
quantiles. They explain this as a strong glass ceiling effect. Albrecht et al. (2003) also
performed decomposition by quantile regression to investigate the cause of gender gap.
After controlling age, education, sector, industry, and occupation, they conclude that the
glass ceiling still persists to a considerable extent.
Booth et al. (2003), using data from the British Household Panel Survey, indicated that
full-time female workers are more likely to get promotion than their male counterparts.
Controlling worker characteristics, they suggested that females may receive lower wage
increases consequent upon promotion, although the chances of females being promoted are
as large as those of males, which means that females and males could be promoted at the
same rate. A sticky floor model of wage and promotion was constructed in order to account
for their findings. As per sticky floor model, females’ promotion prospects are just as
reasonable as those of males, but they are stuck at the bottom of the wage scale for the new
grade.
Kee et al. (2005) analyzed Australian gender wage gaps in both public and private sectors
across the wage distribution by using the HILDA survey and quantile regression techniques.
Additionally, the authors employs quantile regression decomposition analysis to examine
whether differences in gender characteristics or differing returns between genders are
attributed to the gap. Kee et al. (2005) detected a strong glass ceiling effect in the private
sector. Moreover, after controlling many relevant factors, the acceleration in the gender gap
across the distribution does not vanish, which proposes that the wage gap mainly causes by
returns to genders.
Using data from the European Community Household Panel, De la Rica (2008) analyzed
the gender pay gap across the wage distribution in Spain by longitudinal panel data and
quantile regression techniques. The results showed that there exists the glass ceiling for
highly educated workers, because the gap rises as moving up throughout the distribution.
However, the gap falls gradually for less-educated workers. The author suggests that this
can be interpreted by statistical discrimination exerted by employers in countries where less-
8
Tran Thi Tuan Anh, JABES Vol. 25(Special 01), Feb. 2018, 04-23
skilled women have low participation percentages.
Using 1987, 1996, and 2004 data, Chi and Li (2008) indicated that the gender earnings gap
in urban China has gone up throughout the earning’s distribution, and the gap was wider
at the lower quantiles. This can be seen as strong evidence of sticky floor effect. They also
decomposed gender wage differentials, arguing that the gender endowment differences
contribute less to the overall gender earnings gap than do return to worker characteristics.
They also demonstrated that sticky floor can be associated with female production workers
in low-paid career group working in non-state firms.
Agrawal (2013) examined the gender pay gap in the rural and urban areas in India. The
findings showed evidence of the sticky floor effect in the urban sector and evidence of the
glass ceiling effect in the rural sector. The gender wage gap is decomposed to clarify the
contributions of coefficients and characteristics. The results illustrate the presence of
discrimination against women. Additionally, women at the bottom of the wage distribution
encounter more discrimination than those at the top.
Christofides et al. (2013) considered the gender wage differentials in 26 European
countries with data in 2007 from Income and Living Conditions of the European Union
Statistics. The magnitude of the gender wage differentials differ considerably among
countries. The gap cannot be explained fully by the laborer’s characteristics. Using quantile
regressions, the authors revealed that the glass ceilings and sticky floors effects exist in
several countries. They also found larger glass ceilings for full-time full-year employees.
They suggest that country institutions and policies are relevant to unexplained gender wage
gaps in systematic ways.
Finseraas et al. (2016) studied discrimination among recruits in the Norwegian Armed
Forces during bootcamp. They revealed that females are perceived as less suited to be squad
leaders than their male counterparts who have the same labor characteristics.
In Vietnam Pham and Reilly (2006) demonstrated the gender gap in Vietnam using
VHLSS1998 and 2002. Anh (2015) compared the VHLSS data for 2002 and 2012 using the
quantitative regression and the decomposition method. Machado-Mata (2005) showed
evidence that the gender wage differential occurs on all quantiles and the wage gap is
entirely attributed to the difference in returns to labor characteristics received by men and
women. However, Anh did not examine the existence of glass ceiling and sticky floor on the
labor market in Vietnam.
According to the literature mentioned above, this study aims to employ quantile
regression to examine the existence of the sticky floor and glass ceiling effect in Vietnam
across the labor market.
Tran Thi Tuan Anh, JABES Vol. 25(Special 01), Feb. 2018, 04-23
9
3. Data and methodology
3.1. Data
This study uses the dataset of VHLSS2014 to accomplish the research objectives. The
VHLSS dataset collects information on a sample of households and communes that serves
to assess the living standards across the country and regions. This includes the objective of
assessing poverty and the economic inequality. The VHLSS survey consists of households,
household members, and communes in all provinces/cities. The VHLSS sampling method
is implemented through the consultancy and supervision of the National Institute of
Statistical Sciences, UNDP, and the World Bank to ensure representative representation of
the sample selected for the overall study. Because of the representative sample of the
VHLSS, the VHLSS data is suitable for constructing the wage equation to investigate the
existence of glass ceiling and sticky floor in Vietnam.
The total number of households surveyed in VHLSS 2014 is 46,995 households in 3,133
communes across 63 provinces. Information on employment and wages is provided in
Section 4A of the questionnaire. The sample comprises all the respondents in Section 4A but
excludes members out of working age. The sample also excludes members who are selfemployed workers.
3.2. Methodology
Using the VHLSS 2014 and referring to study of Albrecht et al. (2003), this study employs
an extension of Mincer wage equation with the independent variables as listed in Table 1.
The dependent variable is logarithm of hourly wage. Taking hourly pay will rule out the
difference in wage due to being full-time or part-time workers as well as all factors that affect
the working time of workers such as housework, child care, etc. Because the research
objectives are to investigate the existence of glass ceiling and stocky floor and determine
how wide the gaps are, the variable male is the key explanatory variable. This is a dummy
variable, taking value 1 if the worker is male and zero if the worker is female. The regression
coefficient of this dummy variable will help to measure the gender wage gap.
In addition to gender dummy variable, the wage regression also includes other
independent variables as control variables. All the variables included in the model are listed
in Table 1.
10
Tran Thi Tuan Anh, JABES Vol. 25(Special 01), Feb. 2018, 04-23
Table 1
List of variables
ID
Variables
Notes
1
lnwage
Logarithm of hourly wage
2
male
= 1 for male workers; = 0 for female workers
3
age
Age of worker
4
age2
Age squared
6
married
= 1 if worker current marital status is married; = 0 otherwise
7
race
= 1 if worker race is Kinh or Hoa; = 0 otherwise
8
Primary
= 1 if worker’s highest level of education is primary; = 0 otherwise
9
Secondary
= 1 if worker’s highest level of education is secondary; = 0 otherwise
10
Highschool
= 1 if worker’s highest level of education is highschool; = 0 otherwise
11
Vocational
= 1 if worker’s highest level of education is vocational degree; = 0
otherwise
12
Bachelor
= 1 if worker’s highest level of education is bachelor; = 0 otherwise
13
Postgraduate
= 1 if worker’s highest level of education is postgraduate; = 0 otherwise
14
Manager
= 1 if worker occupation is leader/manager; = 0 otherwise
15
High level expert
= 1 if worker occupation is high level expert; = 0 otherwise
16
Average level expert
= 1 if worker occupation is average level expert; = 0 otherwise
17
Office staff
= 1 if worker occupation is office staff; = 0 otherwise
18
Service
= 1 if worker occupation is service; = 0 otherwise
19
Manual laborer
= 1 if worker occupation is manual laborer ; = 0 otherwise
20
Operation worker
= 1 if worker occupation is operation worker; = 0 otherwise
21
Private
= 1 if worker works in private sector; = 0 otherwise
22
State
= 1 if worker works in state sector; = 0 otherwise
The wage equation of this study is constructed as an extension of Mincer wage equation
which is referred to Albrecht et al (2003). Estimation method is the quantile regression.
Although quantile regression can be estimated for every quantile τ ϵ (0,1), we only report
the results for some regular quantiles such as 0.1 – 0.25 – 0.5 – 0.75 – 0.9. These quantile are
chosen because this is a combination of quartiles and deciles which are commonly used in
statistics.
Tran Thi Tuan Anh, JABES Vol. 25(Special 01), Feb. 2018, 04-23
11
The model is:
lnwage 1 2 male+ 3age+ 4 age2 5 married 6 state 7 private
8 race 9urban+
6
5
j 1
j 1
j education j j occupation j u.
(1)
The explanation of variables is listed in Table 1.
The quantile regression will be performed at some typical quantiles: 0.1 – 0.25 – 0.5 – 0.75
– 0.9. The coefficient of the gender dummy variable will show the gender wage differentials
at each quantile. The sticky floor effect occurs when females at the lower tail of the wage
distribution are at greater disadvantages and the gap is wider at this lower tail. Thus,
according to Booth et al. (2003), in order to verify the existence of the sticky floor in Vietnam,
the coefficient of the gender dummy variable at quantile 0.1 is compared with that of
quantiles 0.25 and 0.5. If the gender wage gap at quantile 0.1 is significantly greater than the
gap at quantiles 0.25 and 0.5, there is statistical evidence for the existence of sticky floor in
Vietnam.
Similarly, the glass ceiling effect occurs when the gender wage differentials are wider at
the upper tail of the wage distribution. Therefore, according to Arulampalam et al. (2007),
in order to verify the existence of the glass ceiling, the coefficient of the gender dummy
variable at quantile 0.9 is compared with that of quantiles 0. 5 and 0.75. If the gender wage
gap at 0.9 is significant greater than the gap at 0.5 and 0.75, there is statistical evidence of the
existence of glass ceiling in Vietnam.
In order to figure out the overall picture of the sticky floor and glass ceiling in Vietnam’s
labor market, this study will perform analyses of the entire population and some
subpopulations: urban and rural areas, state sector and private sector, groups divided by
education, and groups divided by occupations.
4. Results and discussion
4.1. Descriptive statistics
Table 2 shows the percentages of male and female workers in the sample as well as in
each subgroup. The total number of observations for the entire sample is 5,512, of which the
number of female workers is 2,407 (about 43.67%) and the number of male workers is 3,105
(about 56.33%). In the sample employed in the private sector are 1,454 (26.38%) workers,
among whom 618 (42.5%) are female, and 836 male (57.5%). The number of people working
in the public sector is 785 (14.24%), with the proportion of men in this group being 51.3%
and 48.7% for women. For each group formed by education, the number of workers with
bachelor degree is 1,774 (about 24.93%) which is the highest proportion, of which 53.9% are
female and 46.1% are male. The proportion of workers with postgraduate qualifications is
12
Tran Thi Tuan Anh, JABES Vol. 25(Special 01), Feb. 2018, 04-23
relatively small at about 1.40% (= 77/5512); particularly, the proportion of men with
postgraduate qualifications is much higher than that of women (65.5% versus 34.5%). At the
remaining levels of education such as primary, lower secondary, highschool, and vocational
levels, the proportion of male workers is always higher than that of female workers.
Table 2
Percentage of male and female laborers in the entire sample and in each subsample
Female
Sample
Male
Total
Count
Percent
Count
Percent
(1)
(2)
(3)
(4)
(1)+(3)
2407
43.67%
3105
56.33%
5512
private
618
42.5%
836
57.5%
1454
staterun
785
48.7%
828
51.3%
1613
Primary
366
39.0%
573
61.0%
939
Secondary
411
41.8%
572
58.2%
983
Highschool
320
46.6%
366
53.4%
686
Vocational
315
34.5%
597
65.5%
912
Bachelor
741
53.9%
633
46.1%
1374
Postgraduate
27
35.1%
50
64.9%
77
Manager
34
25.2%
101
74.8%
135
HighLevelExpert
471
54.5%
394
45.5%
865
AverageLevelExpert
293
61.0%
187
39.0%
480
OfficeStaff
163
58.0%
118
42.0%
281
Service
236
43.9%
302
56.1%
538
SkilledLaborer
22
24.2%
69
75.8%
91
ManualLaborer
380
33.2%
764
66.8%
1144
OperatingWorker
296
41.9%
411
58.1%
707
Total
Sectors
Education
Occupations
Table 3 demonstrates the mean and median wages of the two groups of male and female
over the entire sample as well as subsamples. The log wage’s mean value of males is higher
Tran Thi Tuan Anh, JABES Vol. 25(Special 01), Feb. 2018, 04-23
13
than that of females on the whole sample. This not only occurs in the entire sample but also
in every subsample which are split by urban/rural areas, by state/private sectors, by
education and occupations. All gender wage differentials are statistically significant,
suggesting that the gender wage gap actually exists. Table 3 also shows the median wage
differentials between men and women. Similar to the mean wage differentials, the median
of male wages is always higher than that of females over the whole sample as well as in all
subsamples considered. All the median wage gap between men and women is always
statistically significant.
These early comparisons show that male wages tend to be higher than female wages in
both cases of mean wage and the median wage. However, this comparison does not help to
see whether there is a sticky floor and glass ceiling. In the next step, it is necessary to conduct
quantile regression to investigate the existence of glass ceiling and sticky floor.
Table 3
Comparison of lnwage between male and female groups
Female
Sample
Male
Mean Median Mean Median
Difference
Mean
t-stat
Median
Pearson
chi2
(1)
(2)
(3)
(4)
(5)= (3) - (1)
(6)
(7)= (4) - (2)
2.88
2.95
3.03
3.06
0.15
7.77***
0.11
31.71***
Urban
2.70
2.81
2.87
2.93
0.17
5.97***
0.11
37.94***
Rural
3.06
3.08
3.22
3.24
0.16
6.06***
0.16
19.81***
Entire sample
Urban – rural areas
Public – private sectors
Private
2.86
2.91
3.06
3.07
0.20
5.43***
0.16
30.20***
State
3.26
3.31
3.43
3.48
0.18
5.61***
0.16
23.36***
Primary
2.54
2.67
2.76
2.85
0.22
5.147***
0.18
15.12***
Secondary
2.74
2.81
2.83
2.89
0.09
2.14**
0.08
4.31**
Highschool
2.75
2.86
2.93
3.00
0.19
3.32***
0.15
10.64***
Vocational
3.00
3.05
3.18
3.22
0.18
4.31***
0.16
20.48***
Bachelor
3.27
3.35
3.53
3.57
0.26
6.97***
0.22
38.97***
Postgraduate
3.76
3.86
4.00
3.94
0.24
1.94*
0.08
2.52
Educations
Occupations
14
Tran Thi Tuan Anh, JABES Vol. 25(Special 01), Feb. 2018, 04-23
Female
Sample
Male
Difference
Mean Median Mean Median
Mean
t-stat
Median
Pearson
chi2
(1)
(2)
(3)
(4)
(5)= (3) - (1)
(6)
(7)= (4) - (2)
Manager
3.52
3.65
3.80
3.85
0.28
2.12**
0.20
5.42**
HighLevelExpert
3.44
3.46
3.69
3.69
0.24
5.96***
0.23
28.69***
AverageLevelExpert 3.16
3.26
3.33
3.35
0.17
2.87***
0.09
3.65*
OfficeStaff
2.94
3.02
3.12
3.22
0.17
2.07**
0.20
7.34***
Service
2.59
2.68
2.73
2.81
0.14
2.20**
0.12
6.82***
ManualLaborer
2.59
2.73
2.96
3.01
0.37
9.76***
0.28
70.00***
OperationWorker
2.89
3.00
3.13
3.14
0.24
5.71***
0.14
19.56***
LowSkilledLaborer
2.48
2.53
2.63
2.72
0.14
3.71***
0.19
21.73***
*,**,***: significant at 10%, 5%, 1% respectively
4.2. The gender wage differentials across the distribution
Table 4
Summary of stick floor and glass ceiling in Vietnam
Sample
The gender wage gap
Sticky
OLS
0.1
0.25
0.5
0.75
0.9
Entire
0.223***
0.260***
0.203***
0.206***
0.205***
0.196***
sample
[13.20]
[7.03]
[10.02]
[15.23]
[13.61]
[9.28]
0.189***
0.218***
0.135***
0.206***
0.201***
0.191***
[8.35]
[5.47]
[5.79]
[10.44]
[9.62]
[5.37]
0.251***
0.280***
0.247***
0.217***
0.196***
0.226***
[9.89]
[4.59]
[7.71]
[9.73]
[8.18]
[7.07]
0.149***
0.103**
0.124***
0.125***
0.159***
0.190***
[5.49]
[2.01]
[4.25]
[4.82]
[5.26]
[4.56]
Private
0.178***
0.261***
0.160***
0.166***
0.175***
0.187***
sector
[5.52]
[3.29]
[4.58]
[6.16]
[6.28]
[4.04]
floor
Glass ceiling
yes
no
yes
no
yes
no
no
yes
yes
no
Urban - rural areas
Urban
Rural
State - private sectors
State sector
Tran Thi Tuan Anh, JABES Vol. 25(Special 01), Feb. 2018, 04-23
15
The regression equation (1) is performed on the entire sample as well as on each labor
group to determine the glass ceiling and sticky floor effect. The coefficient of the gender
dummy variable will indicate the gender wage gap. The estimated coefficients of this
variable are presented in Table 4 and are represented by Figures 1–5 corresponding to each
sample.
Table 4 presents the summary results of the existence of sticky floor and glass ceiling on
the labor market in Vietnam. The overall results on entire sample show that there is sticky
floor effect but no glass ceiling in Vietnam labor market. However, the results are different
when analyzing in detail the entire sample and each labor group.
On entire sample
0.10
0.20
male
0.30
0.40
Raw_differentials_entire_sample
0
.2
.4
.6
.8
1
Quantile
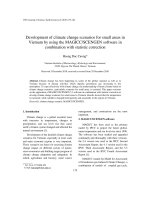
Figure 1. Gender wage gap in entire sample by OLS and quantile regression
Figure 1 demonstrates the gender wage gap in mean and in each quantile across the wage
distribution on the entire sample which are reported in the first two rows of Table 4. The
horizontal dashed line represents the gender gap in mean wage and it is constant across all
quantiles. The folded line represents the variation of gender wage gap across quantiles. As
we can see from Table 4 and Figure 1, the gender wage gap tends to be higher at bottom of
the wage distribution. The folded line in Figure 1 has the tendency to be higher at lower
quantiles than that of middle quantiles, indicating that this statistical evidence supports the
16
Tran Thi Tuan Anh, JABES Vol. 25(Special 01), Feb. 2018, 04-23
existence of a sticky floor in Vietnam labor market. However, the regression result on the
whole sample did not provide statistical evidence for the existence of the glass ceiling
because the gender variable’s coefficient at quantile 0.9 is not greater than at 0.5 and 0.75.
Thus, with the results of wage regression for whole sample, this study reveals the statistical
evidence for the existence of sticky floor but no evidence for the glass ceiling effect. To
investigate more details about these effects in Vietnam, we continue to look at these effects
in urban and rural areas.
In urban area
0.10
0.20
male
0.30
0.40
0.50
Raw_differentials_in_urban
0
.2
.4
.6
.8
1
Quantile
Figure 2. Gender wage gap in urban area by OLS and quantile regression
The results in Table 4 which are shown in Figure 2 show that the gender wage gap at the
lower quantiles is higher than the wage gap in the middle quantiles. All the gaps are
statistically significant. This is empirical evidence of the existence of a sticky effect on the
wages of workers in urban areas. Meanwhile, the results do not provide any statistical
evidence of the glass ceiling. The coefficient of the high quantiles (represented by 0.9) is
lower than in the middle quantiles (represented by 0.5 and 0.75). The existence of sticky floor
without glass ceiling is similar to the result obtained from the entire sample.
Tran Thi Tuan Anh, JABES Vol. 25(Special 01), Feb. 2018, 04-23
17
In rural area
0.10
0.20
male
0.30
0.40
0.50
Raw_differentials_in_rural
0
.2
.4
.6
.8
1
Quantile
Figure 3. Gender wage gap in rural by OLS and quantile regression
Figure 3 shows the gender wage gap in rural areas. The coefficients at the bottom of wage
distribution (represented by the quantile 0.1 in Table 4) are significantly higher than the gap
at the middle quantiles. This is statistical evidence of the existence of a sticky floor in the
rural wage equation. Similar to the result of urban area, the result in rural areas also shows
no evidence for the existence of the glass ceiling effect. The gender pay gap at quantile 0.9 is
not significantly higher than the gap at 0.5 and 0.75 quantiles. This can also be observed at
the unclear upward trend of the curve line on the Figure 3.
In state sector
In addition to analyzing the gender wage gap in urban/rural areas, this research also
examines the sticky floor and glass ceiling for state and private sectors. Figures 5 and 6 show
the regression results in the state and private sectors, respectively.
18
Tran Thi Tuan Anh, JABES Vol. 25(Special 01), Feb. 2018, 04-23
0.00
0.10
male
0.20
0.30
0.40
Raw_differentials_in_statesector
0
.2
.4
.6
.8
1
Quantile
Figure 4. Gender wage gap in state sector by OLS and quantile regression
The increasing tendency of the wage gap widening along with the increase in the
percentile can be seen in Figure 9. As the gender wage gap at top quantiles of the wage
distribution is wider than at the middle, this is the statistical evidence of the existence of the
glass ceiling in the state sector. And the results also show that there is no sticky floor in this
sector.
In private sector
Considering the glass ceiling effect, although the regression coefficient shown in Table 4
of the 0.9 quantile is quite higher than that of the other quantiles, the difference is not
statistically significant. The increasing trend across the top quantiles is unclear, which can
be considered as having no glass ceiling effect in the private sector.
Tran Thi Tuan Anh, JABES Vol. 25(Special 01), Feb. 2018, 04-23
19
0.00
0.10
male
0.30
0.20
0.40
0.50
Raw_differentials_in_private
0
.2
.4
.6
.8
1
Quantile
Figure 5. Gender wage gap in private sector by OLS and quantile regression
5. Conclusion and policy implication
5.1. Conclusion
The previous sections have analyzed in detail the gender wage gap across wage
distribution on the entire sample as well as each labor group. Table 9 presents the summary
results of the existence of sticky floor and glass ceiling on the labor market in Vietnam. The
overall results of the whole sample show that there is sticky floor effect but no glass ceiling
in Vietnam labor market. However, the results are different when analyzing in detail on
each labor group. In terms of urban and rural areas, the sticky floor exists but the glass
ceiling effect does not in both areas.
In terms of state and private sectors, the glass ceiling only exists in the state sector, while
the stick floor is only present in the private sector. The cause may be that males are often
assigned senior or important position than females. Females are still able to participate in
high-level leadership but in fact, such cases are quite rare. If this happens, females often
receive lower wages than men for the same position. One other reasonable explanation for
this result is the difference in wage policy for two sectors. The private sector is often more
competitive and there are no strict wage scales as in the state sector.
20
Tran Thi Tuan Anh, JABES Vol. 25(Special 01), Feb. 2018, 04-23
5.2. Policy implications
With statistical evidence on the existence of sticky floor glass ceiling effect in the specific
groups, this study proposes some policy implications to reduce these two effects and
enhance the gender equality. Policies should be designed to increase female labor force
attachment, which is expected to reduce ‘statistical discrimination’ against women. By
quantile regression techniques, this study has clarified some specific labor groups which are
concerned with the presence of glass ceiling and sticky floor effects. It is necessary to
propose appropriate policies for each target group to overcome these effects. The
implications suggested by this study can be divided into three categories: some general
suggestions to reduce both of effects, some specific suggestions to reduce sticky effects, and
some specific suggestions to reduce the glass ceiling effect.
General suggestions to reduce both of effects
Firstly, it is required to formulate a number of gender policies suitable to Vietnam's socioeconomic conditions. Specifically, parental leave policies and day care provisions will enable
women to better participate in the labor market. It is necessary to construct a strong support
system for working women, such as fully paid maternity leave, access to kindergartens and
health-care facilities. One of the reasons that women are confined to the labor market is that
women are the ones who have to take care of most of the children in the family. So,
Arulampalam et al. (2007) argued that these policies can provide motivation for women to
learn to improve their own human capital as well as to have more time to work and improve
their productivity.
Secondly, according to Dolado et al. (1996) and Arulampalam et al. (2007), the good
minimum wage legislation can help create smaller gender wage gaps and reduce sticky floor
effects.
Thirdly, the press and the media also need to provide positive information about a
standard perspective on gender equality. According to a report by JobStreet.com, both
genders are aware of how men are being privileged over women. In particular, men are said
to be more likely to be promoted, receive higher priority in the hiring process, gain higher
salaries, and be more likely to be evaluated for better performance.
Sticky floor effect exists in both urban and rural areas. In both areas, a common
perception in society is that women must be the ones who take responsibility for most of the
housework in family. This hinders the progress in a woman's career as well as her
productivity. In addition, when recruiting people, employers often assume that women will
not be committed to permanent and effective work as men because of social discrimination.
Hence, employers discriminate against women when they enter the labor market because
they expect future career interruptions.
For the sticky floor effect
Sticky floor takes place in the private sector but not in the state sector. In the state sector,
Tran Thi Tuan Anh, JABES Vol. 25(Special 01), Feb. 2018, 04-23
21
wages for employees, including managers, are defined by clear pay scales. Therefore, the
finding of no evidence for the glass ceiling effect in the public sector is reasonable. For the
private sector, promotions and wages are often governed by the employers. For profit
purposes, employers are willing to pay a very low wage for low-level jobs which are often
taken on by females. This might be the cause of the sticky floor effect in the private sector.
Therefore, policies to limit the sticky floor effect should focus on the low-wage segment of
jobs in private sector.
Chi and Li (2008) found that there is a sticky floor effect that can be explained by a lower
female educational attainment. When parents perceive that return to investment on their
sons is often greater than that of their daughters, they invest more in education and health
care for their sons, especially under low living standard conditions of rural areas. In the long
term, this also leads to future wage inequality and sticky floor effect.
Dollar and Gatti (1999) found that economic growth will further reduce the effects of
adhesion, and this has been demonstrated in low income. In addition, income inequality
which is represented by the Gini coefficient also correlates very strongly with the sticky.
Countries that suffer from higher income inequality also experience larger gender wage gap
at the bottom of the distribution. Therefore, the policies that promote a country's economic
growth also contribute to reducing sticky floor effect indirectly.
Programs and policies to support low-paid women need to focus on the causes of job
segregation, in which women often focus on low-wage jobs. Policies also aim at encouraging
and motivating females to study and improve their education, enhance their skills, and
become more involved in the occupational and industrial segments which men dominate
because of prejudice against women.
Furthermore, according to Arulampalam et al. (2007), government should complete
more of the minimum wage legislation and collective bargaining institutions. This may play
an important role in reducing the gender wage gap at the bottom of the wage distribution
and therefore help decrease the sticky floor effect.
For the glass ceiling effect
Dollar and Gatti (1999) also demonstrated that glass ceiling effect may be more likely to
occur in richer countries. Therefore, in the process of promoting national economic growth,
government should pay attention to potential consequences, named glass ceiling effect
which can exacerbate the inequality in society.
Glass ceiling exists only in rural areas. In urban areas, women are more likely to work in
a more advanced working environment and have better conditions of promotion than in
rural areas. Child care services as well as employment of domestic workers are also more
convenient. Therefore, urban women can assume more important positions in the business
than in rural areas. Thus, glass ceiling effects do not exist in urban areas but exist in rural
areas
22
Tran Thi Tuan Anh, JABES Vol. 25(Special 01), Feb. 2018, 04-23
References
Adamchik, V., Hyclak, T., & King, A. (2003). The wage structure and wage distribution in
Poland, 1994–2001. International Journal of Manpower, 24, 916–946.
Agrawal, T. (2013). Are there glass-ceiling and sticky-floor effects in India? An empirical
examination. Oxford Development Studies, 41(3), 322–342
Albrecht, J., Bjorklund, A., & Vroman, S. (2003). Is there a glass ceiling in Sweden? Journal of
Labor Economics, 21(1), 145–177.
Anh, T. T. T. (2015). Analyzing effects of qualifications on wage in Vietnam: A quantile
regression (in Vietnamese). Journal of Economic Development, 26(1), 95–116.
Anh, T. T. T. (2015). Effects of qualifications on wage in rural and urban sectors in Vietnam:
A quantile regression approach (in Vietnamese). Journal of Economic Studies, Danang
University of Economics, 2015(3), 11–20.
Arulampalam, W., Booth, A. L., & Bryan, M. L. (2007). Is there a glass ceiling over Europe?
Exploring the gender pay gap across the wage distribution. Industrial & Labor Relations
Review, 62(2), 163–186.
Booth, A. L., & Francesconi, M. (2003). Union coverage and non-standard work in Britain.
Oxford Economic Papers, 55(3), 383–416.
Buchinsky, M. (1994). Changes in the U.S. wage structure 1963–1987: Application of quantile
regression. Econometrica, 62(2), 405–405.
Card, D. (1995). The wage curve: A review. Journal of Economic Literature, 33(2), 785–785.
Chi, W., & Li, B. (2008). Glass ceiling or sticky floor? Examining the gender earnings
differential across the earnings distribution in urban China, 1987–2004. Journal of
Comparative Economics, 36(2), 243–263.
Christofides, L. N., Polycarpou, A., & Vrachimis, K. (2013). Gender wage gaps, ‘sticky floors’
and ‘glass ceilings’ in Europe. Labor Economics, 21(C), 86–102.
de la Rica, S., Dolado, J., & Llorens, V. (2008). Ceilings or floors? Gender wage gaps by
education in Spain. Journal of Population Economics, 21(3), 751–776.
Dolado, J., Kramarz, F., Machin, S., Manning, A., Margolis, D., Tuelings, C., Saint-Paul, G.,
& Keen, M. (1996). The economic impact of Minimum Wages in Europe. Economic Policy,
11(23), 317–372.
Dollar, D., & Gatti, R. (1999). Gender inequality, income, and growth: Are good times good for
women? World Bank Working Paper, May 1999.
Finseraas, H., Johnsen, A., Kotsadam, A., & Gaute, T. (2016). Exposure to female colleagues
breaks the glass ceiling evidence from a combined vignette and field experiment.
European Economic Review. />
Tran Thi Tuan Anh, JABES Vol. 25(Special 01), Feb. 2018, 04-23
23
Hao, L., & Naiman D. Q. (2007). Quantile regression. Sage Publications, Thousand Oaks.
Hung, P. T., & Reilly, B. (2009). Ethnic wage inequality in Vietnam. International Journal of
Manpower, forthcoming, 30(3), 192-219
Kee, H. J. (2006). Glass ceiling or sticky floor? Exploring the Australian gender pay gap: The
economic record. The Economic Society of Australia, 82(259), 408–427.
Koenker, R. (2005). Quantile regression. Cambridge.
Koenker, R., & Bassett, G. (1978). Regression quantiles. Econometrica, 46(1), 33–50.
Liu, A. Y. C. (2004). Gender wage gap in Vietnam: 1993 to 1998. Journal of Comparative
Economics, 32(3), 586–596.
Machado, J., & Mata, J. (2005). Counterfactual decomposition of changes in wage
distributions using quantile regression. Journal Applied Economics, 20, 445–446.
Mincer, A. J. (1974). Introduction to schooling, experience, and earnings. NBER Chapters. In
Schooling, experience, and earnings (pp. 1–4). National Bureau of Economic Research, Inc.
Pham, T.-H., & Reilly, B. (2007). The gender pay gap in Vietnam, 1993–2002: A quantile
regression approach. Journal of Asian Economics, 18(5), 775–808.