Ebook Financial accounting - An introduction to concepts, methods, and uses (13/E): Part 2
Bạn đang xem bản rút gọn của tài liệu. Xem và tải ngay bản đầy đủ của tài liệu tại đây (28.12 MB, 481 trang )
C H A P T E R
Notes, Bonds, and Leases
3. Understand the application of the fair
value option to financial liabilities.
4. Develop an ability to distinguish
between capital or finance leases and
operating leases based on their economic characteristics, accounting criteria,
and financial statement effects.
5. Develop the skills to account for capital
or finance leases and operating leases.
1. Develop the skills to compute the issue
price, carrying value, and current fair
value of notes and bonds payable in an
amount equal to the present value of the
future contractual cash flows by applying
the appropriate discount rate.
2. Understand the effective interest
method, and apply it to debt
amortization.
L E A R N I N G
OBJECTIVES
C
hapter 8 indicated that firms typically finance current operating assets, such as accounts
receivable and inventories, with short-term borrowing or trade credit (delayed payments to
suppliers). Firms use the cash received from customers within the next several months to repay
short-term lenders and suppliers. Firms typically finance long-term assets, particularly property, plant, and equipment, with long-term borrowing or funds provided directly or indirectly
by shareholders. This chapter discusses the accounting for long-term borrowing arrangements
(that is, those requiring repayment later than one year from the date of the balance sheet).
The more long-term debt in a firm’s capital structure, the greater the risk that the firm
will experience difficulty making the required payments when due and, therefore, the greater
is the risk of default or bankruptcy. Financial analysts use several financial statement ratios
to assess risk related to long-term borrowing. One financial ratio is the long-term debt ratio.
This ratio relates the amount of long-term debt to the amount of total financing.
Long-Term
Debt Ratio
ϭ
Long-Term Debt
Liabilities 1 Shareholders’ Equity
The debt-equity ratio relates long-term debt to shareholders’ equity,1 indicating the relative mix of long-term financing obtained from lenders versus owners.
Debt-Equity
Ratio
ϭ
Long-Term Debt
Shareholders’ Equity
1In
classic usage, the word equity refers to any item on the right-hand side of the balance sheet—any source
of funding for a firm. Modern business usage has come to restrict the word equity to mean only shareholders’
equity, both contributed capital and retained earnings. Still, current usage is sufficiently diverse that you should
understand the meaning others have in mind when they use it.
461
462
Chapter 10
Notes, Bonds, and Leases
EXHIBIT 10.1
Debt Ratios for Four Firms
Firm
Tokyo Electric . . . . . . . . . . .
Boise Cascade . . . . . . . . . . .
WPP Group . . . . . . . . . . . . .
Intel . . . . . . . . . . . . . . . . .
Long-Term
Debt Ratio
Debt-Equity
Ratio
Property, Plant, and
Equipment/Total Assets
43.4%
44.9%
8.3%
3.8%
193.5%
59.1%
24.1%
5.0%
81.5%
54.1%
2.8%
36.4%
Exhibit 10.1 presents these two debt ratios, as well as the ratio of property, plant, and
equipment to total assets, for four firms in different industries. We use these ratios to assess
the relations among a firm’s industry economic characteristics; its use of property, plant, and
equipment; and its use of long-term debt financing.
Tokyo Electric Tokyo Electric is a regulated monopoly providing electric services in Japan.
Property, plant, and equipment dominate the asset side of the balance sheet. It relies more
on long-term debt than shareholders’ equity to finance these facilities (as a debt-equity ratio
exceeding 100% indicates). The regulated monopoly status practically eliminates the risk of
default or bankruptcy, so Tokyo Electric faces a relatively low borrowing cost. Its production
and transmission facilities also serve as collateral for the debt, meaning that lenders can sell
the facilities and use the cash proceeds to repay the debt in the event Tokyo Electric does not
do so.
Boise Cascade Boise Cascade, a United States-based company, processes wood pulp into
paper products in fixed-asset intensive facilities. It has the second largest ratio of property,
plant, and equipment to total assets and the second largest debt-equity ratio of the four firms.
Boise Cascade carries higher levels of risk than Tokyo Electric. First, Boise Cascade does not
have the regulated, monopoly status of Tokyo Electric. Thus, market forces and not regulation set the prices for its products. Second, the sales of Boise Cascade are more sensitive to
changes in the level of business activity than those of Tokyo Electric. Third, Boise Cascade
has fewer assets to serve as collateral for borrowing. The higher risk of Boise Cascade raises
its borrowing costs and decreases its reliance on debt financing.
WPP Group WPP Group is a United Kingdom-based communication services firm whose
employees provide advertising, market research, public relations, and other services worldwide. Other than relatively small amounts of equipment, it owns virtually no property, plant,
and equipment (it leases most of its office space). Of the four firms considered in this example, it exhibits the lowest fixed asset intensity and the second lowest debt-equity ratio. WPP
Group creates value from employees’ services, not from operating assets, so there is neither the
need nor the ability to borrow long-term using property, plant, and equipment as collateral.
Intel Intel is a United States-based designer and manufacturer of semiconductors. It manufactures semiconductors in fixed-asset intensive plants. The moderate fraction of its total
assets that are property, plant, and equipment results from depreciating its technologyintensive manufacturing facilities over periods as short as four years. Intel has the smallest
long-term debt and debt-equity ratios of the four firms in this example. There are at least two
reasons for this relatively low reliance on debt financing. First, Intel is exceptionally profitable and therefore generates funds from operations. Second, Intel incurs substantial technology risk from product obsolescence, with product life cycles of less than two years. Heavy
reliance on debt financing would add financing risk and thereby increase borrowing costs
even more.
These examples illustrate the importance of understanding a firm’s industry economic
characteristics when analyzing long-term debt and assessing risk. This chapter discusses the
recognition and measurement of long-term debt. Which obligations of a firm do U.S. GAAP
and IFRS recognize as long-term debt? How do U.S. GAAP and IFRS measure the amount
that firms report as debt on the balance sheet? With a few exceptions, the accounting for debt
Overview of Long-Term Debt Markets
under U.S. GAAP and IFRS is similar. We consider notes, bonds, and leases in this chapter.
The next section discusses notes and bonds. A later section discusses leases.
OVERVIEW OF LONG-TERM DEBT MARKETS
This section provides a brief description of debt markets to enhance understanding of the
accounting for long-term debt discussed in later sections. Debt markets have a unique vocabulary, so be prepared to encounter new terms.
SOURCES OF LONG-TERM DEBT FINANCING
Firms that need cash for long-term purposes, such as acquiring buildings and equipment or
financing a business acquisition, and that wish to use debt as a means of obtaining cash, will
do one of two things:
1. Borrow from commercial banks, insurance companies, or other financial institutions.
2. Issue bonds in the capital markets.
Loans from commercial banks and other financial institutions often require firms to
pledge assets as collateral. For example, a firm borrowing to finance the acquisition of equipment would likely pledge the equipment as collateral. If the firm fails to maintain specified
levels of financial health while the loan is outstanding or does not pay principal and interest
on the loan when due, the lender has the right to seize the collateral and sell it to satisfy the
amounts due. Common terminology refers to the financial contract underlying bank loans as
a note, so that these loans usually appear on the balance sheet under the title Notes Payable.
Notes of business firms generally have maturity dates less than approximately ten years and
arise from borrowing from a single lender. Borrowing from a single lender avoids some of
the reporting requirements of more public issues of debt. However, no public market for the
debt exists in this case, so the borrower will have difficulty disengaging from the borrowing
arrangement prior to maturity.
Most firms issue bonds on the market to satisfy their long-term needs for cash. A bond
is a financial contract, similar in concept to borrowing agreements with banks or insurance
companies, in which the borrower and the lender agree to certain conditions about repayment
of the bonds, operating policies, other borrowing activities while the bonds are outstanding, and other provisions. Bond indenture refers to the financial contract underlying bonds.
Bonds appear on the balance sheet under the title Bonds Payable. In contrast to notes, bonds
typically carry maturity dates longer than approximately ten years and involve many lenders
instead of a single lender. Firms classify the portion of bonds due within the next year as a
current liability and the remaining portion as a noncurrent liability. Firms must also disclose
a list of their long-term debt obligations in notes to the financial statements.
VARIETY OF BOND PROVISIONS
Bond issues vary with respect to their specific provisions. For example, particular collateral
might back up bonds (a secured borrowing), or firms might issue bonds based only on their
credit worthiness as an entity. Such unsecured borrowing means that lenders must rely on
assets not pledged as collateral for other loans in the event the firm cannot repay the bonds.
Unsecured borrowing might carry senior rights or subordinated rights in the event of bankruptcy. Senior debt holders have a higher priority for payment in the event of bankruptcy
than subordinated (junior) unsecured lenders.
Bonds also vary in terms of their payment provisions. The typical debenture bond pays
interest periodically, usually every six months, during the life of the bond and repays the principal amount borrowed at maturity. A serial bond requires periodic payments of interest plus
a portion of the principal throughout the life of the bond. A zero coupon bond provides for
no periodic payments of interest while the bond is outstanding; the bond requires payment
of all principal and interest at maturity. A later section defines principal and interest more
precisely.
Convertible bonds permit the holder to exchange the bonds for shares of the firm’s common stock under certain conditions. This conversion option has value because the holder
463
464
Chapter 10
Notes, Bonds, and Leases
can benefit from some of the later increases in the market value of the firm’s common stock
after issuance of the bonds. If holders do not convert the bonds into common stock prior to
maturity, the issuing firm repays the debt at maturity, the same as for nonconvertible bonds.
We discuss convertible bonds more fully in Chapter 14.
Some bonds are callable, which means the issuing firm has the right to repurchase the
bonds prior to maturity at a specified price. An issuing firm might exercise this call provision if interest rates decline after the initial issuance of the bonds. The firm can borrow at
the lower interest rate and use the proceeds to finance the repurchase of the bonds initially
issued.
Investors in bonds sometimes hold a put option, meaning they can force the issuing company to repay the bonds prior to maturity under specified contractual conditions. Investors
might exercise this put option if interest rates increase, and investors can reinvest the cash
proceeds in debt securities with a higher yield.
Bonds can carry either fixed interest rates or variable interest rates. Bonds with fixed interest rates pay interest at that fixed rate throughout the life of the bond. Bonds with variable
interest rates pay interest at rates that change during the life of the bond. The bond indenture
specifies the formula for the periodic calculation of the variable interest rate.
Industry economic characteristics, the financial health of a firm, and the particular provisions of a bond issue combine to determine the risk of investing in the bond, which in turn
affects the interest rate investors demand and therefore the bond’s price. The next section
discusses the measurement of financial instruments in general. Subsequent sections discuss
the measurement of notes, bonds, and leases. To understand the calculations illustrated in the
remainder of this chapter, you will need to understand compound interest and its use in computing the present value of future cash flows. The Appendix at the back of the book discusses
compound interest.
MEASUREMENT OF FINANCIAL INSTRUMENTS: GENERAL PRINCIPLES
We use the term financial instrument to refer to a financial arrangement in which a firm contracts to receive or make specified payments in the future in return for cash or other resources
paid or received currently. Notes, bonds, and leases are financial instruments. Derivatives,
discussed in Chapter 12, are also financial instruments. A characteristic of these examples of
financial instruments is that they specify the means of calculating the amounts that firms will
receive or pay at specified times in the future.
The accounting measurement of notes and bonds payable follows two general principles:
1. The amount borrowed initially and the market value of a note or bond at any date subsequent to the initial borrowing equals the present value of the future, or remaining, cash
flows discounted at an appropriate interest rate (discussed next).
2. The internal rate of return, often called yield to maturity, is the discount rate that equates
the future cash flows to the market value at any date. Common terminology also refers
to this rate as the market interest rate. When a financial instrument does not specify the
internal rate of return, the investor can solve for this rate, called the implicit interest rate,
following procedures described in the Appendix. On the date of initial issuance, the market value will equal the initial issue proceeds—the amount borrowed. To understand the
accounting for notes and bonds, we need two additional definitions:
◾ Historical Market Interest Rate: The discount rate prevailing at the date of the initial
borrowing. Discounting the contractual cash flows at this rate equates the present
value of future cash flows to the amount initially borrowed—the market value on the
initial issue date.
◾ Current Market Interest Rate: The discount rate at any date subsequent to the date of
the initial borrowing. Discounting the contractual cash flows at this rate equates the
present value of remaining cash flows to the market value at the subsequent measurement date.
Later sections of this chapter indicate that U.S. GAAP and IFRS permit firms to account
for notes and bonds under one of two approaches:
1. Amortized Cost Use the historical market interest rate to compute the carrying value of
notes and bonds while these obligations are outstanding and disclose in the notes to the
financial statements the fair value of these financial instruments based on the current
Accounting for Notes
market interest rate. This approach dominates current financial reporting, so this chapter
focuses on it.
2. Fair Value Measure notes and bonds at fair value each period, in effect using the current
market interest rate instead of the historical market interest rate to discount the remaining cash flows. The FASB and the IASB refer to this approach as the fair value option.2 A
later section of this chapter describes and illustrates the fair value option.
ACCOUNTING FOR NOTES
Firms typically borrow from banks, insurance companies, and other financial institutions by
signing a note, which specifies the terms of the borrowing arrangement.
Example 1 Newsom Company borrows $800,000 from its bank to purchase a tract of land
on January 1, 2008. The firm pledges the land as collateral for the loan. Interest accrues on
the unpaid balance of the loan at a rate of 6% compounded semiannually (that is, 3% each six
months). The borrower must make payments of $93,784.41 on June 30 and December 31 of
each year for five years.3
Initial Valuation The initial valuation of this loan is the $800,000 amount borrowed.
This amount equals the present value of the future cash payments discounted at the yield
required by the lender, which we assume is also 6% compounded semiannually (final calculations taken to more decimal points than shown):4
Present Value of an Annuity of $93,784.41 per Period for 10 Periods at
3% per Period: $93,784.41 3 8.53020 . . . . . . . . . . . . . . . . . . . . . . . . . . . . . . . . . . .
$800,000.00
These calculations illustrate an important concept: When the stated interest rate for a loan
(6% compounded semiannually in this example) equals the yield required by the lender (also 6%
compounded semiannually), then the amount borrowed equals the principal amount of the loan
(also called the face value in the case of bonds). The significance of this concept will become
more apparent when we consider how to measure the carrying value of bonds.
The entries to record the loan and the purchase of land on the books of Newsom Company are as follows:
January 1, 2008
Cash . . . . . . . . . . . . . . . . . . . . . . . . . . . . . . . . . . . . . . . . . . . . . . . . . .
Note Payable . . . . . . . . . . . . . . . . . . . . . . . . . . . . . . . . . . . . . . .
Assets
1800,000
=
Liabilities
+
Shareholders’
Equity
800,000
800,000
(Class.)
1800,000
To record $800,000 loan received from bank for five years at 6% compounded
semiannually requiring payments of $93,784.41 at the end of each six months.
2Financial
Accounting Standards Board, Statement of Financial Accounting Standards No. 159, “The Fair
Value Option for Financial Assets and Financial Liabilities,” 2007 (Codification Topic 825); International
Accounting Standards Board, International Accounting Standard 39, “Financial Instruments: Recognition and
Measurement,” 1999, revised 2003.
3Example 9 in the Appendix shows the derivation of the $93,784.41 payment.
4The illustrations in this chapter use present value factors using 15 significant digits in the computer, but
rounded to five digits after the decimal for presentation here. The Appendix illustrates the use of Excel® to perform these calculations. The inputs into Excel for the present value of an annuity are ϭPV(interest rate, number of periods, periodic payment, future value, type). The inputs for this note are ϭPV(.03,10,93784.41,0,0),
although Excel does not require the last two zeros.
465
466
Chapter 10
Notes, Bonds, and Leases
January 1, 2008
Land. . . . . . . . . . . . . . . . . . . . . . . . . . . . . . . . . . . . . . . . . . . . . . . . . .
Cash. . . . . . . . . . . . . . . . . . . . . . . . . . . . . . . . . . . . . . . . . . . . .
Assets
=
Liabilities
+
Shareholders’
Equity
800,000
800,000
(Class.)
1800,000
2800,000
To record the purchase of land for $800,000 cash.
Measurement Subsequent to the Date of the Initial Loan During the first six
months, interest of $24,000 (ϭ .03 ϫ $800,000) accrues on the loan. The firm then makes the
required cash payment of $93,784.41. The entry to record interest expense, the loan payment,
and the reduction in the amount of the Note Payable is as follows:
June 30, 2008
Interest Expense . . . . . . . . . . . . . . . . . . . . . . . . . . . . . . . . . . . . . . . . .
Note Payable . . . . . . . . . . . . . . . . . . . . . . . . . . . . . . . . . . . . . . . . . . . .
Cash. . . . . . . . . . . . . . . . . . . . . . . . . . . . . . . . . . . . . . . . . . . . .
Assets
293,784.41
=
Liabilities
269,784.41
+
Shareholders’
Equity
(Class.)
224,000
IncSt S RE
24,000.00
69,784.41
93,784.41
To record interest expense, cash payment, and reduction in Note Payable for
first six months.
Thus, the carrying value of the loan changes during this first six months as follows:
Balance in Note Payable on January 1, 2008 . . . . . . . . . . . . . . . . . . . . . . . . . . . . . . .
Plus Interest for First Six Months: .03 3 $800,000 . . . . . . . . . . . . . . . . . . . . . . . . . . .
Less Cash Payment on June 30, 2008 . . . . . . . . . . . . . . . . . . . . . . . . . . . . . . . . . . . .
Balance in Note Payable on June 30, 2008 . . . . . . . . . . . . . . . . . . . . . . . . . . . . . . . .
$800,000.00
24,000.00
(93,784.41)
$730,215.59
The carrying value of the loan on June 30, 2008, equals the present value of the remaining
cash flows discounted at 6% compounded semiannually (except for minor rounding differences), as the following computations show:
Present Value of an Annuity of $93,784.41 per Period for 9 Periods at
3% per Period: $93,784.41 3 7.78611 . . . . . . . . . . . . . . . . . . . . . . . . . . . . . . . . . .
$730,215.62
These calculations illustrate a second important concept: The amount reported on the balance sheet throughout the life of a loan (that is, its carrying value) equals the present value
of the remaining cash flows discounted at the historical market interest rate (6% compounded
semiannually in this example). The current market interest rate usually differs from the historical market interest rate during the life of the loan. A firm that does not account for long-term
notes and bonds using the fair value option (discussed later), uses the historical market interest
rate to account for the loan while it is outstanding.
Amortization Schedule Exhibit 10.2 presents an amortization schedule for this loan. It
shows the amount of interest expense and cash payments each six months and the resulting
reduction in the carrying value of the loan during the ten periods. The interest expense equals
the required yield (3% each six months) times the unpaid balance of the loan at the beginning of each six-month period. Common terminology refers to the calculations illustrated in
Exhibit 10.2 for amortizing a financial instrument to its maturity value over time as the effective interest method. The effective interest method has the following features:
1. The note, bond, or other financial instrument will appear on the balance sheet both initially and at each subsequent date at the present value of the remaining cash flows discounted at the historical market interest rate (that is, its initial yield to maturity).
Accounting for Notes
EXHIBIT 10.2
Amortization Schedule for $800,000 Loan, Repaid
in 10 Semiannual Installments of $93,784.41.
Interest Rate Is 6% Compounded Semiannually
(3% compounded each six months)
Period
(1)
Balance at
Beginning
of Period
(2)
Interest
Expense
for Period
(3)
Cash
Payment
(4)
Portion of
Payment Reducing
Principal
(5)
Balance
at End
of Period
(6)
1
2
3
4
5
6
7
8
9
10
$800,000.00
$730,215.59
$658,337.65
$584,303.37
$508,048.06
$429,505.09
$348,605.83
$265,279.60
$179,453.58
$ 91,052.77
$24,000.00
$21,906.47
$19,750.13
$17,529.10
$15,241.44
$12,885.15
$10,458.17
$ 7,958.39
$ 5,383.61
$ 2,731.64
$93,784.41
$93,784.41
$93,784.41
$93,784.41
$93,784.41
$93,784.41
$93,784.41
$93,784.41
$93,784.41
$93,784.41
($69,784.41)
($71,877.94)
($74,034.28)
($76,255.31)
($78,542.97)
($80,899.26)
($83,326.24)
($85,826.02)
($88,400.80)
($91,052.77)
$730,215.59
$658,337.65
$584,303.37
$508,048.06
$429,505.09
$348,605.83
$265,279.60
$179,453.58
$ 91,052.77
0
Column (2) ϭ Column (6) from previous period.
Column (3) ϭ .03 ϫ Column (2), except for period 10, where it is the amount such that
Column (3) ϭ Column (4) Ϫ Column (5).
Column (4) is given.
Column (5) ϭ Column (4) Ϫ Column (3).
Column (6) ϭ Column (2) Ϫ Column (5).
2. The amount of interest expense each period equals the historical market interest rate
times the carrying value of the financial instrument at the beginning of each period.
We can illustrate again the general principal that the carrying value of this loan at the end
of any period equals the present value of the remaining cash flows. Take, for example, the
loan balance of $265,279.60 at the end of Period 7. At the end of Period 7, three semiannual
payments of $93,784.41 remain (for Periods 8, 9, and 10). Following is the present value of
these cash flows:
Present Value of an Annuity of $93,784.41 per Period for 3 Periods at
3% per Period: $93,784.41 3 2.82861 . . . . . . . . . . . . . . . . . . . . . . . . . . . . . . . . . . .
$265,279.64
As before, minor differences in measurement arise because of rounding.
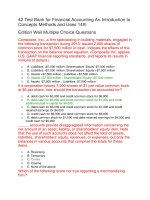
The carrying value of the note changes each period, increasing to reflect the nearer in
time of all remaining cash flows and decreasing for the payment of interest and principal.
This pattern appears in Exhibit 10.3.
PROBLEM 10.1 for Self-Study
Implicit interest rate and amortization schedule for interest-bearing note. Vera Company
receives cash of $97,375.69 in return for a three-year $100,000 note, promising to pay
$6,000 at the end of one year, $6,000 at the end of two years, and $106,000 at the end
of three years.
a. Demonstrate that the required yield, or implicit interest rate, on this loan is 7%
compounded annually.
b. Prepare an amortization schedule for this loan similar to that in Exhibit 10.2.
467
468
Chapter 10
Notes, Bonds, and Leases
Change in Carrying Value of $800,000 Note Accruing
Interest at 6% Compounded Semiannually and Requiring
Semiannual Payments of $93,781.41 for Five Years
EXHIBIT 10.3
Carrying
Value
$1,000,000
$800,000
$600,000
$400,000
$200,000
Periods
$0
1
2
3
4
5
6
7
8
9
10
ACCOUNTING FOR BONDS
Firms typically issue bonds on the market to large numbers of debt investors to obtain cash
for long-term purposes. As previously explained, the provisions of bond issues vary widely,
depending on the firm’s cash needs over time and the preferences of investors in the bonds.
Investment bankers often advise corporate borrowers on the sorts of financial instruments
the lending market appears to prefer at the time the firm wants to borrow.
CASH FLOW PATTERNS FOR BONDS
Bonds vary with respect to the pattern of cash payments made by the borrower to debt investors. Three common types of bonds are coupon bonds, serial bonds, and zero coupon bonds.
Example 2 Ford Motor Company issues $250 million of 8%, semiannual, 20-year coupon
bonds. The bond indenture requires Ford to make coupon payments of $10 million (ϭ .08 ϫ
$250 million ϫ 6/12) every six months for 20 years and to repay the $250 million principal at
the end of 20 years. Common terminology refers to the $250 million as the principal or face
value of the bond and the 8% rate as the coupon interest rate. In this case the $250 million
is also the maturity value of the bonds. The term face value refers to the principal amount
printed on the face of the bond certificate. The principal or face value is the base for computing the amount of each semiannual coupon payment.5 At one time the bond certificate
would have coupons attached, with each coupon equal to 4% of the principal amount and
each dated, with dates six months apart. Investors would clip the predated coupons from
the bond certificate each six months and deposit them in their bank accounts, just as they
would deposit a check they had received. Although checks or electronic funds transfers have
replaced coupons, the term coupon remains in use. Thus, the 8% coupon rate multiplied times
the $250 million principal equals the annual cash payment of $20 million, which Ford pays in
two semiannual installments of $10 million each.
5Almost
everyone in business refers to the periodic payment as “interest payments.” The term causes confusion because, as you will soon see, the amount of interest expense for a period almost never equals the amount
of these same payments for that same period. The periodic payment will always include some amount to pay
interest to the lender, but not necessarily all interest accrued since the last payment. If the payment exceeds all
interest, then the payment will discharge some of the principal amount. Both payment of interest and payment
of principal serve to reduce the debt, so one all-purpose term used for the payments is debt service payments.
Accounting for Bonds
Example 3 Chrysler Corporation issues $180 million of 15-year serial bonds. The bond
indenture requires Chrysler to pay $10,409,418 every six months for 15 years. Each periodic
payment includes interest plus repayment of a portion of the principal. The principal or face
value of this bond is $180 million. This bond does not specify a stated interest rate, but each
payment includes implicit interest. We discuss serial bonds more fully later in this chapter.
Example 4 General Motors Corporation issues $300 million of 10-year zero coupon bonds.
These bonds do not require periodic payments of interest. Instead the $300 million maturity
value includes both principal and interest. Although these bonds do not state an interest rate,
there is an implicit interest rate embedded in the maturity value. We consider zero coupon
bonds in greater depth later in this chapter.
REVIEW OF BOND TERMINOLOGY
Let’s take a moment to review to this point:
1. The bond contract specifies the basis for computing all future cash flows for that bond
issue. Identifying those cash flows is the starting point to account for the bond both initially and at each subsequent measurement date.
2. Terminology with respect to bonds includes the following:
a. Face Value: The amount printed on the face of the bond certificate that serves as the
basis for computing periodic coupon payments on coupon bonds.6 The face value
equals the maturity value on coupon bonds and on zero coupon bonds but not on
serial bonds.
b. Principal: The same as face value on coupon bonds and serial bonds but not on zero
coupon bonds.
c. Maturity Value: The amount paid by the issuer at the maturity date of bonds. The
maturity value equals the face value on coupon bonds and on zero coupon bonds.
d. Market Value: The amount at which bonds sell in the market either at date of issue or
at any subsequent date while the bonds are outstanding. Firms that account for bonds
using the fair value option, discussed in a later section, can use market value to measure fair value.
e. Coupon Interest Rate: The interest rate stated in the bond contract that when multiplied times the face value or principal amount of coupon bonds equals the required
annual cash payment. The stated coupon rate is always an annual rate. The issuer
might pay this required annual amount in more than one installment during the year,
typically semiannually. For example, if the coupon rate is 6% payable semiannually,
the issuer pays interest of 3% every six months. The frequency of payment affects
the yield on the bond and the amortization calculations. The coupon rate need not
equal the historical market interest rate, a possibility we discuss more fully later in the
chapter.
f. Historical Market Interest Rate or Initial Yield to Maturity: The interest rate that discounts all future cash flows such that their present value equals the initial issue price
of the bond.
g. Current Market Interest Rate: The interest rate that discounts all future cash flows
such that their present value equals the current market price of the bond.
INITIAL MEASUREMENT OF BONDS
The initial issue price of a bond depends on two factors:
1. The promised cash payments indicated in the bond contract as discussed in the preceding
section.
2. The yield to maturity required by investors to induce them to purchase the bonds, which
the next section discusses and illustrates.
6Common
terminology also refers to the face value of bonds as par value. To reduce ambiguity, we use face
value in reference to bonds and par value in reference to common and preferred shares in this book.
469
470
Chapter 10
Notes, Bonds, and Leases
Example 2 (continued) The bonds of Ford in Example 2 require Ford to pay $10 million
at the end of every six months and to repay the $250 million principal at the end of 20 years.
The time line (see Appendix for description of time lines) for this semiannual coupon bond
covers 40 six-month periods as depicted in the following graph (amounts in millions):
End of Period
0
x
c
$10
$10
$10
$10
...
...
1
2
3
4
...
$250
$10
40
Assume that the market requires a yield to maturity for the bonds of Ford of 8% compounded semiannually. Thus, the initial issue price for these bonds is $250 million, computed
as follows (calculations based on spreadsheet computational accuracy, then rounded to the
nearest dollar):
Present Value of an Annuity of $10 million for 40 Periods at
4% per Period: $10 million 3 19.79277 . . . . . . . . . . . . . . . . . . . . . . . . . . . . . . . .
Present Value of $250 million for 40 Periods at 4% per Period:
$250 million 3 .20829 . . . . . . . . . . . . . . . . . . . . . . . . . . . . . . . . . . . . . . . . . . .
Initial Issue Price . . . . . . . . . . . . . . . . . . . . . . . . . . . . . . . . . . . . . . . . . . . . . . . .
$197,927,7397
52,072,2618
$250,000,0009
Note the concept described earlier in Example 1: when the coupon rate equals the historical market interest rate or initial yield to maturity, then the initial issue price equals the face
value of the bonds.
Example 3 (continued) Now consider the valuation of the serial bonds of Chrysler.
Chrysler must pay $10,409,418 at the end of every six months for 15 years. The time line is as
follows (amounts in millions):
End of Period
0
x
c
$10.4
$10.4
$10.4
$10.4
...
...
$10.4
1
2
3
4
...
30
Assume that the market requires a yield to maturity of 8% compounded semiannually
to induce investors to purchase these bonds. The computation of the initial issue price is as
follows:
Present Value of an Annuity of $10,409,418 million for 30 Periods at
4% per Period: $10,409,418 million 3 17.29203 . . . . . . . . . . . . . . . . . . . . . . . . . . .
$180,000.00
An initial issue price equal to the face value of the bonds means that the implicit interest
rate equals the yield to maturity.
Example 4 (continued) The bonds of General Motors require a payment of $300 million
at the end of 10 years. The time line is as follows (amounts in millions):
End of Period
0
x
c
1
2
3
4
...
...
$300
...
10
inputs in an Excel spreadsheet are ϭPV(.04,40,10000000,0,0).
inputs in an Excel spreadsheet are ϭPV(.04,40,0,250000000,0).
9The inputs in an Excel spreadsheet to solve simultaneously for the present value of the interest and principal
payments are ϭPV(.04,40,10000000,250000000,0).
7The
8The
Accounting for Bonds
Assume that, like Ford and Chrysler, the market requires the bonds of General Motors to
yield 8% compounded semiannually. The computation of the initial issue price is as follows:
Present Value of $300 million for 20 Periods at 4% per Period:
$300 million 3 .45639 . . . . . . . . . . . . . . . . . . . . . . . . . . . . . . . . . . . . . . . . . . . .
$136,916,084
The face value and maturity value of the bonds exceed the issue price. The difference between the face value and the present value of $163,083,916 (ϭ $300,000,000 Ϫ
$136,916,084) represents interest on the $136,916,084 amount borrowed. To see this, note
that the future value of $136,916,084 for 20 periods at 4% is $300,000,000 (ϭ $136,916,084
ϫ 2.19112). Bond investors pay General Motors $136,916,084 today for the right to receive
$300,000,000 ten years from today. This calculation demonstrates that investors earn interest
on the amounts invested, but they receive it all at maturity. The interest rate on zero coupon
bonds is an implicit interest rate, because it is implied by the difference between the face
amount paid at maturity and the initial issue price.
PROBLEM 10.2 for Self-Study
Amortization Schedules for Bonds
a. Using a spreadsheet program such as Excel, prepare amortization schedules such as
that in Exhibit 10.2 for each of the three bond issues in Examples 2, 3 and 4 above.
b. Why does the amount of the coupon bond at the end of each six-month period
continue to equal $250 million?
c. Why does the amount of the serial bond at the end of each six-month period decline
to zero over the 15 years?
d. Why does the amount of the zero coupon bond increase to $300 million over the
10-year period?
Example 2 (continued) Extended for Bonds Issued for More or Less Than Face
Value It is unusual that the coupon rate on a bond exactly equals the yield to maturity that
debt investors require on the date of a new bond issue. Preparing a new bond issue for the
market requires months of effort. Market interest rates will likely change between the time
the issuing firm specifies the coupon rate in the bond contract and in other documents and
the day when the firm issues the bond. The difference in rates is usually small (except for zero
coupon bonds), but the accounting for the bond must address the differences. Whenever the
coupon rate differs from the market-required yield to maturity, the issue price will differ from
the face value of the bonds. The following generalizations apply:
1. When the market-required yield to maturity exceeds the coupon rate, the bonds initially
sell for less than, or a discount to, face value.
2. When the market-required yield to maturity is less than the coupon rate, the bonds initially sell for more than, or a premium to, face value.
For example, assume that the market-required yield to maturity of the bonds of Ford is
10% compounded semiannually. The initial issue price is as follows:
Present Value of an Annuity of $10 million for 40 Periods at
5% per Period: $10 million 3 17.15909 . . . . . . . . . . . . . . . . . . . . . . . . . . . . . . . .
Present Value of $250 million for 40 Periods at 5% per Period:
$250 3 .14205 . . . . . . . . . . . . . . . . . . . . . . . . . . . . . . . . . . . . . . . . . . . . . . . .
Initial Issue Price . . . . . . . . . . . . . . . . . . . . . . . . . . . . . . . . . . . . . . . . . . . . . . . .
$171,590,860
35,511,421
$207,102,281
If lenders paid the $250 million face value for Ford’s bonds, they would realize a yield to
maturity of 8%. Lenders who require a yield of 10% would not pay $250 million because the
value of the promised payments discounted at 10% is only $207,102,281. The lack of investor
demand for the bonds at this price results in a decline in the market price to $207,102,281, at
471
472
Chapter 10
Notes, Bonds, and Leases
which price the bonds provide the required yield to maturity of 10% compounded semiannually. The difference between the $207,102,281 initial issue price and the $250,000,000 maturity
value represents additional interest that Ford pays at maturity. Thus, total interest expense on
this bond equals $442,897,719 [ϭ ($10 million ϫ 40) ϩ ($250,000,000 Ϫ $207,102,281)]. The
promised cash flows do not change; the bond contract specifies them. The only factor that
changes is the required yield to maturity and thereby the initial issue price.
This example shows that when the yield that investors require (10% in this example)
exceeds the stated coupon rate (8%), the bonds sell at a discount to face value. The difference
between the proceeds and the face value compensates investors for the difference in interest rates. A zero coupon bond, such as that for General Motors in Example 4, is an extreme
example of a bond issued at a discount. The coupon rate is zero, so the difference between the
required yield and the coupon rate equals the required yield.
Let’s examine what happens in the opposite case when the coupon rate exceeds the yield
that investors require. Assume now that bond investors require a return of 6% compounded
semiannually on Ford’s bonds. The computation of the initial issue price is as follows:
Present Value of an Annuity of $10 million for 40 Periods at
3% per Period: $10 million 3 23.11477 . . . . . . . . . . . . . . . . . . . . . . . . . . . . . . . . .
Present Value of $250 million for 40 Periods at 3% per Period:
$250 3 .30656 . . . . . . . . . . . . . . . . . . . . . . . . . . . . . . . . . . . . . . . . . . . . . . . . .
Initial Issue Price . . . . . . . . . . . . . . . . . . . . . . . . . . . . . . . . . . . . . . . . . . . . . . . . .
$231,147,720
76,639,211
$307,786,931
If investors paid $250 million for this bond issue, they would realize a yield to maturity
of 8% compounded semiannually. If investors require a yield of 6% compounded semiannually, competition among investors to purchase the bonds would force the market price of the
bonds up to $307,786,931. At this point the yield to maturity will equal the 6% compounded
semiannually required by the market. The difference between the $307,786,931 cash proceeds
at issuance and the $250,000,000 paid at maturity represents a reduction in interest expense.
Thus, total interest expense over the life of the bonds equals $342,213,069 [ϭ ($10 million ϫ
40) – ($307,786,931 Ϫ $250,000,000)]. As before, the contractual cash flows do not change;
only the yield required by the market changes and thereby the initial issue price.
As a practical matter, one would not expect to encounter coupon rates that differ by 2 percentage points (referred to as 200 basis points) from the yield to maturity (except in the case
of zero coupon bonds). Thus, discounts and premiums encountered in practice seldom differ
from the face value as much as these examples indicate.
PROBLEM 10.3 for Self-Study
Amortization Schedules for Bonds Issued at a Discount and a Premium
a. Using a spreadsheet program such as Excel, prepare amortization schedules similar
to those in Exhibit 10.2 for the bonds of Ford issued as a discount and issued at a
premium using the initial issue prices shown above.
b. Does the additional interest expense for bonds issued at a discount and the reduction in interest expense for bonds issued at a premium affect the amount of interest
expense each period or only in the 40th period? Explain.
JOURNAL ENTRIES TO ACCOUNT FOR BONDS
The entries to account for bonds resemble those illustrated previously for notes. The carrying
value of bonds increases each period for interest and decreases for any cash payments made.
Bonds Issued for Less Than Face Value Consider Example 2 discussed previously where Ford issues 20-year, 8% bonds for less than face value to yield 10% compounded
semiannually. The entries at the time of issue and for the first two six-month periods are as
follows:
Accounting for Bonds
January 1, 2008
Cash . . . . . . . . . . . . . . . . . . . . . . . . . . . . . . . . . . . . . . . . . . . . . . . . . .
Bonds Payable . . . . . . . . . . . . . . . . . . . . . . . . . . . . . . . . . . . . . .
Assets
=
1207,102,281
Liabilities
+
Shareholders’
Equity
207,102,281
207,102,281
(Class.)
1207,102,281
To record the issue of $250 million face value, 8% semiannual coupon bonds
priced on the market to yield 10% compounded semiannually.
June 30, 2008
Interest Expense . . . . . . . . . . . . . . . . . . . . . . . . . . . . . . . . . . . . . . . . .
Bonds Payable . . . . . . . . . . . . . . . . . . . . . . . . . . . . . . . . . . . . . .
Cash. . . . . . . . . . . . . . . . . . . . . . . . . . . . . . . . . . . . . . . . . . . . .
Assets
=
210,000,000
Liabilities
+
1355,114
Shareholders’
Equity
(Class.)
210,355,114
IncSt S RE
10,355,114
355,114
10,000,000
To record interest expense of $10,355,114 (5.05 3 $207,102,281), a cash
payment of $10,000,000, and an increase in the carrying value of the bond
for the difference. The carrying value of the bond at the end of the first
six-month period is $207,457,395 (5 $207,102,281 1 $10,355,114 2
$10,000,000).
Following is the entry for the second six months:
December 31, 2008
Interest Expense . . . . . . . . . . . . . . . . . . . . . . . . . . . . . . . . . . . . . . . . .
Bonds Payable . . . . . . . . . . . . . . . . . . . . . . . . . . . . . . . . . . . . . .
Cash. . . . . . . . . . . . . . . . . . . . . . . . . . . . . . . . . . . . . . . . . . . . .
Assets
=
210,000,000
Liabilities
+
1372,870
Shareholders’
Equity
(Class.)
210,372,870
IncSt S RE
10,372,870
372,870
10,000,000
To record interest expense of $10,372,870 (5.05 3 $207,457,395), a cash
payment of $10,000,000, and an increase in the carrying value of the bond
for the difference. The carrying value of the bond at the end of the second six-month period is $207,830,265 (5 $207,457,395 1 $10,372,870 2
$10,000,000).
Interest expense each period exceeds the cash payment of $10 million. The additional
amount of interest expense of $372,870 in the second six-month period represents amortization, using the effective interest method, of the difference between the initial issue price
of $207,102,281 and the $250,000,000 maturity value. Interest expense increases each period
because the carrying value of the liability at the beginning of each period, the base for computing interest expense, increases.
Bonds Issued for More Than Face Value Consider now the entries if Ford issues
the bonds for more than face value to yield 6%, compounded semiannually. The entries at the
time of issue and for the first two six-month periods are as follows:
January 1, 2008
Cash . . . . . . . . . . . . . . . . . . . . . . . . . . . . . . . . . . . . . . . . . . . . . . . . . .
Bonds Payable . . . . . . . . . . . . . . . . . . . . . . . . . . . . . . . . . . . . . .
Assets
1307,786,931
=
Liabilities
+
Shareholders’
Equity
(Class.)
1307,786,931
To record the issue of $250 million face value, 8% semiannual coupon bonds
priced on the market to yield 6% compounded semiannually.
307,786,931
307,786,931
473
474
Chapter 10
Notes, Bonds, and Leases
June 30, 2008
Interest Expense . . . . . . . . . . . . . . . . . . . . . . . . . . . . . . . . . . . . . . . . .
Bonds Payable . . . . . . . . . . . . . . . . . . . . . . . . . . . . . . . . . . . . . . . . . . .
Cash. . . . . . . . . . . . . . . . . . . . . . . . . . . . . . . . . . . . . . . . . . . . .
Assets
=
210,000,000
Liabilities
+
2766,392
Shareholders’
Equity
(Class.)
29,233,608
IncSt S RE
9,233,608
766,392
10,000,000
To record interest expense of $9,233,608 (5.03 3 $307,786,931), a cash payment of $10,000,000, and a decrease in the carrying value of the bond for the
difference. The carrying value of the bond at the end of the first six-month
period is $307,020,539 (5 $307,786,931 1 $9,233,608 2 $10,000,000).
Following is the entry for the second six months:
December 31, 2008
Interest Expense . . . . . . . . . . . . . . . . . . . . . . . . . . . . . . . . . . . . . . . . .
Bonds Payable . . . . . . . . . . . . . . . . . . . . . . . . . . . . . . . . . . . . . . . . . . .
Cash. . . . . . . . . . . . . . . . . . . . . . . . . . . . . . . . . . . . . . . . . . . . .
Assets
=
210,000,000
Liabilities
+
2789,384
Shareholders’
Equity
(Class.)
29,210,616
IncSt S RE
9,210,616
789,384
10,000,000
To record interest expense of $9,210,616 (5.03 3 $307,020,539), a cash
payment of $10,000,000, and an increase in the carrying value of the bond
for the difference. The carrying value of the bond at the end of the second six-month period is $306,231,155 (5 $307,020,539 1 $9,210,616 2
$10,000,000).
Interest expense each period is less than the $10 million cash payment. The reduction in
the amount of interest expense represents amortization, using the effective interest method,
of the difference between the initial cash proceeds of $307,786,931 and the $250,000,000
maturity value. Interest expense decreases each period as the carrying value of the liability at
the beginning of each period decreases.
RETIREMENT OF DEBT
Many bonds remain outstanding until the stated maturity date. Refer to the amortization
table for Ford’s bonds issued for less than face value in the solution to Problem 10.2 for SelfStudy. The entries for the 40th six-month period are as follows:
December 31, 2027
Interest Expense . . . . . . . . . . . . . . . . . . . . . . . . . . . . . . . . . . . . . . . . .
Bonds Payable . . . . . . . . . . . . . . . . . . . . . . . . . . . . . . . . . . . . . .
Cash. . . . . . . . . . . . . . . . . . . . . . . . . . . . . . . . . . . . . . . . . . . . .
Assets
210,000,000
=
Liabilities
12,380,973
+
Shareholders’
Equity
(Class.)
212,380,973
IncSt S RE
12,380,973
2,380,973
10,000,000
To record interest expense of $12,380,973 [5 (.05 3 $247,619,027) 1 $22
for rounding], a cash payment of $10,000,000, and an increase in the carrying value of the bond for the difference. The carrying value of the bond at
the end of the 40th six-month period is $250,000,000 (5 $247,619,027 1
$12,380,973 2 $10,000,000).
Following is the entry to repay the principal amount of the bonds at maturity:
Accounting for Bonds
December 31, 2027
Bonds Payable . . . . . . . . . . . . . . . . . . . . . . . . . . . . . . . . . . . . . . . . . . .
Cash. . . . . . . . . . . . . . . . . . . . . . . . . . . . . . . . . . . . . . . . . . . . .
Assets
=
2250,000,000
Liabilities
+
Shareholders’
Equity
250,000,000
250,000,000
(Class.)
2250,000,000
To record repayment of bonds at maturity.
Firms sometimes reacquire their bonds on the open market before maturity (referred to
as early retirement or early extinguishment of debt). Because interest rates change frequently,
the market price will seldom equal the carrying value of the bonds. Assume, for example,
that the bonds of Ford at the end of Period 30 trade on the market to yield 7% compounded
semiannually. A current market interest rate of 7% implies a market price for the bonds of
$260,395,757, as the following computations show:
Present Value of an Annuity of $10 million for 10 Periods
at 3.5% per Period: $10 million 3 8.31661 . . . . . . . . . . . . . . . . . . . . . . . . . . . . . .
Present Value of $250 million for 10 Periods at 3.5%
per Period: $250 million 3 .70892 . . . . . . . . . . . . . . . . . . . . . . . . . . . . . . . . . . . .
Market Price at the End of Period 30 . . . . . . . . . . . . . . . . . . . . . . . . . . . . . . . . . . . . .
$ 83,166,053
177,229,703
$260,395,757
The carrying value of these bonds at the end of Period 30 is $230,695,649 (see the amortization table for Ford’s bonds issued for less than face value in the solution to Problem 10.3
for Self-Study). Following is the entry to record the purchase for cash and retirement of these
bonds at the end of Period 30:
December 30, 2022
Bonds Payable . . . . . . . . . . . . . . . . . . . . . . . . . . . . . . . . . . . . . . . . . . .
Loss on Retirement of Bonds . . . . . . . . . . . . . . . . . . . . . . . . . . . . . . . . .
Cash. . . . . . . . . . . . . . . . . . . . . . . . . . . . . . . . . . . . . . . . . . . . .
Assets
2260,395,757
=
Liabilities
2230,695,649
+
Shareholders’
Equity
229,700,108
230,695,649
29,700,108
260,395,757
(Class.)
IncSt S RE
To purchase and retire bonds with a carrying value of $230,695,649 for
$260,395,757 and record a loss on the retirement.
Ford incurs a loss on early retirement of these bonds because the current market price
(that is, the price at which investors are willing to buy and sell the bonds) exceeds the carrying value of the bonds on Ford’s balance sheet. The current market price is higher than the
carrying value because the market interest rate on the bonds declined from 10% to 7% since
Ford issued them. A decline in interest rates means that investors now own a bond that provides a 10% return when the market demands a return of only 7%. Investors will not sell a
bond yielding 10% unless the borrower compensates the investor for the difference between
the yield of 10% and the 7% yield the investor will earn from reinvesting the cash proceeds.
In this case the amount of additional compensation is $29,700,108, or the difference between
the market price of the bonds and their carrying value. At this price, investors are indifferent between holding the original 10% bonds and exchanging those bonds and reinvesting the
proceeds in bonds yielding 7%.
DISCLOSURES OF CARRYING AND FAIR VALUES OF DEBT
Authoritative guidance requires firms that account for notes and bonds using the historical
market interest rate to report the carrying values, or book values, on the balance sheet and
475
476
Chapter 10
EXHIBIT 10.4
Notes, Bonds, and Leases
Target Corporation
Disclosures of Long-Term Debt
The carrying value and maturities of our debt portfolio, including swap valuation adjustments for our fair
value hedges, was as follows:
Debt Maturities
February 2, 2008
(dollars in millions)
Due fiscal 2007-2011
Due fiscal 2012-2016
Due fiscal 2017-2021
Due fiscal 2022-2026
Due fiscal 2027-2031
Due fiscal 2032-2037
Total notes and debentures (b)
Capital lease obligations
Less: amounts due within one year
Long-term debt
Rate (a)
4.9%
4.9
5.4
8.7
6.8
6.8
5.5
Balance
$ 5,614
3,893
2,661
64
680
4,051
16,963
127
(1,964)
$15,126
February 3, 2007
Rate (a)
6.2%
5.4
6.8
8.7
6.8
6.3
6.1
Balance
$ 5,931
2,302
362
64
680
551
9,890
147
(1,362)
$ 8,675
(a) Reflects the weighted average stated interest rate as of year-end, including the impact of interest rate swaps.
(b) The estimated fair value of total notes and debentures, excluding swap valuation adjustments, using a discounted cash flow analysis
based on our incremental interest rates for similar types of financial instruments, was $17,117 million at February 2, 2008 and
$10,058 million at February 3, 2007. See Note 20 for the estimated fair value of our interest rate swaps.
Required principal payments on notes and debentures over the next five years, excluding capital lease
obligations and fair market value adjustments recorded in long-term debt, are as follows:
Required Principal Payments
(millions)
Required principal payments
2008
$1,951
2009
$1,251
2010
$2,236
2011
$107
2012
$2,251
Most of our long-term debt obligations contain covenants related to secured debt levels. In addition to a
secured debt level covenant, our credit facility also contains a debt leverage covenant. We are, and expect to
remain, in compliance with these covenants.
to disclose the fair value of these notes and bonds in notes to the financial statements.10 The
fair value of long-term debt is the amount the firm would have to pay to repurchase the debt
on the market in an orderly transaction on the measurement date. The measurement date is
typically the date of the balance sheet. The fair value of bonds traded in an active market is
the market price of the bonds on that date. The fair value of bonds not actively traded is the
present value of the contractual cash payments discounted at the interest rate a lender would
require on the measurement date.
Exhibit 10.4 presents disclosures of long-term debt from the notes to the financial statements of Target Corporation, a retailer. Target Corporation combines notes and debentures
(that is, bonds) and groups them by maturity dates. The firm also indicates the weighted average stated interest rate for each group of debt and for of all of its long-term debt. (The stated
interest rate is similar to the coupon rate and is not the required yield.) Note (b) indicates the
fair value of this debt based on the present value of the contractual cash flows and the incremental borrowing rate of Target Corporation for similar debt. The carrying value of longterm notes and debentures of $16,963 million on February 2, 2008, is less than the fair value
of $17,117 million (see Target Corporation’s note (b) in Exhibit 10.4), suggesting that Target
Corporation’s borrowing costs have decreased, relative to the stated interest rates on existing
10Financial
Accounting Standards Board, Statement of Financial Accounting Standards No. 107, “Disclosures
about Fair Value of Financial Instruments,” 1991 (Codification Topic 825); Statement of Financial Accounting Standards No. 157, “Fair Value Measurements,” 2006 (Codification Topic 820); International Accounting
Standards Board, International Financial Reporting Standard 7, “Financial Instruments: Disclosures,” 2005.
Fair Value Option
debt. Target Corporation includes in long-term debt a minor amount of capital leases, a topic
discussed later in this chapter. The note separates the amount of long-term debt that Target
Corporation must pay within one year and includes the amount in the Current Liabilities section of the balance sheet using the label, current portion of long-term debt. Finally, Target
Corporation shows the principal amount of long-term debt payable each year for the next
five years to assist the analyst in projecting likely cash needs.
FAIR VALUE OPTION
An earlier section indicated that U.S. GAAP and IFRS allow firms to account for certain financial assets and certain financial liabilities, including notes and bonds, using either (1) amortized cost, with measurements based on the historical market interest rate, as illustrated in
previous sections of this chapter, or (2) fair value, with measurements based on current market conditions, including the current market interest rate.11 Chapter 3 introduced fair value
measurement. This section discusses fair value measurement in greater depth and discusses its
implication for measuring financial assets and financial liabilities on the balance sheet and recognizing unrealized gains and losses from changes in fair value on the income statement. This
discussion of the fair value option applies to other items discussed in later chapters as well,
including investments in debt and equity securities and derivatives in Chapter 12.
Authoritative guidance has taken the position that measurements of financial assets and
financial liabilities at fair value provide more relevant and reliable information than costbased measurements. Accounting for notes and bonds using the historical market interest
rate under the amortized cost approach is a cost-based approach. U.S. GAAP and IFRS
already require firms to report certain financial instruments related to hedging activities at
fair value,12 a topic discussed in Chapter 12. Standard-setting bodies, however, are not yet
prepared to require fair value measurement for all financial assets and financial liabilities.
Thus, they view the option to account for selected financial assets and financial liabilities as
an interim step toward reporting all financial instruments at fair value.
Firms can choose between fair value measurement and the amortized cost approach based
on historical market interest rates on a case-by-case (instrument-by-instrument) basis. Firms
make this choice when they first adopt the FASB Statement No. 159 or IAS 39 or when they
subsequently acquire a financial asset or incur a financial liability. The choice to use the fair
value option is generally irrevocable.
Statement No. 15713 sets forth the requirements for measuring fair value. Perhaps because
it views the fair value option as an interim step, the FASB did not provide detailed requirements for applying fair value measurements to the calculation of net income. A later section
illustrates one possible way to calculate the income effects of notes and bonds under the fair
value option.
UNDERLYING CONCEPTS FOR FAIR VALUE OPTION
Fair value is the amount a firm would receive if it sold an asset or would pay if it transferred,
or settled, a liability in an orderly transaction at the measurement date. Determining fair value
11Financial
Accounting Standards Board, Statement of Financial Accounting Standards No. 159, “The Fair
Value Option for Financial Assets and Financial Liabilities,” 2007 (Codification Topic 825); International
Accounting Standards Board, International Accounting Standard 39, “Financial Instruments: Recognition and
Measurement,” 1999, revised 2003.
12Financial Accounting Standards Board, Statement of Financial Accounting Standards No. 133, “Accounting for
Derivative Instruments and Hedging Activities,” 1998 (Codification Topic 815); International Accounting Standards Board, International Accounting Standard 39, “Financial Instruments: Recognition and Measurement.”
13Financial Accounting Standards Board, Statement of Financial Accounting Standards No. 157, “Fair Value
Measurements,” 2006 (Codification Topic 820). IFRS contains no analogous guidance. As of the writing
of this textbook, the IASB has undertaken a project that will analyze all the IFRS guidance that requires
a fair value measurement to ascertain whether the guidance intended those measurements to be exit values
(similar to the definition of fair value in U.S. GAAP). The IASB will also consider how IFRS should define
fair value and will create a single source of measurement guidance. The IASB plans to complete this project
in 2010. The IASB discusses the differences between fair value measurement in IFRS and U.S. GAAP in its
Discussion Paper, Fair Value Measurements, issued in November 2006 and available on the IASB’s Web site (iasb
.org.uk).
477
478
Chapter 10
Notes, Bonds, and Leases
rests on the assumption that the transaction would occur in the principal market for the asset
or liability or, in the absence of a principal market, in the most advantageous market from the
viewpoint of the reporting entity. Thus, a firm that normally obtains and repays long-term
debt in public capital markets would measure fair value based on the amount it would pay to
repay bonds in those markets. However, a firm that obtained long-term financing from both
public capital markets and private placements with insurance companies could choose the
market that would provide the most advantageous terms to settle the debt.
Measuring fair value also rests on the assumption that the market participants in the
principal (or most advantageous) market are independent of the reporting entity, knowledgeable about the asset or liability, and willing and able to engage in a transaction with the
reporting entity. Fair value must reflect assumptions that market participants, as opposed
to the reporting entity, would make about the best use of a financial asset or the best terms
for settling a financial liability. The best use for a financial asset might be to combine it with
other assets, as when an automobile manufacturer uses customer financing, which generates
receivables, to enhance sales of its automobiles. The best use for a financial asset might be as
a stand-alone asset, as when an investment bank purchases and sells automotive receivables
for profit.
Inputs to measuring fair value fall into three categories:
1. Level 1: Observable quoted market prices in active markets for identical assets or liabilities that the reporting entity is able to access at the measurement date.
2. Level 2: Observable inputs other than quoted market prices within Level 1. This category
might include quoted prices for similar assets or liabilities in active markets or quoted
market prices for identical assets or liability in markets that are not active. This category
also includes observable factors that would be of particular relevance in using present
values of cash flows to measure fair value, including interest rates, yield curves, foreign
exchange rates, credit risks, and default rates.
3. Level 3: Unobservable inputs reflecting the reporting entity’s own assumptions about the
assumptions market participants would use in pricing an asset or settling a liability.
Firms should use Level 1 inputs if available to measure fair value, then Level 2 inputs, and
finally Level 3 inputs.14
ILLUSTRATION OF FAIR VALUE OPTION
Refer to Example 2 in which Ford issues $250 million face value of 8% semiannual coupon
bonds. Assume as in the initial illustration that the market requires a yield of 8% compounded
semiannually. Thus, Ford issues the bonds on January 1, 2008, for the $250 million face value.
Interest expense for the first period is $10 million (ϭ .08 ϫ 1/2 ϫ $250 million). The entry to
record interest expense is the same as the one illustrated earlier:
June 30, 2008
Interest Expense . . . . . . . . . . . . . . . . . . . . . . . . . . . . . . . . . . . . . . . . .
Cash. . . . . . . . . . . . . . . . . . . . . . . . . . . . . . . . . . . . . . . . . . . . .
Assets
210,000,000
=
Liabilities
+
Shareholders’
Equity
(Class.)
210,000,000
IncSt S RE
10,000,000
10,000,000
To record interest expense of $10,000,000 (5 .04 3 $250,000,000) and the
required cash payment of $10,000,000. The carrying value of the bonds at the
end of the first period is $250 million (5 $250 million initial valuation 1 $10
million interest expense 2 $10 million cash payment).
Assume now that the market interest rate on these bonds at the end of the first period
increases to 9%. The market price of the bonds decreases to $227,212,930 as the following
computations show:
14For
a discussion of the difficulties firms encounter in measuring fair values using Level 2 and Level 3 inputs,
see Securities and Exchange Commission, “Report and Recommendations Pursuant to Section 133 of the
Emergency Economic Stabilization Act of 2008: Study on Mark-to-Market Accounting.”
Fair Value Option
Present Value of an Annuity of $10 million for 39 Periods at 4.5% per Period:
$10 million 3 18.22966 . . . . . . . . . . . . . . . . . . . . . . . . . . . . . . . . . . . . . . . . . . .
Present Value of $250 million for 39 Periods at 4.5% per Period:
$250 million 3 .17967 . . . . . . . . . . . . . . . . . . . . . . . . . . . . . . . . . . . . . . . . . . . .
Present Value (Market Value) at End of Period 1 . . . . . . . . . . . . . . . . . . . . . . . . . . . . .
$182,296,557
44,916,373
$227,212,930
For purposes of this illustration, assume that the market price of $227,212,930 is fair
value. If Ford had elected the fair value option for this bond at the time of issue, Ford would
now recognize an unrealized gain at the end of the first period of $22,787,070 (ϭ $250,000,000
Ϫ $227,212,930), equal to the change in fair value during the period. Ford’s entry to record
the unrealized gain is as follows:
June 30, 2008
Bonds Payable . . . . . . . . . . . . . . . . . . . . . . . . . . . . . . . . . . . . . . . . . . .
Unrealized Gain from Remeasurement of Bonds . . . . . . . . . . . . . . . .
Assets
=
Liabilities
+
222,787,070
Shareholders’
Equity
(Class.)
122,787,070
IncSt S RE
22,787,070
22,787,070
To remeasure bonds from a carrying value of $250,000,000 to a fair value of
$227,212,930 and recognize an unrealized gain of $22,787,070.
Ford would include the unrealized gain in net income for this first period.
Continuing this illustration, let’s consider the second period. Interest expense for the second period based on the current market yield at the beginning of the period of 9% compounded semiannually is $10,224,582 (ϭ .09 ϫ 1/2 ϫ $227,212,930). Following is the entry to
record interest expense and the cash payment:
December 31, 2008
Interest Expense . . . . . . . . . . . . . . . . . . . . . . . . . . . . . . . . . . . . . . . . .
Cash. . . . . . . . . . . . . . . . . . . . . . . . . . . . . . . . . . . . . . . . . . . . .
Bonds Payable . . . . . . . . . . . . . . . . . . . . . . . . . . . . . . . . . . . . . .
Assets
210,000,000
=
Liabilities
1224,582
+
Shareholders’
Equity
(Class.)
210,224,582
IncSt S RE
10,224,582
10,000,000
224,582
To record interest expense of $10,224,582 (5 .045 3 $227,212,930), the
required cash payment of $10,000,000, and an increase in bonds payable
for the difference. The carrying value of the bond at the end of the second
period before revaluation to fair value is $227,437,512 (5 $227,212,930 1
$10,224,582 2 $10,000,000).
Assume now that the yield required by the market on this bond decreases to 7% at the end
of the second six months. The fair value of this bond increases to $276,051,359, as the following computations show:
Present Value of an Annuity of $10 million for 38 Periods at
3.5% per Period: $10 million 3 20.84109 . . . . . . . . . . . . . . . . . . . . . . . . . . . . . . .
Present Value of $250 million for 38 Periods at 3.5% per Period:
$250 million 3 .27056 . . . . . . . . . . . . . . . . . . . . . . . . . . . . . . . . . . . . . . . . . . . .
Fair Value at End of Period 2 . . . . . . . . . . . . . . . . . . . . . . . . . . . . . . . . . . . . . . . . . .
$208,410,874
67,640,485
$276,051,359
Ford must now recognize an unrealized loss of $48,613,847, because the fair value of
these bonds of $276,051,359 exceeds their carrying value of $227,437,512. The entry is as
follows:
479
480
Chapter 10
Notes, Bonds, and Leases
December 31, 2008
Unrealized Loss from Remeasurement of Bonds . . . . . . . . . . . . . . . . . . . . .
Bonds Payable . . . . . . . . . . . . . . . . . . . . . . . . . . . . . . . . . . . . . .
Assets
=
Liabilities
+
148,613,847
Shareholders’
Equity
248,613,847
48,613,847
48,613,847
(Class.)
IncSt S RE
To remeasure bonds from a carrying value of $227,437,512 to a fair value of
$276,051,359 and recognize an unrealized loss of $48,613,847.
The total of interest expense and unrealized gains and losses for 2008 is as follows:
Period
1............
2............
Total . . . . . . . . . . .
Interest Expense
Unrealized Gain (Loss)
Total
($10,000,000)
(10,224,582)
($20,224,582)
$22,787,070
(48,613,847)
($25,826,777)
$12,787,070
(58,838,429)
($46,051,359)
The effect on net income before taxes of Ϫ$46,051,359 equals the cash payments for interest of $20,000,000 (ϭ $10,000,000 ϫ 2) plus the Ϫ$26,051,359 increase in fair value of the
debt from $250,000,000 at the beginning of the year to $276,051,359 at the end of the year.
An increase (decrease) in the fair value of a liability implies an unrealized loss (gain).
The FASB stated that it would not specify how firms applying the fair value option
should measure interest expense. An alternative to using the effective interest method illustrated above might be to set interest expense equal to the cash payments of $20,000,000. This
approach would result in $224,582 (ϭ $20,224,582 Ϫ $20,000,000) less interest expense, a
$224,582 smaller carrying value of the bonds at the end of the second period before remeasurement, and a $224,582 larger unrealized loss. Thus, the effect on net income before taxes is
the same regardless of the allocation between interest expense and net unrealized loss.
DISCLOSURES RELATED TO THE FAIR VALUE OPTION
Because the fair value option offers a free choice between measurement at fair value and
measurement at amortized cost, firms will likely report some financial instruments using historical market interest rates (amortized cost measurement) and some using fair values. The
disclosure requirements attempt to provide sufficient information to enable the user of the
financial statements to understand the effect of this mixture of accounting measurements.
A firm must identify the financial assets and financial liabilities on the balance sheet for
which it used the fair value option and disclose the reasons for choosing to measure those
items at fair value. If a line item on the balance sheet (for example, Bonds Payable) includes
items measured at amortized cost along with items measured at fair value, the firm must
disclose the amounts measured under both approaches. Finally, a firm must also disclose the
difference between the aggregate fair value and the aggregate unpaid principal amount on
long-term receivables and long-term payables.
With respect to the income statement, a firm must describe its method of computing interest
expense and the unrealized gain or loss on financial instruments measured at fair value and indicate the amount and line items on the income statement that include these items. The fair value
of a financial instrument can change because of changes in interest rates in general or because
of changes in instrument-specific credit risk. Firms must therefore estimate and disclose the proportion of the unrealized gain or loss due to changes in instrument-specific credit risk.
Notes to the financial statements must indicate whether the basis for measuring fair value
for each major category of asset or liability comes from Level 1, Level 2, or Level 3 inputs. If
firms rely on inputs from more than one of the three levels for a particular category of asset
or liability, then the firm classifies the asset or liability as coming from the lowest level for
which the input had a significant influence on the determination of fair value. For fair value
measurements using significant unobservable inputs (Level 3), firms must reconcile the beginning and ending balances of those fair value measurements with descriptions of the transactions or events that caused those fair value amounts to change during a period.
Fair Value Option
EXHIBIT 10.5
Fair Value Disclosures by PepsiCo
for the First Quarter of 2008
FAIR VALUE
In September 2006 the Financial Accounting Standards Board (FASB) issued Statement of Financial
Accounting Standards (SFAS) 157, Fair Value Measurements (SFAS 157), which defines fair value,
establishes a framework for measuring fair value, and expands disclosures about fair value measurements.
The provisions of SFAS 157 are effective as of the beginning of our 2008 fiscal year. We adopted SFAS 157
at the beginning of our 2008 fiscal year, and our adoption did not have a material impact on our financial
statements.
The fair value framework requires the categorization of assets and liabilities into three levels based upon
the assumptions (inputs) used to price the assets or liabilities. Level 1 provides the most reliable measure
of fair value, whereas Level 3 generally requires significant management judgment. The three levels are
defined as follows:
• Level 1: Unadjusted quoted prices in active markets for identical assets and liabilities.
• Level 2: Observable inputs other than those included in Level 1. For example, quoted prices for
similar assets or liabilities in active markets or quoted prices for identical assets or liabilities in
inactive markets.
• Level 3: Unobservable inputs reflecting management’s own assumptions about the inputs used in
pricing the asset or liability.
As of March 22, 2008, the fair values of our financial assets and liabilities are categorized as follows:
Total
Level 1
Level 2
Level 3
$181
71
46
6
78
63
$445
$181
71
—
—
—
—
$252
$ —
—
46
6
78
63
$193
$—
—
—
—
—
—
$—
$ 49
10
$ —
—
$ 49
10
$—
—
8
547
$614
—
182
$182
8
365
$432
—
—
$—
ASSETS
Short-term investments (a)
Available-for-sale securities (b)
Forward exchange contracts (c)
Commodity contracts (d)
Interest rate swaps (e)
Prepaid forward contracts (f)
Total assets at fair value
LIABILITIES
Forward exchange contracts (c)
Commodity contracts (d)
Cross currency interest rate
Swaps (g)
Deferred compensation (h)
Total liabilities at fair value
(a) Based on price changes in index funds.
(b) Based on the price of common stock.
(c) Based on observable market transactions of spot and forward rates.
(d) Based on average prices on futures exchanges and recently reported transactions in the marketplace.
(e) Based on the LIBOR index.
(f) Based on the price of our common stock.
(g) Based on observable local benchmarks for currency and interest rates.
(h) Based on the fair value of investments corresponding to employees’ investment elections.
Exhibit 10.5 presents fair value disclosures for PepsiCo for the first quarter of 2008. PepsiCo did not use Level 3 inputs so did not need to report a reconciliation between fair value
measurements at the beginning and end of the quarter based on Level 3 inputs.
As this book goes to press, it is unclear how widely firms will choose the fair value
option.
481
482
Chapter 10
Notes, Bonds, and Leases
ACCOUNTING FOR LEASES
An alternative to borrowing cash to purchase buildings, equipment, and certain other assets
is signing a contract to lease the property from its owner, called the lessor. Leases vary in their
characteristics but all convey to the lessee the right to use an asset. In some cases the lessor
enjoys the rewards and bears most of the risks of ownership, whereas in other cases the lessee, or user of the property, enjoys the rewards and bears most of these risks. U.S. GAAP and
IFRS provide for two methods of accounting for long-term leases: the operating lease method
and the capital or finance lease method.15 As subsequent sections discuss, the operating lease
method is appropriate when the lessor enjoys most of the rewards and bears most of the risks
of ownership. The leased property is an asset on the books of the lessor. The capital lease
method is appropriate when the lessee enjoys most of the rewards and bears most of the risks
of ownership. The lessee records both the leased asset and a lease liability, much the same as
if it had borrowed to purchase the asset. Capital leases are economically similar to purchasing
assets with funds obtained from issuing long-term bonds and result in similar accounting.
To understand these two methods, suppose that Food Barn wants to acquire a computer
that has a three-year life and a purchase price of $45,000. Assume that Food Barn must pay
8% per year to borrow funds for three years. The computer manufacturer will sell the computer to Food Barn for $45,000 or lease it for three years for $17,461.51 per year, payable at
the end of each year.16 In practice, lessees usually make payments in advance, but assuming
the payments occur at year-end simplifies the computations. Food Barn must pay for property taxes, maintenance, and repairs of the computer whether it purchases or leases. Food
Barn signs the lease on January 1, 2008.
OPERATING LEASE METHOD
In an operating lease, the owner, or lessor, enjoys the rewards and bears most of the risks of
ownership. For example, if a lease requires the lessee to make fixed periodic payments, the
lessor benefits from decreases in interest rates (the lessor receives the fixed periodic amount)
but bears the risk of interest rate increases (the lessor cannot increase the fixed periodic payment). If the lease specifies that the lessee must return the leased asset to the lessor at the end
of the lease term, the lessor must then re-lease or sell the asset. The lessor bears the risk of
technological change and other factors that would affect its ability to lease or sell the asset.
If the computer manufacturer, and not Food Barn, bears most of the risks of ownership,
accounting considers the lease to be an executory contract and treats it as an operating lease.
Food Barn would make no entry on January 1, 2008, when it signs the lease. It makes the following entry on December 31 of each year:
December 31 of Each Year
Rent Expense . . . . . . . . . . . . . . . . . . . . . . . . . . . . . . . . . . . . . . . . . . . .
Cash. . . . . . . . . . . . . . . . . . . . . . . . . . . . . . . . . . . . . . . . . . . . .
Assets
=
Liabilities
217,461.51
+
Shareholders’
Equity
(Class.)
217,461.51
IncSt S RE
17,461.51
17,461.51
To record annual expense of leasing computer under the operating lease
method.
CAPITAL LEASE METHOD
In a capital lease, the lessee enjoys the rewards and bears most of the risks of ownership. If
the periodic rental payments vary with changes in interest rates, then Food Barn, not the
15Financial
Accounting Standards Board, Statement of Financial Accounting Standards No. 13, “Accounting
for Leases,” 1975 (reissued and interpreted 1980) (Codification Topic 840); International Accounting Standards Board, International Accounting Standard 17, “Leases” 1982, revised 1997 and 2003. U.S. GAAP uses the
term capital lease method and IFRS uses the term finance lease method. We use the term capital lease method
throughout this section on leases.
16The present value of an annuity of $17,461.51 for three years at a discount rate of 8% is $45,000.
Accounting for Leases
computer manufacturer, bears interest rate risk. If the lease period approximately equals the
useful life of the leased asset, then Food Barn bears the risk of factors that affect the market
value of the asset. If Food Barn—not the computer manufacturer—bears most of the risks of
ownership, accounting views the arrangement as a form of borrowing to purchase the computer. Food Barn must account for it as a capital lease. This treatment recognizes the signing
of the lease as the simultaneous acquisition of a long-term asset and the incurring of a longterm liability for lease payments. At the time Food Barn signs the lease, it records both the
leased asset and the lease liability at the present value of the required cash payments, $45,000
in this example. The entry at the time Food Barn signs the three-year lease is as follows:
January 1, 2008
Leased Assets—Computer . . . . . . . . . . . . . . . . . . . . . . . . . . . . . . . . . . .
Lease Liability . . . . . . . . . . . . . . . . . . . . . . . . . . . . . . . . . . . . . .
Assets
=
Liabilities
145,000
+
Shareholders’
Equity
45,000
45,000
(Class.)
145,000
To record leased asset and lease liability under the capital lease method.
At the end of each year, Food Barn must account for the leased asset and the lease liability. To recognize depreciation expense on the leased asset, assuming Food Barn uses the
straight-line depreciation method and zero salvage value, Food Barn makes the following
entry at the end of each year:
December 31 of Each Year
Depreciation Expense (on Computer) . . . . . . . . . . . . . . . . . . . . . . . . . . . .
Accumulated Depreciation—Computer . . . . . . . . . . . . . . . . . . . . . .
Assets
=
Liabilities
+
215,000
Shareholders’
Equity
(Class.)
215,000
IncSt S RE
15,000
15,000
To record depreciation expense on leased asset under the capital lease
method.
The second entry made by Food Barn at the end of each year recognizes that the lease
payment both pays interest and reduces the lease liability. Separating the portion of the lease
payment that represents interest from the portion reducing the liability follows the effective interest method illustrated for notes and bonds earlier in this chapter. The amortization
schedule for this lease appears in Exhibit 10.6.
EXHIBIT 10.6
Amortization Schedule for $45,000 Lease Liability,
Accounted for as a Capital Lease, Repaid in Three
Annual Installments of $17,461.51 Each, Interest
Rate 8%, Compounded Annually
Period
(1)
Balance at
Beginning
of Period
(2)
Interest
Expense
for Period
(3)
Cash
Payment
(4)
Portion of
Payment Reducing
Principal
(5)
Balance
at End
of Period
(6)
1
2
3
$ 45,000.00
$ 31,138.49
$ 16,168.06
$ 3,600.00
$ 2,491.08
$ 1,293.45
$17,461.51
$17,461.51
$17,461.51
($13,861.51)
($14,970.43)
($16,168.06)
$ 31,138.49
$ 16,168.06
0
483
484
Chapter 10
Notes, Bonds, and Leases
The entries made for the debt service payments at the end of each year are as follows:
December 31, 2008
Interest Expense . . . . . . . . . . . . . . . . . . . . . . . . . . . . . . . . . . . . . . . . .
Lease Liability . . . . . . . . . . . . . . . . . . . . . . . . . . . . . . . . . . . . . . . . . . .
Cash. . . . . . . . . . . . . . . . . . . . . . . . . . . . . . . . . . . . . . . . . . . . .
Assets
=
217,461.51
Liabilities
+
213,861.51
Shareholders’
Equity
(Class.)
23,600.00
IncSt S RE
3,600.00
13,861.51
17,461.51
To recognize lease payment, interest on the lease liability for the first year
of $3,600.00 (5 .08 3 $45,000), and the plug for the reduction in the liability. The present value of the lease liability after this entry is $31,138.49
(5 $45,000 2 $13,861.51).
December 31, 2009
Interest Expense . . . . . . . . . . . . . . . . . . . . . . . . . . . . . . . . . . . . . . . . .
Lease Liability . . . . . . . . . . . . . . . . . . . . . . . . . . . . . . . . . . . . . . . . . . .
Cash. . . . . . . . . . . . . . . . . . . . . . . . . . . . . . . . . . . . . . . . . . . . .
Assets
=
217,461.51
Liabilities
+
214,970.43
Shareholders’
Equity
(Class.)
22,491.08
IncSt S RE
2,491.08
14,970.43
17,461.51
To recognize lease payment, interest on the lease liability for the second year
of $2,491.08 (5 .08 3 $31,138.49), and the plug for the reduction in the
liability. The present value of the lease liability after this entry is $16,168.06
(5 $31,138.49 2 $14,970.43).
December 31, 2010
Interest Expense . . . . . . . . . . . . . . . . . . . . . . . . . . . . . . . . . . . . . . . . .
Lease Liability . . . . . . . . . . . . . . . . . . . . . . . . . . . . . . . . . . . . . . . . . . .
Cash. . . . . . . . . . . . . . . . . . . . . . . . . . . . . . . . . . . . . . . . . . . . .
Assets
217,461.51
=
Liabilities
216,168.06
+
Shareholders’
Equity
(Class.)
21,293.45
IncSt S RE
1,293.45
16,168.06
17,461.51
To recognize lease payment, interest on the lease liability for the third year
of $1,293.45, which differs slightly due to rounding from $1,293.44 (5 .08 3
$16,168.06), and the plug for the reduction in the liability. The present value
of the lease liability after this entry is zero (5 $16,168.06 2 $16,168.06).
EFFECT OF THE OPERATING AND CAPITAL LEASE METHODS
ON THE FINANCIAL STATEMENTS OF THE LESSEE
Both the leased asset and the lease liability appear on the lessee’s balance sheet under the
capital lease method, whereas neither appears on the lessee’s balance sheet under the operating lease method.
Exhibit 10.7 summarizes the nature and amount of expenses under the operating and capital lease methods. The total rent expense under the operating lease method equals $52,384.53
(ϭ $17,461.51 ϫ 3). Total depreciation expense of $45,000 (ϭ $15,000 ϫ 3) plus total interest
expense of $7,384.53 (ϭ $3,600.00 ϩ $2,491.08 ϩ $1,293.45) also equals $52,384.53. Total
expenses under the operating lease method and the capital lease method are the same and
equal the total cash expenditures. The operating lease method and the capital lease method
differ in the timing, but not in the total amount, of expense. For the lessee, the capital lease
method recognizes expenses earlier than the operating lease method.
The operating lease method classifies all of the lease payment each period as an operating
use of cash on the statement of cash flows. The capital lease method classifies the portion
of the lease payment related to interest expense as an operating use of cash and the portion
Accounting for Leases
EXHIBIT 10.7
Comparison of Expense Recognized Under Operating
and Capital Lease Methods for Lessee
Expense Recognized Each Year Under:
Year
1
2
3
Total
Operating Lease Method
$17,461.51
17,461.51
17,461.51
$52,384.53
Capital Lease Method
$18,600.00
17,491.08
16,293.45
$52,384.53
(5 $15,000 1 $3,600.00)
(5 15,000 1 2,491.08
(5 15,000 1 1,293.45)
(5 $45,000 1 $7,384.53)
related to a reduction in the lease liability as a financing use of cash. In addition, the lessee
adds depreciation expense to net income or net loss to compute cash flow from operations.
CHOOSING THE ACCOUNTING METHOD FOR LEASES
The capital lease method results in larger long-term debt and debt-equity ratios during the
life of a lease than the operating lease method. A larger debt ratio makes a firm appear more
risky. Thus, given a choice, lessees tend to prefer the operating lease method to the capital
lease method. The operating lease method also recognizes expense more slowly over the life
of the lease than the capital lease method. These financial statement effects often lead lessees
to structure leases so that they take the form of an operating lease.
Meanwhile, standard-setting bodies have tried to specify rules precluding the use of the
operating lease method when leases transfer the rewards and risks of ownership from the lessor to the lessee.
U.S. GAAP Criteria for Lease Accounting U.S. GAAP specifies criteria for a capital lease. If a particular lease meets any one of the following four conditions, the lessor and
lessee account for the lease as a capital lease. If the lease meets none of the four conditions,
firms treat the lease as an operating lease.
1. The lease transfers ownership of the leased asset to the lessee at the end of the lease
term.
2. Transfer of ownership at the end of the lease term seems likely because the lessee has a
bargain purchase option. A bargain purchase option gives the lessee the right to purchase
the leased asset at a specified future time for a price less than the currently predicted fair
value of the property at that future time.
3. The lease extends for at least 75% of the asset’s expected useful life.
4. The present value of the contractual minimum lease payments equals or exceeds 90% of
the fair value of the asset at the time the lessee signs the lease. The present value computation uses a discount rate appropriate for the creditworthiness of the lessee.
These criteria attempt to identify who enjoys the benefits and bears the economic risks of
the leased property. If the leased asset, either automatically or for a bargain price, becomes
the property of the lessee at the end of the lease period, then the lessee enjoys all of the economic benefits of the asset and incurs all risks of ownership. If the life of the lease extends
for most of the expected useful life of the asset (U.S. GAAP specifies 75% or more), then the
lessee enjoys most of the benefits, particularly when we measure them in present values, and
incurs most of the risk of technological obsolescence.
Lessors and lessees can usually structure leasing contracts to avoid the first three conditions. Avoiding the fourth condition is more difficult because it requires the lessor to bear
more risk than it might desire. The fourth condition compares the present value of the lessee’s
contractual minimum lease payments with the fair value of the leased asset at the time the
lessee signs the lease. The lessor presumably could either sell the asset for its fair value or lease
it to the lessee for a set of lease payments. The present value of the minimum lease payments
485