Regional determinants of FDI location in Vietnam
Bạn đang xem bản rút gọn của tài liệu. Xem và tải ngay bản đầy đủ của tài liệu tại đây (374.59 KB, 19 trang )
Journal of Economics and Development, Vol.18, No.1, April 2016, pp. 19-37
ISSN 1859 0020
Regional Determinants of FDI Location
in Vietnam
Nguyen Thi Ngoc Anh
University of Warsaw, Poland
Email:
Abstract
This paper examines empirically determinants of foreign direct investment (FDI) location in
Vietnam. Based on a panel dataset of 63 provinces and cities in Vietnam from 2008 to 2012,
linear regression models for panel data (fixed-effects and random-effects) and negative binomial
models are applied in analysis. The empirical evidence confirms the significant impact of market
potential, labour cost, labour quality, infrastructure, provincial policy effectiveness, and the
previous year’s FDI concentration on FDI allocation between provinces and cities in Vietnam.
Also, market potential and wage rate are statistically shown to affect the size of FDI projects.
Moreover, estimation results suggest that provinces with higher FDI accumulation seem to create
a dispersion force to new foreign investors and FDI between regions in Vietnam in the form of
efficiency-seeking FDI.
Keywords: Foreign direct investment (FDI); market potential; regional determinants.
Journal of Economics and Development
19
Vol. 18, No.1, April 2016
1. Introduction
cational factors that have impact on FDI inflow
is essential to amend this situation.
After the reform policy called Doi Moi in
1986, Vietnam has shifted from a highly centralized planned economy to a socialist-oriented market economy. During the transformation
process, foreign direct investment (FDI) by
multinational corporations has played a very
important role since it has brought a variety of
benefits to the host nation such as capital, finished products, components, new technology,
organizational and managerial skills, distribution channels and markets.
The main purpose of this paper is to study
determinants of FDI location in Vietnam at the
provincial level after the country joined the
World Trade Organization (WTO) in 2007.
The next section presents a literature review
and describes main contributions of the paper.
The third section explains the analytical framework and proposes research hypotheses. Data
description is presented in the fourth section.
The fifth section describes the methodology,
followed by the sixth section with empirical
results and discussion. The conclusion and
policy implications are finally presented in the
seventh section.
In recent years, Vietnam has emerged as
one of the most attractive locations for FDI in
Southeast Asia. Nevertheless, recognizing that
FDI can contribute actively to the economic
development of a country, the world market for
FDI is indeed highly competitive, especially
among developing countries. Vietnam used to
be in the top 15 most attractive FDI destinations in the world from 2010 to 2012, according
to the FDI Confidence Index of A.T.Kearney1.
However, in 2014, Vietnam is no longer in the
top 25, which implies that Vietnam’s competitiveness in the FDI market has been eroded
noticeably. The facts have shown that liberal
policy frameworks are becoming commonplace and are losing their traditional power to
attract FDI. Therefore, the Vietnamese government needs to pay more attention to locational
advantages and created assets of the country in
order to improve its attractiveness among FDI
destinations. Moreover, FDI distribution in
Vietnam is highly uneven, accruing to developed regions such as Hanoi in the North and
Ho Chi Minh City in the South. This leads to
very wide development gaps between regions
in Vietnam. Needless to say, investigating loJournal of Economics and Development
2. Literature review
Determinants of FDI location have been
extensively investigated in the literature, both
in developed and in developing countries. For
instance, Head et al. (1995), Friedman et al.
(1992, 1996), O’Huallachain and Reid (1997)
analyzed geographical distribution of FDI in
the US. Artige and Nicolini (2006) studied locational determinants of FDI in three European
regions. Chidlow and Young (2008), Cieslik
(2005, 2013) examined FDI location in Poland. Head and Ries (1996), Cheng and Kwan
(2000), and Ali and Guo (2005) researched the
case of China. Those studies focused on factors
affecting FDI distribution at country, sectorial,
or regional levels. In Vietnam, the increasing
influx of foreign capital, which followed Vietnam’s policy reforms, has generated empirical
studies on the allocation of FDI. The problem
of location decisions of foreign firms in Vietnam has been analyzed mostly at the regional
level by a number of empirical methodologies.
20
Vol. 18, No.1, April 2016
follow-up study (Anwar and Nguyen, 2010).
The main difference between these two studies
was the fact that instead of cross-sectional data,
Anwar and Nguyen (2010) used a panel data
of 61 provinces in Vietnam for 1996-2005 to
conduct their research. Their findings were in
line with the former study.
Pham (2002) studied the location determinants of foreign firms in Vietnam during the
1988-1998 period, using linear regression on
cross-sectional data for 53 provinces. She found
that the provincial FDI inflows were positively
related to the telecommunication network, the
number of middle secondary school pupils, and
to personal income.
Hoang and Goujon (2014) estimated spatial
econometric models to find the determinants
of FDI location among Vietnamese provinces
after the Asian crisis in 1997. Their empirical
study was based on cross-sectional data from
2001 to 2010. The paper revealed that FDI was
attracted by market size and infrastructure in
the host and neighboring provinces. Provincial
industrial development policy and labour productivity were also drivers of FDI inflows into
provinces. This paper was the first study taking
into consideration characteristics of neighboring provinces.
The roles of geographical characteristics
of the regions were further researched in the
study of Meyer and Nguyen (2005). They estimated a binomial regression model to show
the important role of population, infrastructure,
industrial zones, education, FDI stock and economic growth in attracting FDI to provinces
in Vietnam. Particularly, the main finding was
that foreign investors chose to locate in provinces where market transactions were supported. Employing the same method but with
more up-to-date cross-sectional data, Nguyen
and Nguyen (2007) concluded that improved
human capital, higher wages, a better infrastructure system, and a larger market size had a
positive impact on FDI allocation. Nguyen and
Nguyen (2007) also ran a number of regression
models to distinguish determinants of FDI inflows by different countries of FDI origin.
Briefly, the four main groups of factors analyzed in the previous studies were market size,
labour, infrastructure, and government policy.
Nevertheless, most empirical studies on FDI
location in Vietnam did not explicitly analyze
the impact of agglomeration force so-called
market potential, which is the economic size
of the region and closeness to other markets.
This paper aims to fill this gap. Additionally,
I will attempt to show the significant effect of
previous years’ FDI concentration on current
year’s FDI. Furthermore, this study not only
evaluates the important role of these agglomeration forces in FDI distribution in Vietnam
but also attempts to examine their influence
on the size of FDI projects. Besides, there are
very few studies on FDI location in Vietnam
employing panel data. This is mainly due to
Nguyen (2006) applied a simultaneous equation model under GMM estimation to test the
mutual relationship between FDI and economic
growth. Cross-sectional data in 2000 was used
to demonstrate that economic growth, domestic investment, market size, infrastructure, exports, real exchange rate, and labour quality
were all positively related to the concentration
of FDI. Meanwhile, labour cost had a negative
impact on FDI flows. The roles of those factors
in FDI distribution were confirmed again in her
Journal of Economics and Development
21
Vol. 18, No.1, April 2016
cern in the host country in terms of production
cost. In this paper, I also expect that provinces
with a lower wage rate will attract FDI more
than the others.
the previous unavailability of data. Based on
a panel dataset obtained from Statistical Yearbooks of Vietnam, this paper takes into account
the dynamics of FDI inflows and the economic development of the country in recent years.
Panel data analysis offers numerous advantages in empirical research. It controls for individual heterogeneity, gives more informative
data, more variability, less collinearity among
variables, more degrees of freedom and more
efficiency (Baltagi, 2005). This study provides
more recent evidence on the locational determinants of FDI in Vietnam and contributes to
the literature on the subject after the country’s
accession to the WTO in 2007.
Beside labour cost, labour quality and labour availability are very important factors
impacting location choice of foreign investors.
Foreign firms invest in Vietnam mainly in labour-intensive activities such as clothes and
footwear (Jenkins, 2006). Thus, the quality and
availability of a labour force might be positively related to provincial FDI inflows.
Another important determinant of FDI location that the theoretical model considers is
government policy. The theoretical model predicts that local incentive policies such as tax
incentives are positively related to the number
of foreign firms. Local authorities can maintain the economic and political stability, create
a friendly business environment for investors,
and impose effective policies to develop infrastructure and human capital, etc. Thus, provincial policy effectiveness may have a positive
impact on FDI inflows.
3. Analytical framework and research hypotheses
As mentioned before, the FDI distribution
in Vietnam is significantly uneven. To investigate the uneven spatial location of FDI, we
may refer to the theoretical model of agglomeration economies proposed by Head and Ries
(1996), Cieslik (2013). This analytical framework combines the firm heterogeneity and the
new economic geography literatures. The model confirms the significant effects of agglomeration forces including infrastructure, government incentive policies and labour market (labour cost and labour quality) on foreign firms’
location choice.
In the theoretical model, Head and Ries
(1996) revealed that infrastructure is one of
the factors determining the location of foreign-funded investments. This paper also expects to see a similar outcome of infrastructure.
The major concern in Head and Ries’ model
is the importance of agglomeration economies,
which simply means foreign firms will prefer
cities where other foreign firms are located.
Similarly, I expect to see the positive relationship between new FDI and cumulative FDI until the end of the previous year in this study.
First, the theoretical model predicts that high
factor costs make the region unattractive to foreign investors. Obviously, capital and labour
are the most important factors of production. It
is often the case that FDI firms bring the capital from their home country and do not have
to rely on the local capital markets (Cieslik,
2013). Thus, labour cost becomes a major conJournal of Economics and Development
As summarized before, four main groups of
factors analyzed in the previous studies on FDI
22
Vol. 18, No.1, April 2016
tial introduced by Harris (1954). According to
Harris (1954), market potential is the demand
for products in a location. It is the sum of purchasing power in other locations, weighted by
transport costs (distances). In this study, I expect to reveal that provinces with easier access
to other provinces attract more foreign investors. Furthermore, as FDI plays a critical role
in export (Ekholm et al., 2004), provinces that
have an infrastructure system and geographical
location supporting export may be more attractive than others.
location in Vietnam are market, labour, infrastructure and government policy. The factor
which was neglected in the model of Head and
Ries is market. However, when econometrically proving the important role of infrastructure in their theoretical model, Head and Ries
(1996) stated that a city is more attractive if it is
easier to transport goods produced there to other markets. This, in fact, not only depends on
the infrastructure system but also on the geographical position of that location. The regions’
centrality or periphery is expected to influence
firms’ location decisions – all else being equal,
firms are likely to locate where they find least
costly access to markets for their inputs and
outputs (Midelfart-Knarvik et al., 2000). An
ideal candidate to demonstrate the ease of a region to access other markets is market poten-
4. Data description
4.1. FDI in Vietnam between 2008 and
2013
FDI has been contributing actively to the development of Vietnam since it was first allowed
into Vietnam in 1988. The Vietnamese econo-
Figure 1: FDI inflows to Vietnam, 2008-2013
(Projects)
(Mill.USD)
250000
194572.2
200000
150000
199078.9
210521.6
234121
16000
14000
172131.9
12000
149420.6
10000
8000
100000
6000
64011
4000
50000
0
18000
2008
23107.3
19886.1
15598.1
2009
2010
2011
16348
2012
Cumulative FDI capital
New FDI capital
Cumulative FDI projects
New FDI projects
22352.2
2013
2000
0
Source: Statistical Yearbooks of Vietnam, 2008-2013 and author’s calculations.
Journal of Economics and Development
23
Vol. 18, No.1, April 2016
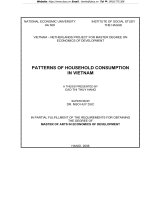
Figure 2: Number of FDI projects having effect as of 31st Dec 2013
137
838
442
Southeast
972
(6%)
Red River Delta
North Central Coast & South Central Coast
4531 (28%)
8962 (56%)
Mekong River Delta
Northwest & Northeast
Central Highlands
Source: GSO (2013) and author’s calculation
of FDI across provinces and cities in Vietnam
is significantly uneven (See Figure 2 and 3).
Specifically, the Southeast region accounted
for 56% of FDI projects and 44% of the total
FDI capital having effect as of 31st December
2013. Meanwhile, 28% of projects and 24%
of FDI capital were located in the Red River
Delta. Moreover, Hanoi in the North and Ho
Chi Minh in the South accounted for 10% and
15%, respectively of FDI capital in 2013 (GSO,
2013). The Central Highlands is the least attractive region for FDI within the country.
my has experienced a rapid growth with gross
domestic product (GDP) growth of more than
7% at the beginning of the 21st century and of
more than 5% after the global financial crisis,
2008. According to the Government Statistical
Office of Vietnam (GSO, 2013), in 1991, there
were only 152 FDI projects with 1284.4 million USD of total registered capital and 428.5
million USD of implementation capital. These
numbers increased to 1530 projects, 22352.2
million USD, and 11500 million USD, respectively in 2013. However, after the financial crisis in 2008, FDI inflows to Vietnam decreased
dramatically in both the number of new projects and the total amount of new capital. This
is indicated in Figure 1 even though cumulative
numbers were still on an upward trend.
The top three sources of FDI flowing into
Vietnam are Japan, Singapore, and South Korea in 2013. In addition, manufacturing and
processing captured nearly 60% of the total
FDI, followed by real-estate business with
around 20% (Bui et al., 2014).
Statistics have shown that the distribution
Journal of Economics and Development
24
Vol. 18, No.1, April 2016
Figure 3: Total FDI capital as of 31st December 2013 (Mill.USD)
7856.5
11136.5
785.9
Southeast
Red River Delta
52482.2
(22%)
102973.5
(44%)
North Central Coast & South Central Coast
Mekong River Delta
Northwest & Northeast
Central Highlands
56117.7
(24%)
Source: GSO (2013) and author’s calculation
4.2. Data description
FDI projects. Cumulative projects are all projects having effect as of 31st December each
year. Two variables measuring the size of FDI
projects are the average size of cumulative FDI
projects and the average size of new FDI projects. In addition, all data on FDI flows is registered or committed FDI, not implemented FDI
since the GSO only publishes provincial registered FDI in their annual Statistical Yearbook.
Most earlier studies also relied on registered
FDI even though implemented FDI can reflect
real FDI inflows to Vietnam more accurately.
This study focuses on the situation after
Vietnam’s accession to the WTO, from 2008
to 2012. I desired to collect data on a longer
period; however, the problem was that in 2008
Ha Tay province was merged into Hanoi. Thus,
statistics before 2008 reported data for Ha Tay
and Hanoi separately. Data are collected on a
two-year basis, 2008, 2010, and 2012 because
some key variables like wage rates by provinces are reported only every two years. The
dataset contains 63 groups which represent 63
provinces and cities in Vietnam.
Regarding the currency unit of variables,
data on FDI inflows is denominated in US
dollars (USD) while other variables such as
monthly wage and GDP are in Vietnam Dong
(VND). In order to eliminate the effect of
changes in the exchange rate between USD
and VND over time, in the regression process,
There are six dependent variables in which
four variables demonstrate provincial FDI inflows and two variables reflect the size of FDI
projects. The first four variables are cumulative
FDI capital, new FDI capital, the cumulative
number of FDI projects, and the number of new
Journal of Economics and Development
25
Vol. 18, No.1, April 2016
GDPj: GDP of province j (j≠i)
I convert all data on FDI inflows from USD to
VND currency. I use the yearly average exchange rate from World Bank statistics2. The
exchange rates, USD/VND, in 2008, 2010, and
2012 were 16302.25, 18612.92, and 20828, respectively.
Dij: distance from province j to province i.
Distances between provinces are collected
from Google Maps. I choose the fastest way by
car between two provinces suggested by Google Maps, excluding ways that cross Vietnam’s
neighboring countries such as Laos or Cambodia. The number of pairwise distances between
63 provinces and cities are 1953 distances.
In order to test my aforementioned predictions based on the theoretical framework of
Head and Ries (1996), there are nine explanatory variables in the empirical analysis: external market potential, internal market potential,
wage rates, the number of high school students,
the PCI index, road density, the number of harbours, cumulative FDI capital till the end of the
previous year, and cumulative FDI projects till
the end of the previous year.
Additionally, a province also possesses
its own market potential from the purchasing
power of the province itself. Here, I call it internal market potential, which is the purchasing
power of that province divided by its internal
distance.
GDPi
MPii =
(2)
Dii
MPii: internal market potential of province i
Market potential
The most popular proxies for market potential used in previous studies in Vietnam are
GDP and GDP per capita. Unfortunately, GDP
and GDP per capita themselves cannot fully
measure the region’s economic centrality or
periphery in comparison to other adjacent regions. Therefore, I am going to employ market
potential as proposed by Harris (1954), which
is the sum of purchasing power in other locations, weighted by transport costs (distances).
Market potential in this research is divided into
two categories, namely external market potential and internal market potential.
GDPi: GDP of province i
Dii: internal distance of province i. The measurement of internal distances is based on Mayer and Head (2000).
Dii = 2/3 A/π
A: Area of province i
Labour
There are two variables representing labour
factors. Monthly wage rate demonstrates labour cost while the number of high school students indicates both labour supply and labour
quality in each province.
The external market potential of each province is the distance-weighted sum of purchasing
power of all the other provinces with purchasing power measured by GDP of each province.
Policy
In order to capture the attractiveness to FDI
in terms of policy, I employ the Provincial
Competitiveness Index (PCI). PCI was first introduced in 2005 by the Vietnam Chamber of
Commerce (VCCI) and the U.S Agency for International Development (USAID). This index
GDPj
(1)
MPie =∑
Dij
MPie: external market potential of province i
Journal of Economics and Development
(3)
26
Vol. 18, No.1, April 2016
Max
674.89
159.77
4337
436
21500.22
128.45
14.66
61.69
2205
22.43
72.18
24.79
42.00
666.90
3967
Min
In previous research papers, several different proxies for infrastructure like electricity
system, number of telephone per inhabitants
and so on were used. However, my dataset is in
panel form and thus I could not gather data for
those proxies in every single year in my period
of analysis. As a result, I use a different proxy
for infrastructure. Specifically, I calculate the
volume of freight by road in each province divided by the province’s area to get the density
of traffic per square kilometer as a proxy for infrastructure. Road density can be regarded as a
measure of the quality of infrastructure because
it demonstrates the transport capacity of the
infrastructure system in each province. Moreover, travelling by road is the most important
means of transportation in Vietnam.
0.0016
0
1
0
1.63
1.63
1.19
0.15
105
0.58
36.39
0.04
0
0.001
1
55.58
11.44
196.13
25.09
727.07
3304.68
4.84
3.75
499.49
4.45
56.16
3.33
3.62
48.59
188.14
Mean
Infrastructure
1
2
3
4
5
6
7
8
9
10
11
12
13
14
15
Source: Author’s calculations
Cumulative FDI capital (Trill.Vnd)
New FDI capital (Trill.Vnd)
Cumulative FDI projects (count)
New FDI projects (count)
Average size of cumulative FDI projects (Bill.Vnd)
Average size of new FDI projects (Bill.Vnd)
External market potential (Trill.Vnd)
Internal market potential (Trill.Vnd)
Wage rate (Thous.Vnd/month)
High school students (10000 persons)
PCI index (1-100)
Road density (ton/km2)
Number of harbours
Cumulative FDI capital till last year(Trill.Vnd)
Cumulative FDI projects till last year (count)
cfdi
nfdi
cproject
nproject
csize
nsize
emp
imp
wage
hs
pci
road
harbour
cfdi1
cproject1
Number of
observations
188
153
188
147
188
146
189
189
189
189
189
189
189
189
189
Abbreviation
No
Variable
Table 1: Variables used in regression
Standard
deviation
113.58
27.31
582.92
66.84
1941.68
14533.26
2.73
6.69
334.64
3.68
6.15
5.21
8.63
109.31
548.24
is constructed by assessing the ease of doing
business, economic governance, and administrative reform efforts by the local governments
of the 63 provinces and cities in Vietnam. The
index ranges from 0 to 100 with higher scores
implying a better business environment offered
by the local authority. Thus, the PCI can be a
good tool to evaluate regional governments’
policies in attracting FDI.
Journal of Economics and Development
27
As I mentioned earlier, provinces that have
an infrastructure system and geographical location supporting export may attract more FDI.
Thus, I use the number of maritime harbours
in each province as an additional explanatory
variable. This variable does not only reflect the
infrastructure system of provinces but also implies their advantage in geographical location
supporting export, i.e. adjacent to the sea.
Agglomeration force
In order to test if foreign investors are in faVol. 18, No.1, April 2016
1
cproject1
1
0.82
cfdi1
1
0.42
0.54
0.63
In terms of data source, the PCI index is obtained from its official website3. The number
of maritime harbours in each province is from
a report of the Ministry of Transport of Vietnam4. Other variables are captured from Vietnam’s Statistical Yearbooks published annually by the General Statistics Office of Vietnam
(GSO).
1
0.39
0.29
0.66
0.51
0.69
0.67
1
0.72
0.70
0.14
0.72
0.50
0.76
0.89
1
-0.05
0.54
0.34
0.60
0.64
1
0.14
0.08
0.17
0.17
1
0.56
0.46
harbour
road
pci
hs
wage
imp
1
-0.22
-0.09
-0.18
0.01
-0.25
-0.11
0.03
-0.06
-0.07
1
0.28
0.50
0.03
0.23
0.35
0.03
0.21
0.19
Descriptive statistics of variables and their
correlation matrix are presented in Table 1
and Table 2, respectively. According to Singh
(2003), a high correlation is within [-1; -0.7]
or [0.7; 1]. Thus, from the correlation matrix
in Table 2, high correlations are seen between
imp and several variables (wage, hs, pci, cfdi1,
and cproject1). In the methodology section, I
will explain why these high correlations do not
affect my final results and conclusions.
Journal of Economics and Development
5. Methodology
Source: Author’s calculations
1
-0.12
-0.07
0.14
0.91
0.59
0.73
0.14
0.65
0.43
0.76
0.94
cfdi
nfdi
cproject
nproject
csize
nsize
emp
imp
wage
hs
pci
road
harbour
cfdi1
cproject1
1
0.48
0.81
0.76
0.21
0.10
0.18
0.73
0.67
0.61
0.13
0.52
0.59
0.97
0.81
1
0.32
0.33
0.49
0.70
-0.12
0.23
0.09
0.32
-0.09
0.14
0.35
0.29
0.31
1
0.95
-0.12
-0.07
0.19
0.90
0.66
0.65
0.17
0.64
0.44
0.81
1.00
1
0.68
-0.24
-0.13
-0.14
0.04
-0.19
-0.17
0.02
0.10
-0.12
emp
nsize
csize
nproject
cproject
cfdi
nfdi
Table 2: Correlation matrix
vor of provinces where other foreign firms are
located, I use two regressors: cumulative FDI
capital till the end of the previous year, and the
cumulative number of FDI projects till the end
of the previous year. The cumulative FDI capital of the previous year will be used in equations for new FDI capital of the current year
while cumulative FDI projects of the previous
year will be employed in equations for new
FDI projects of the current year.
28
The model of analysis is as follows:
FDIit = β0 + β1 Xit + εit
FDIit are provincial FDI of province i at time
t. The six dependent variables are: cumulative
FDI capital, new FDI capital, cumulative FDI
projects, new FDI projects, average size of cumulative FDI projects, and average size of new
FDI projects.
Vol. 18, No.1, April 2016
Xit is the vector of nine regressors of province i at time t.
is that:
E [yi | xi] = var [yi | xi] = λi
εit is the error term.
This assumption is regarded as a major
limitation of the Possion model as count data
often exhibit overdispersion with the conditional variance larger than the mean. To solve
this problem, the most popular alternative is
the negative binomial model of Cameron and
Trivedi (1986). This is a generalized version
of the Possion model. The negative binomial
model introduces an individual unobserved effect εi into the conditional mean:
For the dependent variables related to capital, including cumulative FDI capital, new FDI
capital, average size of cumulative FDI projects, and average size of new FDI projects, I
simply run linear regression models for panel
data.
For numbers of FDI projects (cumulative
and new projects), which are count variables,
there are two models usually employed, namely the Possion model and the negative binomial
model. These models have been widely applied
to study the regional determinants of foreign
firms in developed as well as in developing and
transition economies. The following are main
aspects of the Possion model and the negative
binominal model, derived from the summary of
Cieslik (2013).
lnλi = β’xi + εi
The expected value of yi in the negative binominal model is exactly the same as in the
Poisson model, however the variance exceeds
the mean:
var [yi | xi] = E [yi | xi] {1+ αE [yi | xi]}
(9)
The negative binominal model reduces to
the simple Possion model when the estimated
parameter α is not statistically different from
zero.
e λ i λ yi
, yi = 0, 1, 2,…, N (5)
Pr(yi | xi) =
yi !
In this study, the negative binominal model is employed. Although the Possion model
can be applied, it may suffer from the aforementioned overdispersion problem. Meyer and
Nguyen (2005) tested and detected this problem in their research on FDI location in Vietnam, and thus they also turned to negative binomial regression.
The first assumption is that λi is log-linearly
dependent on the vector of explanatory variables xi which represents regional characteristics:
(6)
and β is a vector of coefficients on independent variables that needs to be estimated.
The Hausman test is conducted to choose
between random-effects (RE) and fixed-effects
(FE) in all regression equations. However, it is
They key assumption of the Possion model
Journal of Economics and Development
(8)
where εi can be interpreted as either a specification error or some cross-sectional heterogeneity with exp (εi) having a gamma distribution
with unit mean and variant α.
In the Possion model, the number of projects
yi in i region is drawn from a Possion distribution with the parameter λi related to the vector
of regressors xi. Thus, the probability of observing a count of projects yi is:
lnλi = β’xi
(7)
29
Vol. 18, No.1, April 2016
there are more missing data on new FDI than
on cumulative FDI.
important to note that among nine regressors,
there is a one time-invariant variable during the
period of analysis, i.e. the number of maritime
harbours in each province. If I include this variable at the beginning, a fixed-effects models
cannot be employed in any equation as fixed-effects estimation does not allow time-invariant
variables. Therefore, the steps of regression in
my research are as follows. At the beginning,
the number of harbours is not included in all
equations. Then, if the Hausman test shows
that RE estimators are consistent and effective
in comparison to FE estimators, I will include
this variable in RE estimation. In contrast, if
Hausman test results prefer FE estimators, this
variable will not be taken into account in that
equation.
At first glance, it is noticeable that equation V on the average size of cumulative FDI
projects is not statistically significant because
P-value for regression as a whole (Pro>ch2) in
this model is 0.6232 (>10%). This means we
cannot reject the null hypothesis stating that all
coefficients of regressors are together equal to
zero. In other words, seven independent variables in this equation are jointly statistically insignificant. Consequently, I skip the results of
equation V in the discussion. Other models are
statistically significant because their P-values
for regression as a whole are all equal to zero.
A number of factors are identified as important
determinants of FDI location and the size of
new FDI projects.
Furthermore, in order to check whether high
correlations between several variables (see
Table 2) significantly affect the final results, I
have run equations without imp variable. Fortunately, the signs and significance level of other
variables almost did not change.
Market potential
As we can see from Table 3, external market
potential statistically has a positive impact on
both new FDI capital and number of FDI projects at a high significance level. Provinces and
cities with higher external market potential attract more FDI projects and FDI capital. Moreover, those provinces also attract bigger FDI
projects as we can see from equation VI: external market potential is positively related to the
size of new FDI projects at a 5% significance
level. Therefore, new and big foreign investors
are in favour of provinces with higher external
market potential or in other words with easier
access to other large markets. This may help to
save transportation costs for firms.
6. Estimation results and discussion
Table 3 presents estimation results for the
determinants of FDI distribution across provinces in Vietnam. With 63 provinces in 3 years,
the highest number of observations for each
equation would be 189. However, data on FDI
were missed in some years in several remote
provinces such as Cao Bang, Bac Can, Dien
Bien, Kon Tum, and Lai Chau. Consequently, the numbers of observations of FDI-related variables are all lower than 189, which is
shown both in Table 1 and Table 3. Also, regression results of new FDI projects and of
new FDI capital end up with a lower number of
observations and a lower number of groups as
Journal of Economics and Development
Interestingly, internal market potential has a
positive effect on accumulation of FDI capital
(1% significance level) but the opposite is seen
on the number of new projects (also at a 1%
30
Vol. 18, No.1, April 2016
impact on new FDI in terms of both total capital and the size of projects.
significance level). Thus, provinces with higher internal market potential have a larger total
amount of cumulative FDI capital but they do
not attract new foreign investors.
The negative relationship between labour
cost and regional FDI inflows in Vietnam was
also found in the studies of Nguyen (2006) and
Anwar and Nguyen (2010), but the opposite
was seen in the findings of Nguyen and Nguyen
(2007) and Hoang and Goujon (2014). Nguyen and Nguyen (2007) used the same variable,
monthly wage rate, and focused on only one
year before the global financial crisis (2006).
Another important difference is the fact that
their data was cross-sectional with only 63
observations while my study employs a panel
data which takes into account the dynamics
of variables over time. Besides, Hoang and
Goujon (2014) analysed two separate periods
with cross-sectional data, 2001-2006 and 20072010. They found that labour cost was positively related to FDI flows. However, labour cost
in their study was represented by a different
proxy which was the annual income per employee in the firm sector in each province. This
proxy could be an indicator for labour productivity, and thus its coefficient was positive in
all of their equations. Thus, the different results
on wage rates in my study compared to these
studies can be attributed to different periods of
analysis, methodology, sample size, and variable choices.
Several previous empirical studies have used
GDP and GDP capital to measure market potential or market size and just simply found
those variables had statistically significant
positive effects on regional FDI allocation in
Vietnam (Pham, 2002; Nguyen, 2006; Nguyen
and Nguyen, 2007; Anwar and Nguyen, 2010;
Hoang and Goujon, 2014). By using market
potential variables first introduced by Harris
(1954), my empirical results reveal that new
FDI inflows to Vietnam have a tendency towards provinces with higher external market
potential but lower internal market potential.
Labour factors
First, production cost measured by wage
rate has a negative impact on new FDI capital
at a 5% significance level while it has a positive impact on cumulative FDI capital at a 1%
significance level. Therefore, provinces with a
higher wage rate have a higher accumulation
of FDI but do not attract new foreign investors.
By contrast, the lower the wage rate a province
has, the more new FDI accrues to that province.
The result corresponds to the fact that areas
with higher FDI accumulation such as Hanoi,
Hai Phong, and Ho Chi Minh usually have
higher wage rates than the others. Interestingly, equation VI shows that wage rate is negatively related to the size of new FDI projects
at a 1% significance level. Thus, the tendency
is that large new foreign investors are in favor
of provinces with lower wage rates. Generally
speaking, my regression results show that wage
rate regarded as production cost has a negative
Journal of Economics and Development
Another striking result is the number of high
school students. Coefficients of this variable
are positive and highly significant in equations
on cumulative FDI capital and number of FDI
projects. This reveals that the availability of
educated labourers has a positive impact on
provincial FDI inflows. This result is consistent with previous studies on the role of human
31
Vol. 18, No.1, April 2016
ed coefficients of road density are positive and
statistically significant in equation IV on the
number of new FDI projects with a 1% significance level. Provinces with higher road density
receive more new FDI projects than the others.
Additionally, coefficients of the number of harbours are statistically significant at a 1% level
in equations of cumulative FDI in terms of both
capital and projects (equations I and III). These
results confirm the important role of infrastructure in attracting new FDI. They also reveal
that provinces that are adjacent to the sea attract more FDI as their geographical locations
are convenient for maritime exports.
capital in FDI distribution, although a number of different proxies were used such as the
number of secondary school pupils per capita
(Pham, 2002), the average number of university and college enrolments (Anwar and Nguyen,
2010), and etc.
Policy
Regarding provincial competitiveness, a significant positive relationship is seen between
the PCI and the number of new FDI projects.
However, the PCI negatively affects new FDI
capital and the size of new FDI projects. Thus,
it seems to be that provinces with higher PCI
receive a higher number of FDI projects but
a smaller amount of capital as well as smaller
size FDI projects. It would be more reasonable
if high PCI encouraged more foreign capital
and big projects because it reflects the ease
of doing business, economic governance, and
administrative reform efforts by local governments. I also attempted to run regression with
the PCI rank instead of the PCI index as provinces compete for foreign investment. The results, however, still show some negative influence of the PCI on provincial FDI. Thus, I only
present results with the PCI index here.
My results on infrastructure reinforce the
findings of previous studies even though different factors were used for infrastructure, such
as the average number of telephones (Pham,
2002; Nguyen, 2006), the number of industrial
zones (Mayer and Nguyen, 2005, Nguyen and
Nguyen, 2007), the percentage of paved roads
in each province (Hoang and Goujon, 2014).
Agglomeration force
As is clearly seen from Table 3, cumulative
FDI capital till the end of the previous year has
a strongly negative impact on total new FDI in
the current year. In contrast, the number of new
FDI projects is positively related to the cumulative number of FDI projects of the previous
year year at a 1% significance level.
Nguyen and Nguyen (2007) also used this
index for the policy factor, and the index was
statistically insignificant in all models in their
analysis. They concluded that either this index
was not an ideal measure of local governance
or it did not influence provincial FDI. From my
empirical results, the concern of PCI measurement still exists because higher PCI provinces
receive less new FDI capital and smaller new
projects.
According to the self-reinforcing FDI model
of Head and Ries (1996), foreign firms prefer
cities where other foreign firms are already
located. This may not be the case in Vietnam.
Specifically, the results on market potential reveal that new foreign investors are in favor of
provinces with higher external market potential
and lower internal market potential. Mean-
Infrastructure
When it comes to infrastructure, the estimatJournal of Economics and Development
32
Vol. 18, No.1, April 2016
Journal of Economics and Development
33
Vol. 18, No.1, April 2016
Previous cumulative FDI capital
Previous cumulative FDI projects
8
9
+
+
+
+
+
+
-
+
+
Expected
signs
6.304
(31.189)
0.67
188
63
0.000
RE
(I)
-1.700
(2.209)
4.923***
(1.364)
0.069***
(0.022)
6.996***
(2.457)
-0.680
(0.519)
-0.634
(1.781)
3.920***
(1.029)
Cumulative
91.251*
(46.682)
0.04
153
59
0.000
-0.354***
(0.046)
FE
(II)
3.442*
(1.960)
1.640
(1.238)
-0.036**
(0.010)
0.632
(5.741)
-1.394***
(0.491)
3.040
(2.000)
New
3.484***
(0.412)
N/A
188
63
0.000
Negative
Binominal
RE
(III)
0.057***
(0.015)
0.002
(0.005)
-0.0001
(0.0001)
0.039*
(0.021)
-0.003
(0.005)
0.010
(0.011)
0.067***
(0.018)
0.0008***
(0.0002)
-1.778**
(0.758)
N/A
147
57
0.000
Negative
Binominal
RE
(IV)
0.070**
(0.032)
-0.059***
(0.018)
-0.0002
(0.0003)
0.112***
(0.027)
0.040***
(0.012)
0.090***
(0.019)
0.002
(0.011)
New
Number of FDI projects
Cumulative
Notes: (*), (**), (***) indicate significance level at 10%, 5%, and 1%, respectively;
FE: Fixed Effects; RE: Random Effects; N/A: Not Applicable
Source: Author’s calculations
R-square
No.of observations
No.of groups
Prob>ch2
Constant
Harbour
7
High school students
4
Road density
Wage
3
6
Internal market potential
2
PCI
External market potential
1
5
Explanatory variables
No
Amount of FDI capital
Table 3: Estimation results
1.902
(0.791)
0.04
188
63
0.6232
RE
(V)
0.009
(0.053)
-0.009
(0.033)
0.0001
(0.0005)
0.039
(0.053)
-0.025
(0.013)
-0.035
(0.021)
0.014
(0.021)
Cumulative
48.469
(38.201)
0.003
147
57
0.000
FE
(VI)
2.961**
(1.520)
1.269
(0.932)
-0.040***
(0.015)
4.131
(4.523)
-1.161***
(0.403)
0.439
(1.583)
New
Average size of FDI projects
or higher external market potential are likely to
receive bigger FDI projects.
while, provinces with lower internal market potential also have a lower level of FDI accumulation. Moreover, there are more new projects
in the provinces with a higher cumulative number of FDI projects in previous year, but the total amount of capita is in the opposite direction.
In other words, the influx of new foreign capital has a strong tendency towards provinces
with a lower level of capital accumulation. All
these results show a good signal for the pattern
of uneven FDI distribution in Vietnam because
the trend of more FDI towards provinces with
less FDI concentration will contribute actively
to reduce the development gap between regions
in Vietnam. The empirical results also suggest
that FDI in Vietnam is efficiency-seeking because foreign investors seek low transportation
cost within the country, high quality labour,
low wage rate, infrastructure quality, and policy attractiveness.5
Third, FDI in Vietnam seems to create a
dispersion force to new FDI because new FDI
capital accrues more to provinces with higher
external market potential and lower capital accumulation than to provinces with high internal
market potential and high cumulative FDI.
Fourth, empirical results suggest that FDI in
Vietnam is in the form of efficiency-seeking
FDI.
Fifth, in line with the conclusion of Nguyen and Nguyen (2007), this study also reveals
that PCI measurement needs more attention
because some empirical results on the PCI are
not consistent with expectations on the index
value.
From a policy perspective, in order to increase FDI inflows into Vietnam in general and
decrease the unequal allocation of FDI flows
between provinces in particular, it is necessary
to invest in locational determinants of FDI.
Even though Vietnam has the advantage of a
low wage rate compared to other countries in
the region, facts have shown that the wage rate
in Vietnam has risen continuously in recent
years. Thus, low wages are not a long-term
condition to attract FDI. Instead, each province
needs to impose effective policies to improve
employees’ education and skills. Investing in
human capital is crucial to attract FDI in the
long-term. Plus, the location decisions of foreign firms are effected by locational authorities’ policies. Developing and maintaining a
friendly business environment, a sound administrative procedure, and a modern infrastructure system will contribute significantly to FDI
inflows to each province. Furthermore, poor
7. Conclusion and policy implications
By analyzing a panel dataset of 63 provinces and cities in Vietnam from 2008 to 2012,
this paper empirically analyzes the significant
effect of market potential, labour, infrastructure, FDI concentration, and provincial policy
attractiveness in FDI allocation between provinces and cities in Vietnam. The main findings
are as follows.
First, FDI is attracted by high external market potential, a low wage rate, high quality
and availability of human capital, and a better
infrastructure system. These are important agglomeration forces affecting FDI location in
Vietnam.
Second, wage rate and external market potential influence the size of FDI projects. To be
clearer, provinces with either lower wage rate
Journal of Economics and Development
34
Vol. 18, No.1, April 2016
and impose more specific incentive policies to
areas such as Northern midlands and mountain areas and Central Highlands are disadvantageous in attracting FDI because of their
low purchasing power (GDP) and remote geographical position, which leads to their low external and internal market potential. Therefore,
in order to attract FDI to those provinces, it is
essential to invest in their infrastructure system
support poor provinces in those regions. This,
in turn, will contribute to improve their income,
living standard and thus market potential. The
investment in human capital and the spending
on infrastructure would be optimal strategies to
attract FDI to all regions of the country.
Acknowledgement:
I would like to gratefully and sincerely thank Professor Andrzej Cieślik, Head of Department of
Macroeconomics and International Trade Theory, Faculty of Economic Sciences, University of Warsaw,
for his helpful guidance and kind support.
Notes:
1. accessed on
15th, October, 2014.
2. , accessed on 20th November, 2014.
3. accessed on 10th, November, 2014.
4. Report No.1433/QĐ-BGTVT, “Danh mục bến cảng thuộc các cảng biển Việt Nam” (List of harbours
belonging to Vietnamese sea ports), published on 21st April, 2014.
5. According to UNCTAD (1998), FDI is in the form of efficiency-seeking FDI when foreign firms seek
low cost of resources and assets in the host country such as raw materials, low-cost unskilled labour,
skilled labour, technological and other created assets and physical infrastructure. Additionally, firms
also take into account other factors including other input costs (transport and communication costs tofrom-and within the host economy and costs of other intermediate products), membership of a regional
integration agreement beneficial to the establishment of regional corporate networks.
References
Ali, S. and Guo, W.(2005), ‘Determinants of FDI in China’, Journal of Global Business and Technology,
1(2), 21-33.
Anwar, S. and Nguyen, P.L. (2010), ‘Foreign direct investment and economic growth in Vietnam’, Asia
Pacific Business Review, 16(1-2), 183–202.
Artige, L. and Nicolini, R. (2006), ‘Evidence on the Determinants of Foreign Direct Investment: The Case
of Three European Regions’, CREPP Working Papers.
Journal of Economics and Development
35
Vol. 18, No.1, April 2016
Baltagi, B.H. (2005), Econometric Analysis of Panel Data , 3rd edition, John Wiley & Sons Ltd, England.
Bui, N.H., Do, H., and Nguyen, X.T. (2014), 2014 FDI Report: Vietnam, LNT & Partners Corporation.
Cameron, A.C. and Trivedi, P.K. (1986), ‘Econometric Models Based on Count Data: Comparisons and
Applications of Some Estimators and Tests’, Journal of Applied Econometrics, 1(1), 29–53.
Cheng, L.K. and Kwan, Y.K. (2000), ‘What are the determinants of the location of foreign
direct investment? The Chinese experience’, Journal of International Economics, 51(2), 379–400.
Chidlow, A. and Young, S. (2008), ‘Regional Determinants of FDI Distribution in Poland’, William
Davidson Institute Working Paper, No. 943.
Cieslik, A. (2005), ‘Regional Characteristics and the Location of Foreign Firms within Poland’, Applied
Economics, 37(8), 863–874.
Cieslik, A. (2013), ‘Determinants of the location of foreign firms in Polish regions: Does firm size matter?’,
Journal of Economic and Social Geography, 104(2), 175-193.
Ekholm, K., Forslid, R., and Markusen, J.R., (2004), ‘Export-platform Foreign Direct Investment’, Institute
for International Integration Studies, IIIS Discussion Paper No.50.
Friedman, J., Fung, H., Gerlowski, D., and Silberman, J.(1996), ‘A note on State characteristics and the
location of foreign direct investment within the United States’, Review of Economics and Statistics,
78(2), 367–368.
Friedman, J., Gerlowski, D., and Silberman, J. (1992), ‘What attracts foreign multinational corporations?
Evidence from branch plant location in the United States’, Journal of Regional Science , 32(4), 403–
418.
GSO (2013), Vietnam’s Statistical Year Book, Statistical Publishing House.
Harris, C.D. (1954), The market as a factor in the localization of industry in the United States, Annals of the
Association of American Geographers, 44(4), 315-348.
Head, K. and J. Ries (1996), ‘Inter-city Competition for Foreign Investment: Static and Dynamic Effects of
China’s Incentive Areas’, Journal of Urban Economics, 40(1), 38–60.
Head, K., Ries, J., and Swenson, D. (1995), ‘Agglomeration benefits and location choice: evidence from
Japanese manufacturing investment in the United States’, Journal of International Economics, 38(34), 223–247.
Hoang, H.H. and Goujon, M. (2014), ‘Determinants of foreign direct investment in Vietnamese provinces:
a spatial economic analysis’, Post-Communist Economies, 26(1), 103-121.
Jenkins, R. (2006), ‘Globalization, FDI and employment in Viet Nam’, Transnational Corporations, 15(1),
116-142.
Mayer, K. and Nguyen, H.V. (2005), ‘Foreign Investment Strategies and Sub-national Institutions in
Emerging Markets: Evidence from Vietnam’, Journal of Management Studies, 42(1), 63-93.
Mayer, T. and Head, K. (2000), ‘Non-Europe: The Magnitude and Causes of Market Fragmentation in the
EU’, Review of World Economics, 136(2), 284-314.
Midelfart-Knarvik, K.H., Overman, H.G., Redding, S.J. and Venables, A.J. (2000), ‘The location of
European industry’, Economic Papers, Vol.142, European Economy. Economic Papers No.142.
Nguyen, N.A. and Nguyen, T. (2007), ‘Foreign Direct Investment in Vietnam: An overview and analysis the
determinants of spatial distribution across provinces’, MPRA Paper, No 1921.
Nguyen, P.L. (2006), ‘Foreign Direct Investment in Vietnam: Impact on Economic Growth and Domestic
Investment’, mimeo, Centre for Regulation and Market Analysis, University of South Australia, http://
www.ibrarian.net/navon/page.jsp?paperid=11703047&searchTerm=jing+ji
O’Huallachain, B. and Reid, N. (1997), ‘Acquisition versus greenfield investment: the location and growth
of Japanese manufacturers in the United States’, Regional Studies, 31(4), 403–416.
Journal of Economics and Development
36
Vol. 18, No.1, April 2016
Pham, H.M. (2002), ‘Regional Economic Development and Foreign Direct Investment Flows in Vietnam,
1988-98’, Journal of the Asia Pacific Economy, 7(2), 182-202.
Singh, D.D. (2003), Practical Statistics, Atlantic Publishers and Distributors, p. 287.
UNCTAD (1998), World Investment Report 1998.
Journal of Economics and Development
37
Vol. 18, No.1, April 2016