Lecture Macroeconomics - Chapter 3: Individual markets: Demand and supply
Bạn đang xem bản rút gọn của tài liệu. Xem và tải ngay bản đầy đủ của tài liệu tại đây (380.25 KB, 74 trang )
CHAPTER 3
INDIVIDUAL MARKETS
Demand & Supply
p
S
D
q
S LIDES PREPARED BY JUDITH S KUCE, GEORGIAN COLLEGE
© 2002 McGraw-Hill Ryerson Ltd.
Chapter 3
1
In
In this
this chapter
chapter you
you will
will learn
learn
What markets are
What demand is and what factors affect
it
What supply is and what factors affect it
How demand and supply together
determine market equilibrium
© 2002 McGraw-Hill Ryerson Ltd.
Chapter 3
2
CHAPTER
CHAPTER 33 TOPICS
TOPICS
MARKETS
DEMAND
SUPPLY
SUPPLY & DEMAND: MARKET
EQUILIBRIUM
© 2002 McGraw-Hill Ryerson Ltd.
Chapter 3
3
MARKETS
MARKETS
HOW ARE PRICES DETERMINED IN A
MARKET SYSTEM?
...BY INTERACTION BETWEEN BUYERS
SELLERS IN MARKETS
BY MARKETS WE MEAN…
© 2002 McGraw-Hill Ryerson Ltd.
Chapter 3
4
INSTITUTIONS THAT
BRING TOGETHER
BUYERS AND SELLERS
© 2002 McGraw-Hill Ryerson Ltd.
Chapter 3
5
MARKETS
MARKETS
for example:
– corner gas station
– farmer’s market
– Toronto Stock Exchange
– etc.
© 2002 McGraw-Hill Ryerson Ltd.
Chapter 3
6
ASSUMPTIONS
ASSUMPTIONS
Competitive markets:
many independent buyers & sellers
standardized products
© 2002 McGraw-Hill Ryerson Ltd.
Chapter 3
7
CHAPTER
CHAPTER 33 TOPICS
TOPICS
MARKETS
DEMAND
SUPPLY
SUPPLY & DEMAND: MARKET
EQUILIBRIUM
© 2002 McGraw-Hill Ryerson Ltd.
Chapter 3
8
DEMAND
DEMAND
a schedule or a curve that shows the
various amounts consumers are willing
and able to purchase at each of a series
of possible prices, during some
specified period of time
© 2002 McGraw-Hill Ryerson Ltd.
Chapter 3
9
DEMAND
DEMAND
The information
can be
presented in a
demand
schedule
DEMAND
© 2002 McGraw-Hill Ryerson Ltd.
P
Qd
$1
80
$2
55
$3
35
$4
20
$5
10
Chapter 3
10
DEMAND
DEMAND
The information
can be
presented in a
demand
schedule
quantity
demanded
© 2002 McGraw-Hill Ryerson Ltd.
P
Qd
$1
80
$2
55
$3
35
$4
20
$5
10
Chapter 3
11
or graphed
P
Qd
$1
80
$2
55
$3
35
$4
20
$5
10
© 2002 McGraw-Hill Ryerson Ltd.
Chapter 3
12
or graphed
Qd
$1
80
$2
55
$3
35
$4
20
$5
10
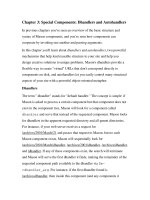
Demand
Figure 3-1
price
P
6
5
4
3
2
1
0
0
© 2002 McGraw-Hill Ryerson Ltd.
20
40
60
80
100
quantity
Chapter 3
13
or graphed
Qd
$1
80
$2
55
$3
35
$4
20
$5
10
Demand
Figure 3-1
price
P
6
5
4
3
2
1
0
0
© 2002 McGraw-Hill Ryerson Ltd.
20
40
60
80
100
quantity
Chapter 3
14
or graphed
Qd
$1
80
$2
55
$3
35
$4
20
$5
10
Demand
Figure 3-1
price
P
6
5
4
3
2
1
0
0
© 2002 McGraw-Hill Ryerson Ltd.
20
40
60
80
100
quantity
Chapter 3
15
or graphed
Qd
$1
80
$2
55
$3
35
$4
20
$5
10
Demand
Figure 3-1
price
P
6
5
4
3
2
1
0
0
© 2002 McGraw-Hill Ryerson Ltd.
20
40
60
80
100
quantity
Chapter 3
16
or graphed
Qd
$1
80
$2
55
$3
35
$4
20
$5
10
Demand
Figure 3-1
price
P
6
5
4
3
2
1
0
0
© 2002 McGraw-Hill Ryerson Ltd.
20
40
60
80
100
quantity
Chapter 3
17
LAW
LAW OF
OF DEMAND
DEMAND
all else equal, as price falls, the quantity
demanded rises (& vice versa)
supported by:
– concept of diminishing marginal utility
– income effect
– substitution effect
© 2002 McGraw-Hill Ryerson Ltd.
Chapter 3
18
INDIVIDUAL VS. MARKET DEMAND
price
QD–1st QD–2nd
buyer
buyer
QD–
market
+ 12 = 22
$5
10
$4
20
23
43
$3
35
39
74
$2
55
60
115
$1
80
87
167
© 2002 McGraw-Hill Ryerson Ltd.
Chapter 3
19
Individual Demand 2
$5
$4
$4
$3
$3
price
$5
$2
$2
$1
$1
$0
$0
0
20
3540
60
80
0
20
quantity
40
39
60
80
quantity
Market Demand
$5
$4
price
price
Individual Demand 1
$3
$2
$1
$0
0
50
74
100
150
quantity
© 2002 McGraw-Hill Ryerson Ltd.
Chapter 3
20
DETERMINANTS
DETERMINANTS OF
OF DEMAND
DEMAND
PRICE is the most important influence
on the amount of any product
purchased
a change in price yields a movement
along the demand curve & a change in
quantity demanded
© 2002 McGraw-Hill Ryerson Ltd.
Chapter 3
21
PA
D
movement along the
curve
P1
P2
Q1 Q2
QA
change in price
change in quantity demanded
© 2002 McGraw-Hill Ryerson Ltd.
Chapter 3
22
CHANGE IN DEMAND
PA
D
D’
QA
when any OTHER determinant
changes
shift in the demand curve
© 2002 McGraw-Hill Ryerson Ltd.
Chapter 3
23
CHANGE
CHANGE IN
IN DEMAND
DEMAND
Demand Shifters are changes in:
tastes (preferences)
number of buyers
income
prices of related goods
expectations
let’s examine these more closely…
© 2002 McGraw-Hill Ryerson Ltd.
Chapter 3
24
CHANGE
CHANGE IN
IN DEMAND
DEMAND
Changes in tastes (preferences)
positive change shifts D curve right
more will be demanded at each price
PA
D
D’
not up
or down
QA
© 2002 McGraw-Hill Ryerson Ltd.
Chapter 3
25