Ebook Strategic management and business policy (13th edition): Part 2
Bạn đang xem bản rút gọn của tài liệu. Xem và tải ngay bản đầy đủ của tài liệu tại đây (11.41 MB, 501 trang )
PA R T
Introduction to
Case Analysis
5
CHAPTER
12
suggestions for
Case Analysis
Howard Schilit, founder of the Center for Financial Research & Analysis
(CFRA), works with a staff of 15 analysts to screen financial databases and analyze
public financial filings of 3,600 companies, looking for inconsistencies and aggressive accounting methods. Schilit calls this search for hidden weaknesses in a company’s performance forensic accounting. “I’m like an investigative reporter,” explains
Schilit. “I’m interested in finding companies where the conventional wisdom is that they’re
very healthy, but if you dig a bit deeper, you find the emperor is not wearing the clothes you
thought.”1 He advises anyone interested in analyzing a company to look deeply into its financial
statements. For example, when the CFRA noticed that Kraft Foods made $122 million in acquisitions in 2002, but claimed $539 million as “goodwill” assets related to the purchases, it concluded
that Kraft was padding its earnings with one-time gains. According to Schilit, unusually high
goodwill gains related to recent acquisitions is a red flag that suggests an underlying problem.
Schilit proposes a short checklist of items to examine for red flags:
{
Cash flow from operations should exceed net income: If cash flow from operations drops
below net income, it could mean that the company is propping up its earnings by selling assets, borrowing cash, or shuffling numbers. Says Schilit, “You could have spotted the problems at Enron by just doing this.”2
{
Accounts receivable should not grow faster than sales: A firm facing slowing sales can
make itself look better by inflating accounts receivable with expected future sales and by
making sales to customers who are not credit worthy. “It’s like mailing a contract to a dead
person and then counting it as a sale,” says Schilit.3
{
Gross margins should not fluctuate over time: A change of more than 2% in either direction from year to year is worth a closer look. It could mean that the company is using other
revenue, such as sales of assets or write-offs to boost profits. Sunbeam reported an increase
of 10% in gross margins just before it was investigated by the SEC.
{
Examine carefully information about top management and the board: When Schilit learned
that the chairman of Checkers Restaurants had put his two young sons on the board, he
warned investors of nepotism. Two years later, Checkers’ huge debt caused its stock to fall
85% and all three family members were forced out of the company.
Learning Objectives
After reading this chapter, you should be able to:
{
{
Research the case situation as needed
Analyze financial statements by using
ratios and common-size statements
{
{
Use the strategic audit as a method of
organizing and analyzing case information
Footnotes are important: When companies change their accounting assumptions to
make the statements more attractive, they often bury their rationale in the footnotes.
Schilit dislikes companies that extend the depreciable life of their assets. “There’s only
one reason to do that—to add a penny or two to earnings—and it makes me very mistrustful of management.”4
Schilit makes his living analyzing companies and selling his reports to investors. Annual reports and financial statements provide a lot of information about a company’s health, but
it’s hard to find problem areas when management is massaging the numbers to make the
company appear more attractive than it is. That’s why Michelle Leder created her Web site,
www.footnoted.org. She likes to highlight “the things that companies bury in their routine SEC filings.”5 This type of in-depth, investigative analysis is a key part of analyzing
strategy cases. This chapter provides various analytical techniques and suggestions for
conducting this kind of case analysis.
12.1
The Case Method
The analysis and discussion of case problems has been the most popular method of teaching
strategy and policy for many years. The case method provides the opportunity to move from
a narrow, specialized view that emphasizes functional techniques to a broader, less precise
analysis of the overall corporation. Cases present actual business situations and enable you to
examine both successful and unsuccessful corporations. In case analysis, you might be asked
to critically analyze a situation in which a manager had to make a decision of long-term corporate importance. This approach gives you a feel for what it is like to face making and implementing strategic decisions.
365
366
PART 5
12.2
Introduction to Case Analysis
Researching the Case Situation
You should not restrict yourself only to the information written in the case unless your instructor states otherwise. You should, if possible, undertake outside research about the environmental setting. Check the decision date of each case (typically the latest date mentioned in the case)
to find out when the situation occurred and then screen the business periodicals for that time
period. An understanding of the economy during that period will help you avoid making a serious error in your analysis, for example, suggesting a sale of stock when the stock market is
at an all-time low or taking on more debt when the prime interest rate is over 15%. Information about the industry will provide insights into its competitive activities. Important Note:
Don’t go beyond the decision date of the case in your research unless directed to do so by your
instructor.
Use computerized company and industry information services such as Compustat, Compact Disclosure, and CD/International, available on CD-ROM or online at the library. On the
Internet, Hoover’s OnLine Corporate Directory (www.hoovers.com) and the Security Exchange Commission’s Edgar database (www.sec.gov) provide access to corporate annual reports and 10-K forms. This background will give you an appreciation for the situation as it was
experienced by the participants in the case. Use a search engine such as Google to find additional information about the industry and the company.
A company’s annual report and SEC 10-K form from the year of the case can be very
helpful. According to the Yankelovich Partners survey firm, 8 out of 10 portfolio managers and
75% of security analysts use annual reports when making decisions.6 They contain not only
the usual income statements and balance sheets, but also cash flow statements and notes to the
financial statements indicating why certain actions were taken. 10-K forms include detailed
information not usually available in an annual report. SEC 10-Q forms include quarterly financial reports. SEC 14-A forms include detailed information on members of a company’s
board of directors and proxy statements for annual meetings. Some resources available for research into the economy and a corporation’s industry are suggested in Appendix 12.A.
A caveat: Before obtaining additional information about the company profiled in a particular case, ask your instructor if doing so is appropriate for your class assignment. Your strategy instructor may want you to stay within the confines of the case information provided in
the book. In this case, it is usually acceptable to at least learn more about the societal environment at the time of the case.
12.3
Financial Analysis: A Place to Begin
Once you have read a case, a good place to begin your analysis is with the financial statements.
Ratio analysis is the calculation of ratios from data in these statements. It is done to identify
possible financial strengths or weaknesses. Thus it is a valuable part of SWOT analysis. A review of key financial ratios can help you assess a company’s overall situation and pinpoint
some problem areas. Ratios are useful regardless of firm size and enable you to compare a
company’s ratios with industry averages. Table 12–1 lists some of the most important financial ratios, which are (1) liquidity ratios, (2) profitability ratios, (3) activity ratios, and
(4) leverage ratios.
CHAPTER 12
TABLE 12–1
Suggestions for Case Analysis
367
Financial Ratio Analysis
How
Expressed
Formula
1. Liquidity Ratios
Current ratio
Quick (acid test) ratio
Inventory to net
working capital
Cash ratio
Current assets
Current liabilities
Decimal
Current assets Ϫ Inventory
Current liabilities
Decimal
Inventory
Decimal
Current assets Ϫ Current liabilities
Cash ϩ Cash equivalents
Current liabilities
Meaning
A short-term indicator of the company’s
ability to pay its short-term liabilities from
short-term assets; how much of current
assets are available to cover each dollar of
current liabilities.
Measures the company’s ability to pay off
its short-term obligations from current
assets, excluding inventories.
A measure of inventory balance; measures
the extent to which the cushion of excess
current assets over current liabilities may
be threatened by unfavorable changes in
inventory.
Decimal
Measures the extent to which the
company’s capital is in cash or cash
equivalents; shows how much of the
current obligations can be paid from cash
or near-cash assets.
Net profit after taxes
Net sales
Percentage
Shows how much after-tax profits are
generated by each dollar of sales.
Sales Ϫ Cost of goods sold
Net sales
Percentage
Indicates the total margin available to
cover other expenses beyond cost of goods
sold and still yield a profit.
Return on investment
(ROI)
Net profit after taxes
Total assets
Percentage
Measures the rate of return on the total
assets utilized in the company; a measure
of management’s efficiency, it shows the
return on all the assets under its control,
regardless of source of financing.
Return on equity
(ROE)
Net profit after taxes
Shareholders’ equity
Percentage
Measures the rate of return on the book
value of shareholders’ total investment in
the company.
Dollars
per share
Shows the after-tax earnings generated for
each share of common stock.
Decimal
Measures the number of times that average
inventory of finished goods was turned
over or sold during a period of time,
usually a year.
Days
Measures the number of one day’s worth
of inventory that a company has on hand at
any given time.
2. Profitability Ratios
Net profit margin
Gross profit margin
Earnings per share
(EPS)
3. Activity Ratios
Inventory turnover
Days of inventory
Net profit after taxes –
Preferred stock dividends
Average number of
common shares
Net sales
Inventory
Inventory
Cost of goods sold Ϭ 365
continued
368
PART 5
TABLE 12–1
Introduction to Case Analysis
Financial Ratio Analysis , (continued)
How
Expressed
Formula
Meaning
Net sales
Net working capital
Decimal
Measures how effectively the net working
capital is used to generate sales.
Asset turnover
Sales
Total assets
Decimal
Measures the utilization of all the
company’s assets; measures how many
sales are generated by each dollar of assets.
Fixed asset turnover
Sales
Fixed assets
Decimal
Measures the utilization of the company’s
fixed assets (i.e., plant and equipment);
measures how many sales are generated by
each dollar of fixed assets.
Net working capital
turnover
Average collection
period
Accounts receivable
Sales for year Ϭ 365
Days
Indicates the average length of time in
days that a company must wait to collect a
sale after making it; may be compared to
the credit terms offered by the company to
its customers.
Accounts receivable
turnover
Annual credit sales
Accounts receivable
Decimal
Indicates the number of times that accounts
receivable are cycled during the period
(usually a year).
Accounts payable
period
Accounts payable
Purchases for year Ϭ 365
Days
Indicates the average length of time in
days that the company takes to pay its
credit purchases.
Days of cash
Cash
Net sales for year Ϭ 365
Days
Indicates the number of days of cash on
hand, at present sales levels.
Percentage
Measures the extent to which borrowed
funds have been used to finance the
company’s assets.
4. Leverage Ratios
Debt to asset ratio
Total debt
Total assets
Debt to equity ratio
Total debt
Shareholders’ equity
Percentage
Measures the funds provided by creditors
versus the funds provided by owners.
Long-term debt to
capital structure
Long-term debt
Shareholders’ equity
Profit before taxes ϩ
Interest charges
Interest charges
Percentage
Measures the long-term component of
capital structure.
Decimal
Indicates the ability of the company to
meet its annual interest costs.
Coverage of fixed
charges
Profit before taxes ϩ
Interest charges ϩ
Lease charges
Interest charges ϩ
Lease obligations
Decimal
A measure of the company’s ability to
meet all of its fixed-charge obligations.
Current liabilities
to equity
Current liabilities
Shareholders’ equity
Percentage
Measures the short-term financing portion
versus that provided by owners.
Times interest earned
CHAPTER 12
TABLE 12–1
Suggestions for Case Analysis
369
Financial Ratio Analysis, (continued)
Formula
Market price per share
Earnings per share
5. Other Ratios
Price/earnings ratio
Divided payout ratio
Dividend yield on
common stock
How
Expressed
Meaning
Decimal
Shows the current market’s evaluation of a
stock, based on its earnings; shows how
much the investor is willing to pay for each
dollar of earnings.
Annual dividends per share
Annual earnings per share
Percentage
Indicates the percentage of profit that is
paid out as dividends.
Annual dividends per share
Current market price per share
Percentage
Indicates the dividend rate of return to
common shareholders at the current market
price.
NOTE: In using ratios for analysis, calculate ratios for the corporation and compare them to the average and quartile ratios for the particular industry. Refer to Standard & Poor’s and Robert Morris Associates for average industry data. Special thanks to Dr. Moustafa H. Abdelsamad,
Dean, Business School, Texas A&M University—Corpus Christi, Corpus Christi, Texas, for his definitions of these ratios.
ANALYZING FINANCIAL STATEMENTS
In your analysis, do not simply make an exhibit that includes all the ratios (unless your instructor requires you to do so), but select and discuss only those ratios that have an impact on the
company’s problems. For instance, accounts receivable and inventory may provide a source of
funds. If receivables and inventories are double the industry average, reducing them may provide needed cash. In this situation, the case report should include not only sources of funds but
also the number of dollars freed for use. Compare these ratios with industry averages to discover whether the company is out of line with others in the industry. Annual and quarterly industry ratios can be found in the library or on the Internet. (See the resources for case research
in Appendix 12.A.) In the years to come, expect to see financial entries for the trading of CERs
(Certified Emissions Reductions). This is the amount of money a company earns from reducing carbon emissions and selling them on the open market. To learn how carbon trading is
likely to affect corporations, see the Environmental Sustainability Issue.
A typical financial analysis of a firm would include a study of the operating statements for
five or so years, including a trend analysis of sales, profits, earnings per share, debt-to-equity ratio, return on investment, and so on, plus a ratio study comparing the firm under study with industry standards. As a minimum, undertake the following five steps in basic financial analysis.
1. Scrutinize historical income statements and balance sheets: These two basic statements provide most of the data needed for analysis. Statements of cash flow may also be
useful.
2. Compare historical statements over time if a series of statements is available.
3. Calculate changes that occur in individual categories from year to year, as well as the
cumulative total change.
4. Determine the change as a percentage as well as an absolute amount.
5. Adjust for inflation if that was a significant factor.
Examination of this information may reveal developing trends. Compare trends in one
category with trends in related categories. For example, an increase in sales of 15% over three
years may appear to be satisfactory until you note an increase of 20% in the cost of goods sold
370
PART 5
Introduction to Case Analysis
ENVIRONMENTAL
sustainability issue
IMPACT OF CARBON TRADING
Do you know about carbon
trading,
emissions
allowances, cap-and-trade, or
CERs? These are terms you can
expect to hear a lot more in the
years to come. The concept of carbon
trading is something that will soon be affecting the balance sheets and income statements of all corporations, especially those with international operations. It is one way
to account for environmental sustainability initiatives.
The Kyoto Protocol established an emissions trading
program that assigned annual limits on greenhouse gases
emitted by facilities within each country’s boundaries. The
countries signing the pact, including Canada, Japan, and
the European Union, were then able to trade emission surpluses and deficits with each other. In addition, individual
countries or companies could invest in projects in developing nations that would reduce emissions and use those reductions to meet their own targets.
In 2005 the European Union initiated a trading system
allowing individual facilities to sell credit allowances they
had earned for reducing greenhouse gas emissions. It created a tradable commodity, the Certified Emissions Reduction (CER), which gave a facility the right to emit one
metric ton of carbon dioxide annually. The CER was created
by another facility that reduced its carbon dioxide emissions. (Reducing or trapping one metric ton of methane
from entering the atmosphere was worth 21 CERs due to
methane’s greater impact on global warming.) By 2006, a
CER traded on the European market for around 25 euros
with trading volume totaling one million CERs per day. Barclays, Citibank, Credit Suisse, HSBC, Lehman Brothers, and
Morgan Stanley soon opened trading desks for CERs at
London’s Canary Wharf, the global center for carbon trading. By 2007, European and Asian traders bought and sold
approximately $60 billion worth of emission CERs.
Carbon trading has created an opportunity for new and
established companies. For example, Mission Point Capital
Partners is one of more than 50 private equity and hedge
funds specializing in carbon finance and clean energy. Mission Point created a joint venture in 2008 with GE and AES
to develop large volumes of emissions credits. These would
be sold to U.S. companies like Yahoo! and News Corp that
wanted to become carbon neutral by offsetting their carbon emissions. Assuming that the U.S. federal government
would soon establish a cap-and-trade market for emissions,
the joint venture partners expected to produce 10 million
tons of emission credits by 2010. According to Kevin Walsh,
managing director of GE Energy Financial Services, “We
think this is going to be an enormous market.”
SOURCE: A. White, “Environment: The Greening of the Balance
Sheet,” Harvard Business Review (March 2006), pp. 27–28;
M. Gunther, “Carbon Finance Comes of Age,” Fortune (April 28,
2008), pp. 124–132.
during the same period. The outcome of this comparison might suggest that further investigation into the manufacturing process is necessary. If a company is reporting strong net income
growth but negative cash flow, this would suggest that the company is relying on something
other than operations for earnings growth. Is it selling off assets or cutting R&D? If accounts
receivable are growing faster than sales revenues, the company is not getting paid for the products or services it is counting as sold. Is the company dumping product on its distributors at the
end of the year to boost its reported annual sales? If so, expect the distributors to return the unordered product the next month, thus drastically cutting the next year’s reported sales.
Other “tricks of the trade” need to be examined. Until June 2000, firms growing through
acquisition were allowed to account for the cost of the purchased company, through the pooling of both companies’ stock. This approach was used in 40% of the value of mergers between
1997 and 1999. The pooling method enabled the acquiring company to disregard the premium
it paid for the other firm (the amount above the fair market value of the purchased company
often called “good will”). Thus, when PepsiCo agreed to purchase Quaker Oats for $13.4 billion in PepsiCo stock, the $13.4 billion was not found on PepsiCo’s balance sheet. As of June
2000, merging firms must use the “purchase” accounting rules in which the true purchase price
is reflected in the financial statements.7
CHAPTER 12
GLOBAL
Suggestions for Case Analysis
371
issue
FINANCIAL STATEMENTS OF MULTINATIONAL
CORPORATIONS: NOT ALWAYS WHAT THEY SEEM
A multinational corporation
follows the accounting rules
for its home country. As a result, its financial statements may
be somewhat difficult to understand or
to use for comparisons with competitors from other
countries. For example, British firms such as British Petroleum use the term turnover rather than sales revenue. In
the case of AB Electrolux of Sweden, a footnote to an an-
nual report indicates that the consolidated accounts have
been prepared in accordance with Swedish accounting
standards, which differ in certain significant respects from
U.S. generally accepted accounting principles (U.S.
GAAP). For one year, net income of 4,830m SEK (Swedish
kronor) approximated 5,655m SEK according to U.S.
GAAP. Total assets for the same period were 84,183m
SEK according to Swedish principle, but 86,658m according to U.S. GAAP.
The analysis of a multinational corporation’s financial statements can get very complicated, especially if its headquarters is in another country that uses different accounting standards. See the Global Issue for why financial analysis can get tricky at times.
COMMON-SIZE STATEMENTS
Common-size statements are income statements and balance sheets in which the dollar figures have been converted into percentages. These statements are used to identify trends in each
of the categories, such as cost of goods sold as a percentage of sales (sales is the denominator). For the income statement, net sales represent 100%: calculate the percentage for each category so that the categories sum to the net sales percentage (100%). For the balance sheet, give
the total assets a value of 100% and calculate other asset and liability categories as percentages of the total assets with total assets as the denominator. (Individual asset and liability
items, such as accounts receivable and accounts payable, can also be calculated as a percentage of net sales.)
When you convert statements to this form, it is relatively easy to note the percentage that
each category represents of the total. Look for trends in specific items, such as cost of goods
sold, when compared to the company’s historical figures. To get a proper picture, however, you
need to make comparisons with industry data, if available, to see whether fluctuations are
merely reflecting industry-wide trends. If a firm’s trends are generally in line with those of the
rest of the industry, problems are less likely than if the firm’s trends are worse than industry
averages. If ratios are not available for the industry, calculate the ratios for the industry’s best
and worst firms and compare them to the firm you are analyzing. Common-size statements are
especially helpful in developing scenarios and pro forma statements because they provide a
series of historical relationships (for example, cost of goods sold to sales, interest to sales, and
inventories as a percentage of assets) from which you can estimate the future with your scenario assumptions for each year.
Z-VALUE AND INDEX OF SUSTAINABLE GROWTH
If the corporation being studied appears to be in poor financial condition, use Altman’s
Z-Value Bankruptcy Formula to calculate its likelihood of going bankrupt. The Z-value formula
372
PART 5
Introduction to Case Analysis
combines five ratios by weighting them according to their importance to a corporation’s financial strength. The formula is:
Z ϭ 1.2x1 ϩ 1.4x2 ϩ 3.3x3 ϩ 0.6x4 ϩ 1.0x5
where:
x1
x2
x3
x4
x5
ϭ Working capital/Total assets (%)
ϭ Retained earnings/Total assets (%)
ϭ Earnings before interest and taxes/Total assets (%)
ϭ Market value of equity/Total liabilities (%)
ϭ Sales/Total assets (number of times)
A score below 1.81 indicates significant credit problems, whereas a score above 3.0 indicates a healthy firm. Scores between 1.81 and 3.0 indicate question marks.8 The Altman Z
model has achieved a remarkable 94% accuracy in predicting corporate bankruptcies. Its accuracy is excellent in the two years before financial distress, but diminishes as the lead time
increases.9
The index of sustainable growth is useful to learn whether a company embarking on a
growth strategy will need to take on debt to fund this growth. The index indicates how much
of the growth rate of sales can be sustained by internally generated funds. The formula is:
g* =
3P11 - D211 + L24
3T - P11 - D211 + L24
where:
P
D
L
T
ϭ (Net profit before tax/Net sales)ϫ100
ϭ Target dividends/Profit after tax
ϭ Total liabilities/Net worth
ϭ (Total assets/Net sales)ϫ100
If the planned growth rate calls for a growth rate higher than its g*, external capital will be
needed to fund the growth unless management is able to find efficiencies, decrease dividends,
increase the debt-equity ratio, or reduce assets through renting or leasing arrangements.10
USEFUL ECONOMIC MEASURES
If you are analyzing a company over many years, you may want to adjust sales and net income
for inflation to arrive at “true” financial performance in constant dollars. Constant dollars are
dollars adjusted for inflation to make them comparable over various years. One way to adjust
for inflation in the United States is to use the Consumer Price Index (CPI), as given in
Table 12–2. Dividing sales and net income by the CPI factor for that year will change the figures to 1982–1984 U.S. constant dollars (when the CPI was 1.0). Adjusting for inflation is especially important for companies operating in the emerging economies, like China and Russia,
where inflation in 2008 rose to 6.6%, the highest in 10 years. In that same year, Zimbabwe’s
inflation rate was the highest in the world at 2.2 million%!11
Another helpful analytical aid provided in Table 12–2 is the prime interest rate, the rate
of interest banks charge on their lowest-risk loans. For better assessments of strategic decisions, it can be useful to note the level of the prime interest rate at the time of the case. A decision to borrow money to build a new plant would have been a good one in 2003 at 4.1% but
less practical in 2007 when the average rate was 8.1%.
CHAPTER 12
Year
GDP (in $ billions)
Gross Domestic
Product
1980
1985
1990
1995
1996
1997
1998
1999
2000
2001
2002
2003
2004
2005
2006
2007
2008
2,789.5
4,220.3
5,803.1
7,397.7
7,816.9
8,304.3
8,747.0
9,268.4
9,817.0
10,128.0
10,469.6
10,960.8
11,685.9
12,421.9
13,178.4
13,807.5
14,280.7
TABLE 12–2
U.S. Economic
Indicators
Suggestions for Case Analysis
CPI (for all items)
Consumer Price
Index
.824
1.076
1.307
1.524
1.569
1.605
1.630
1.666
1.722
1.771
1.799
1.840
1.889
1.953
2.016
2.073
2.153
373
PIR (in %)
Prime Interest
Rate
15.27
9.93
10.01
8.83
8.27
8.44
8.35
7.99
9.23
6.92
4.68
4.12
4.29
6.10
7.94
8.08
5.21
Ï
NOTES: Gross Domestic Product (GDP) in Billions of Dollars; Consumer Price Index for All Items (CPI) (1982–84
ϭ 1.0); Prime Interest Rate (PIR) in Percentages.
SOURCES: Gross Domestic Product (GDP) from U.S. Bureau of Economic Analysis, National Economic Accounts
(www.bea.gov). Consumer Price Index (CPI) from U.S. Bureau of Labor Statistics (www.bls.gov). Prime Interest
Rate (PIR) from www.moneycafe.com.
In preparing a scenario for your pro forma financial statements, you may want to use the
gross domestic product (GDP) from Table 12–2. GDP is used worldwide and measures the
total output of goods and services within a country’s borders. The amount of change from one
year to the next indicates how much that country’s economy is growing. Remember that scenarios have to be adjusted for a country’s specific conditions. For other economic information,
see the resources for case research in Appendix 12.A.
12.4
Format for Case Analysis: The Strategic Audit
There is no one best way to analyze or present a case report. Each instructor has personal preferences for format and approach. Nevertheless, in Appendix 12.B we suggest an approach for
both written and oral reports that provides a systematic method for successfully attacking a
case. This approach is based on the strategic audit, which is presented at the end of Chapter 1
in Appendix 1.A). We find that this approach provides structure and is very helpful for the typical student who may be a relative novice in case analysis. Regardless of the format chosen,
be careful to include a complete analysis of key environmental variables—especially of trends
in the industry and of the competition. Look at international developments as well.
If you choose to use the strategic audit as a guide to the analysis of complex strategy cases,
you may want to use the strategic audit worksheet in Figure 12–1. Print a copy of the worksheet to use to take notes as you analyze a case. See Appendix 12.C for an example of a completed student-written analysis of a 1993 Maytag Corporation case done in an outline form
FIGURE 12–1
Strategic Audit
Worksheet
Analysis
Strategic Audit Heading
I.
(+) Factors
(−) Factors
Comments
Current Situation
A. Past Corporate Performance Indexes
B. Strategic Posture:
Current Mission
Current Objectives
Current Strategies
Current Policies
SWOT Analysis Begins:
II.
Corporate Governance
A. Board of Directors
B. Top Management
III. External Environment (EFAS):
Opportunities and Threats (SWOT)
A. Natural Environment
B. Societal Environment
C. Task Environment (Industry Analysis)
IV.
Internal Environment (IFAS):
Strengths and Weaknesses (SWOT)
A. Corporate Structure
B. Corporate Culture
C. Corporate Resources
1. Marketing
2. Finance
3. Research and Development
4. Operations and Logistics
5. Human Resources
6. Information Technology
V.
Analysis of Strategic Factors (SFAS)
A. Key Internal and External
Strategic Factors (SWOT)
B. Review of Mission and Objectives
SWOT Analysis Ends. Recommendation Begins:
VI. Alternatives and Recommendations
A. Strategic Alternatives—pros and cons
B. Recommended Strategy
VII. Implementation
VIII. Evaluation and Control
NOTE: See the complete Strategic Audit on pages 34–41. It lists the pages in the book that discuss each of the eight
headings.
SOURCE: T. L. Wheelen and J. D. Hunger, “Strategic Audit Worksheet.” Copyright © 1985, 1986, 1987, 1988, 1989,
2005, and 2009 by T. L. Wheelen. Copyright © 1989, 2005, and 2009 by Wheelen and Hunger Associates. Revised
1991, 1994, and 1997. Reprinted by permission. Additional copies available for classroom use in Part D of Case
Instructors Manual and on the Prentice Hall Web site (www.prenhall.com/wheelen).
374
CHAPTER 12
Suggestions for Case Analysis
375
using the strategic audit format. This is one example of what a case analysis in outline form
may look like.
Case discussion focuses on critical analysis and logical development of thought. A solution is satisfactory if it resolves important problems and is likely to be implemented successfully. How the corporation actually dealt with the case problems has no real bearing on the
analysis because management might have analyzed its problems incorrectly or implemented a
series of flawed solutions.
End of Chapter SUMMARY
Using case analysis is one of the best ways to understand and remember the strategic management process. By applying to cases the concepts and techniques you have learned, you will be
able to remember them long past the time when you have forgotten other memorized bits of
information. The use of cases to examine actual situations brings alive the field of strategic
management and helps build your analytic and decision-making skills. These are just some of
the reasons why the use of cases in disciplines from agribusiness to health care is increasing
throughout the world.
ECO-BITS
A 2007 McKinsey & Company survey of 7,751 people
in eight countries found that 87% of consumers worry
about the environment and the social impact of the
products they buy.
The same 2007 survey found that only 33% of the consumers said that they were ready to buy green products
or had already done so.
In a 2007 Chain Store Age survey of U.S. consumers,
only 25% of them had bought any green products other
than organic food or energy-efficient lighting.12
DISCUSSION QUESTIONS
1. Why should you begin a case analysis with a financial
analysis? When are other approaches appropriate?
4. When is inflation an important issue in conducting case
analysis? Why bother?
2. What are common-size financial statements? What is
their value to case analysis? How are they calculated?
5. How can you learn what date a case took place?
3. When should you gather information outside a case by
going to the library or using the Internet? What should
you look for?
376
PART 5
Introduction to Case Analysis
STRATEGIC PRACTICE EXERCISE
Convert the following two years of income statements from
the Maytag Corporation into common-size statements. The
dollar figures are in thousands. What does converting to a
common size reveal?
Consolidated Statements of Income: Maytag Corporation
1992
Net sales
Cost of sales
Gross profits
Selling, general, & admin. expenses
Reorganization expenses
Operating income
Interest expense
Other—net
Income before taxes and
accounting changes
Income taxes
Income before accounting changes
Effects of accounting changes
for postretirement benefits
Net income (loss)
%
1991
%
$3,041,223
2,339,406
701,817
528,250
95,000
78,567
(75,004)
3,983
7,546
100
—
—
—
—
—
—
—
—
$2,970,626
2,254,221
716,405
524,898
0
191,507
(75,159)
7,069
123,417
100
—
—
—
—
—
—
—
—
(15,900)
(8,354)
(307,000)
—
—
—
(44,400)
79,017
0
—
—
—
$(315,354)
—
$79,017
—
KEY TERMS
activity ratio (p. 366)
Altman’s Z-Value Bankruptcy
Formula (p. 371)
annual report (p. 366)
common-size statement (p. 371)
constant dollars (p. 372)
gross domestic product (GDP) (p. 373)
index of sustainable growth (p. 372)
leverage ratio (p. 366)
liquidity ratio (p. 366)
prime interest rate (p. 372)
profitability ratio (p. 366)
ratio analysis (p. 366)
SEC 10-K form (p. 366)
SEC 10-Q form (p. 366)
SEC 14-A form (p. 366)
strategic audit worksheet (p. 373)
NOTES
1. M. Heimer, “Wall Street Sherlock,” Smart Money (July 2003),
2.
3.
4.
5.
6.
7.
pp. 103–107.
Ibid., p. 105.
Ibid., p. 105.
Ibid., p. 105.
D. Stead, “The Secrets in SEC Filings,” Business Week
(September 1, 2008), p. 12.
M. Vanac, “What’s a Novice Investor to Do?” Des Moines Register (November 30, 1997), p. 3G.
A. R. Sorking, “New Path on Mergers Could Contain Loopholes,” The (Ames, IA) Daily Tribune (January 9, 2001), p. B7;
“Firms Resist Effort to Unveil True Costs of Doing Business,”
USA Today (July 3, 2000), p. 10A.
8. M. S. Fridson, Financial Statement Analysis (New York: John
Wiley & Sons, 1991), pp. 192–194.
9. E. I. Altman, “Predicting Financial Distress of Companies: Revisiting the Z-Score and Zeta Models,” Working paper at http://
pages.stern.nyu.edu/~ealtman/Zscores.pdf (July 2000).
10. D. H. Bangs, Managing by the Numbers (Dover, N.H.: Upstart
Publications, 1992), pp. 106–107.
11. “Economic Focus: A Tale of Two Worlds,” The Economist
(May 10, 2008), p. 88; “Zimbabwe: A Worthless Currency,”
The Economist (July 19, 2008), pp. 56–57.
12. S. M. J. Bonini and J. M. Oppenheim, “Helping ‘Green’ Products Grow,” McKinsey Quarterly (October 2008), pp. 1–8.
APPENDIX
12.A
Resources
for Case Research
Company Information
1. Annual reports
2. Moody’s Manuals on Investment (a listing of companies within certain industries that contains a
brief history and a five-year financial statement of each company)
3. Securities and Exchange Commission Annual Report Form 10-K (annually) and 10-Q (quarterly)
4. Standard & Poor’s Register of Corporations, Directors, and Executives
5. Value Line’s Investment Survey
6. Findex’s Directory of Market Research Reports, Studies and Surveys (a listing by Find/SVP of more
than 11,000 studies conducted by leading research firms)
7. Compustat, Compact Disclosure, CD/International, and Hoover’s Online Corporate Directory
(computerized operating and financial information on thousands of publicly held corporations)
8. Shareholders meeting notices in SEC Form 14-A (proxy notices)
Economic Information
1. Regional statistics and local forecasts from large banks
2. Business Cycle Development (Department of Commerce)
3. Chase Econometric Associates’ publications
4. U.S. Census Bureau publications on population, transportation, and housing
5. Current Business Reports (U.S. Department of Commerce)
6. Economic Indicators (U.S. Joint Economic Committee)
7. Economic Report of the President to Congress
8. Long-Term Economic Growth (U.S. Department of Commerce)
9. Monthly Labor Review (U.S. Department of Labor)
10. Monthly Bulletin of Statistics (United Nations)
11. Statistical Abstract of the United States (U.S. Department of Commerce)
12. Statistical Yearbook (United Nations)
13. Survey of Current Business (U.S. Department of Commerce)
14. U.S. Industrial Outlook (U.S. Department of Defense)
15. World Trade Annual (United Nations)
16. Overseas Business Reports (by country, published by the U.S. Department of Commerce)
Industry Information
1. Analyses of companies and industries by investment brokerage firms
2. Business Week (provides weekly economic and business information, as well as quarterly profit and
sales rankings of corporations)
377
378
PART 5
Introduction to Case Analysis
3. Fortune (each April publishes listings of financial information on corporations within certain
industries)
4. Industry Survey (published quarterly by Standard & Poor’s)
5. Industry Week (late March/early April issue provides information on 14 industry groups)
6. Forbes (mid-January issue provides performance data on firms in various industries)
7. Inc. (May and December issues give information on fast-growing entrepreneurial companies)
Directory and Index Information on Companies and Industries
1. Business Periodical Index (on computers in many libraries)
2. Directory of National Trade Associations
3. Encyclopedia of Associations
4. Funk and Scott’s Index of Corporations and Industries
5. Thomas’ Register of American Manufacturers
6. Wall Street Journal Index
Ratio Analysis Information
1. Almanac of Business and Industrial Financial Ratios (Prentice Hall)
2. Annual Statement Studies (Risk Management Associates; also Robert Morris Associates)
3. Dun’s Review (Dun & Bradstreet; published annually in September–December issues)
4. Industry Norms and Key Business Ratios (Dun & Bradstreet)
Online Information
1. Hoover’s Online—financial statements and profiles of public companies (www.hoovers.com)
2. U.S. Securities and Exchange Commission—official filings of public companies in Edgar database
(www.sec.gov)
3. Fortune 500—statistics for largest U.S. corporations (www.fortune.com)
4. Dun & Bradstreet’s Online—short reports on 10 million public and private U.S. companies
(smallbusiness.dnb.com)
5. Ecola’s 24-Hour Newsstand—links to Web sites of 2,000 newspapers, journals, and magazines
(www.ecola.com)
6. Competitive Intelligence Guide—information on company resources (www.fuld.com)
7. Society of Competitive Intelligence Professionals (www.scip.org)
8. The Economist—provides international information and surveys (www.economist.com)
9. CIA World Fact Book—international information by country ()
10. Bloomberg—information on interest rates, stock prices, currency conversion rates, and other general financial information (www.bloomberg.com)
11. The Scannery—information on international companies (www.thescannery.com)
12. CEOExpress—links to many valuable sources of business information (www.ceoexpress.com)
13. Wall Street Journal—business news (www.wsj.com)
14. Forbes—America’s largest private companies ( />15. CorporateInformation.com—subscription service for company profiles
(www.corporateinformation.com)
16. Kompass International—industry information (www.kompass.com)
17. CorpTech—database of technology companies (www.corptech.com)
18. ADNet—information technology industry (www.companyfinder.com)
19. CNN company research—provides company information ( />
CHAPTER 12
Suggestions for Case Analysis
379
20. Paywatch—database of executive compensation ( />21. Global Edge Global Resources—international resources ( />22. Google Finance—data on North American stocks ( />23. World Federation of Exchanges—international stock exchanges (www.world-exchanges.org/)
24. SEC International Registry—data on international corporations ( />corpfin/internatl/companies.shtml)
25. Yahoo Finance—data on North American companies ()
12.B
APPENDIX
Suggested Case
Analysis
Methodology Using
the Strategic Audit
First Reading of the Case
1. READ CASE
SECTION A
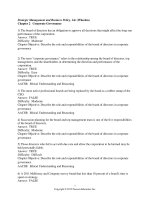
Corporate Governance and Social Responsibility
CASE
1
The Recalcitrant Director
at Byte Products, Inc.:
CORPORATE LEGALITY VERSUS CORPORATE RESPONSIBILITY
Dan R. Dalton, Richard A. Cosier, and Cathy A. Enz
{
Develop a general overview of the company and its external environment.
{
Begin a list of the possible strategic factors facing the company at this time.
{
List the research information you may need on the economy, industry, and competitors.
BYTE PRODUCTS, INC., IS PRIMARILY INVOLVED IN THE PRODUCTION OF ELECTRONIC components
that are used in personal computers. Although such components might be found in a few computers in home use, Byte products are found most frequently in computers used for sophisticated business and engineering applications. Annual sales of these products have been
steadily increasing over the past several years; Byte Products, Inc., currently has total sales
of approximately $265 million.
Over the past six years, increases in yearly revenues have consistently reached 12%.
Byte Products, Inc., headquartered in the midwestern United States, is regarded as one
of the largest-volume suppliers of specialized components and is easily the industry leader,
with some 32% market share. Unfortunately for Byte, many new firms—domestic and foreign—have entered the industry. A dramatic surge in demand, high profitability, and the relative ease of a new firm’s entry into the industry explain in part the increased number of
competing firms.
Although Byte management—and presumably shareholders as well—is very pleased
about the growth of its markets, it faces a major problem: Byte simply cannot meet the demand
for these components. The company currently operates three manufacturing facilities in various locations throughout the United States. Each of these plants operates three production
shifts (24 hours per day), 7 days a week. This activity constitutes virtually all of the company’s
production capacity. Without an additional manufacturing plant, Byte simply cannot increase
its output of components.
This case was prepared by Professors Dan R. Dalton and Richard A. Cosier of the Graduate School of Business at
Indiana University and Cathy A. Enz of Cornell University. The names of the organization, individual, location,
and/or financial information have been disguised to preserve the organization’s desire for anonymity. This case was
edited for SMBP–9th, 10th, 11th, and 12th Editions. Reprint permission is solely granted to the publisher, Prentice
Hall, for the book, Strategic Management and Business Policy – 12th Edition and cases in Strategic Management
and Business Policy, 12th Edition by copyright holders Dan R. Dalton, Richard A. Cosier, and Cathy A. Enz. Any
other publication of this case (translation, any form of electronic or other media), or sold (any form of partnership)
to another publisher will be in violation of copyright laws, unless the copyright holders have granted an additional
written reprint permission.
401
2. READ
THE CASE
WITH THE
STRATEGIC
AUDIT
FIGURE 12–1
Strategic Audit
Worksheet
Second Reading of the Case
{
Read the case a second time, using the strategic audit as a framework for in-depth analysis. (See
Appendix 1.A on pages 34–41.) You may want to make a copy of the strategic audit worksheet
(Figure 12–1) to use to keep track of your comments as you read the case.
{
The questions in the strategic audit parallel the strategic decision-making process shown in
Figure 1–5 (pages 28–29).
{
The audit provides you with a conceptual framework to examine the company’s mission, objectives,
strategies, and policies as well as problems, symptoms, facts, opinions, and issues.
{
Perform a financial analysis of the company, using ratio analysis (see Table 12–1), and do the calculations necessary to convert key parts of the financial statements to a common-size basis.
Analysis
Strategic Audit Heading
I.
(+) Factors
(−) Factors
Comments
Current Situation
A. Past Corporate Performance Indexes
B. Strategic Posture:
Current Mission
Current Objectives
Current Strategies
Current Policies
SWOT Analysis Begins:
II.
Corporate Governance
A. Board of Directors
B. Top Management
III. External Environment (EFAS):
Opportunities and Threats (SWOT)
A. Societal Environment
B. Task Environment (Industry Analysis)
IV.
Internal Environment (IFAS):
Strengths and Weaknesses (SWOT)
A. Corporate Structure
B. Corporate Culture
C. Corporate Resources
1. Marketing
2. Finance
3. Research and Development
4. Operations and Logistics
5. Human Resources
6. Information Systems
V.
Analysis of Strategic Factors (SFAS)
A. Key Internal and External
Strategic Factors (SWOT)
B. Review of Mission and Objectives
SWOT Analysis Ends. Recommendation Begins:
VI. Alternatives and Recommendations
A. Strategic Alternatives—pros and cons
B. Recommended Strategy
VII. Implementation
VIII. Evaluation and Control
NOTE: See the complete Strategic Audit on pages 26–33. It lists the pages in the book that discuss each of the eight
headings.
SOURCE: T. L. Wheelen and J. D. Hunger, “Strategic Audit Worksheet.” Copyright © 1985, 1986, 1987, 1988, 1989,
2005, and 2009 by T. L. Wheelen. Copyright © 1989, 2005, and 2009 by Wheelen and Hunger Associates. Revised
1991, 1994, and 1997. Reprinted by permission. Additional copies available for classroom use in Part D of Case
Instructors Manual and on the Prentice Hall Web site (www.prenhall.com/wheelen).
3. DO OUTSIDE
RESEARCH
380
Library and Online Computer Services
{
Each case has a decision date indicating when the case actually took place. Your research should be
based on the time period for the case.
{
See Appendix 12.A for resources for case research. Your research should include information about
the environment at the time of the case. Find average industry ratios. You may also want to obtain
further information regarding competitors and the company itself (10-K forms and annual reports).
This information should help you conduct an industry analysis. Check with your instructor to see
what kind of outside research is appropriate for your assignment.
{
Don’t try to learn what actually happened to the company discussed in the case. What management
actually decided may not be the best solution. It will certainly bias your analysis and will probably
cause your recommendation to lack proper justification.
CHAPTER 12
TABLE 4–5
1
Weighted
Score
Rating
2
Economic integration of European Community
Demographics favor quality appliances
Economic development of Asia
Opening of Eastern Europe
Trend to “Super Stores”
Threats
{
{
{
{
{
{
{
{
{
Analyze the natural and societal environments to see what general trends are likely to affect the
industry(s) in which the company is operating.
3
{
Conduct an industry analysis using Porter’s competitive forces from Chapter 4. Develop an Industry Matrix (Table 4–4 on page 119).
{
Generate 8 to 10 external factors. These should be the most important opportunities and threats facing the company at the time of the case.
{
Develop an EFAS Table, as shown in Table 4–5 (page 126), for your list of external strategic factors.
{
Suggestion: Rank the 8 to 10 factors from most to least important. Start by grouping the 3 top factors and then the 3 bottom factors.
Comments
4
5
Opportunities
{
{
External Factor Analysis Summary (EFAS Table): Maytag as Example
Weight
Increasing government regulations
Strong U.S. competition
Whirlpool and Electrolux strong globally
New product advances
Japanese appliance companies
Total Scores
.20
.10
.05
.05
.10
4.1
5.0
1.0
2.0
1.8
.82
.50
.05
.10
.18
Acquisition of Hoover
Maytag quality
Low Maytag presence
Will take time
Maytag weak in this channel
.10
.10
.15
.05
.10
4.3
4.0
3.0
1.2
1.6
.43
.40
.45
.06
.16
Well positioned
Well positioned
Hoover weak globally
Questionable
Only Asian presence in
Australia
1.00
3.15
OTES:
1. List opportunities and threats (8–10) in Column 1.
2. Weight each factor from 1.0 (Most Important) to 0.0 (Not Important) in Column 2 based on that factor’s probable impact on the company’s strategic position. The total weights must sum to 1.00.
3. Rate each factor from 5.0 (Outstanding) to 1.0 (Poor) in Column 3 based on the company’s response to that factor.
4. Multiply each factor’s weight times its rating to obtain each factor’s weighted score in Column 4.
5. Use Column 5 (comments) for rationale used for each factor.
6. Add the individual weighted scores to obtain the total weighted score for the company in Column 4. This tells how well the company is
responding to the factors in its external environment.
OURCE: T. L. Wheelen and J. D. Hunger, “External Factors Analysis Summary (EFAS).” Copyright © 1987, 1988, 1989, 1990, 2005 and
07 by T. L. Wheelen. Copyright © 1991, 2003, 2005 and 2009 by Wheelen and Hunger Associates. Reprinted by permission.
TABLE 5–2
Internal Factor Analysis Summary (IFAS Table): Maytag as Example
Internal Factors
Weight
1
Weighted
Score
Rating
2
3
381
External Environmental Analysis: EFAS
4. BEGIN SWOT
ANALYSIS
External Factors
Suggestions for Case Analysis
Comments
4
5
Internal Organizational Analysis: IFAS
Strengths
{
{
{
{
{
Quality Maytag culture
Experienced top management
Vertical integration
Employer relations
Hoover’s international orientation
.15
.05
.10
.05
.15
5.0
4.2
3.9
3.0
2.8
.75
.21
.39
.15
.42
Quality key to success
Know appliances
Dedicated factories
Good, but deteriorating
Hoover name in cleaners
Slow on new products
Superstores replacing small dealers
High debt load
Hoover weak outside the United
Kingdom and Australia
Investing now
{
Generate 8 to 10 internal factors. These should be the most important strengths and weaknesses of
the company at the time of the case.
{
Develop an IFAS Table, as shown in Table 5–2 (page 164), for your list of internal strategic factors.
{
Suggestion: Rank the 8 to 10 factors from most to least important. Start by grouping the 3 top factors and then the 3 bottom factors.
Weaknesses
{
Process-oriented R&D
Distribution channels
Financial position
Global positioning
.05
.05
.15
.20
2.2
2.0
2.0
2.1
.11
.10
.30
.42
{
Manufacturing facilities
.05
4.0
.20
{
{
{
1.00
Total Scores
3.05
NOTES:
1. List strengths and weaknesses (8–10) in Column 1.
2. Weight each factor from 1.0 (Most Important) to 0.0 (Not Important) in Column 2 based on that factor’s probable impact on the company’s
strategic position. The total weights must sum to 1.00.
3. Rate each factor from 5.0 (Outstanding) to 1.0 (Poor) in Column 3 based on the company’s response to that factor.
4. Multiply each factor’s weight times its rating to obtain each factor’s weighted score in Column 4.
5. Use Column 5 (comments) for rationale used for each factor.
6. Add the individual weighted scores to obtain the total weighted score for the company in Column 4. This tells how well the company is
responding to the factors in its internal environment.
SOURCE: T. L. Wheelen and J. D. Hunger, “Internal Factor Analysis Summary (IFAS).” Copyright © 1987, 1988, 1989, 1990, 2005, and 2009
by T. L. Wheelen. Copyright © 1991, 2003, 2005, and 2009 by Wheelen and Hunger Associates. Reprinted by permission.
5. WRITE YOUR
STRATEGIC
AUDIT:
PARTS I TO IV
First Draft of Your Strategic Audit
6. WRITE YOUR
STRATEGIC
AUDIT: PART V
Strategic Factor Analysis Summary: SFAS
FIGURE 6–1
Strategic Factor Analysis Summary (SFAS) Matrix
Internal Strategic Factors
Weight
1
3
.15
.05
.10
.05
.15
Weaknesses
W1 Process-oriented R&D
W2 Distribution channels
W3 Financial position
W4 Global positioning
W5 Manufacturing facilities
Total Scores
Weighted
Score
Rating
2
Strengths
S1 Quality Maytag culture
S2 Experienced top management
S3 Vertical integration
S4 Employee relations
S5 Hoover’s international orientation
.05
.05
2.2
2.0
.15
.20
2.0
2.1
.05
4.0
1
Threats
T1 Increasing government regulations
T2 Strong U.S. competition
T3 Whirlpool and Electrolux strong
globally
T4 New product advances
T5 Japanese appliance companies
Total Scores
Quality key to success
Know appliances
Dedicated factories
Good, but deteriorating
Hoover name in cleaners
.11
.10
Slow on new products
Superstores replacing small
dealers
High debt load
Hoover weak outside the
United Kingdom and
Australia
Investing now
.20
Weighted
Score
Rating
2
3
4
4.1
.82
Acquisition of Hoover
5.0
1.0
2.0
1.8
.50
.05
.10
.18
Maytag quality
Low Maytag presence
Will take time
Maytag weak in this channel
.10
.10
4.3
4.0
.15
.05
.10
3.0
1.2
1.6
1.00
S1 Quality Maytag culture (S)
S5 Hoover’s international
orientation (S)
W3 Financial position (W)
W4 Global positioning (W)
O1 Economic integration of
European Community (O)
O2 Demographics favor quality (O)
O5 Trend to super stores (O + T)
T3 Whirlpool and Electrolux (T)
T5 Japanese appliance
companies (T)
Total Scores
.43
.40
Well positioned
Well positioned
.45
.06
.16
Hoover weak globally
Questionable
Only Asian presence is Australia
3.15
2
3
4 Duration 5
Weight
Rating
Weighted
Score
.10
5.0
.50
.10
.10
.15
2.8
2.0
2.2
.28
.20
.33
.10
.10
.10
.15
4.1
5.0
1.8
3.0
.41
.50
.18
.45
.10
1.6
1.00
Condense the list of factors from the 16 to 20 identified in your EFAS and IFAS Tables to only
the 8 to 10 most important factors.
{
Select the most important EFAS and IFAS factors. Recalculate the weights of each. The weights still
need to add to 1.0.
{
Develop a SFAS Matrix, as shown in Figure 6–1 (page 178), for your final list of strategic factors.
Although the weights (indicating the importance of each factor) will probably change from the
EFAS and IFAS Tables, the numeric rating (1 to 5) of each factor should remain the same. These
ratings are your assessment of management’s performance on each factor.
{
This is a good time to reexamine what you wrote earlier in Parts I to IV. You may want to add to or
delete some of what you wrote. Ensure that each one of the strategic factors you have included in
your SFAS Matrix is discussed in the appropriate place in Parts I to IV. Part V of the audit is not the
place to mention a strategic factor for the first time.
{
Write Part V of your strategic audit. This completes your SWOT analysis.
{
This is the place to suggest a revised mission statement and a better set of objectives for the company. The SWOT analysis coupled with revised mission and objectives for the company set the stage
for the generation of strategic alternatives.
5
.20
.10
.05
.05
.10
1
{
Comments
*The most important external and internal factors are identified in the EFAS and IFAS tables as shown here by shading these factors.
Strategic Factors (Select the most
important opportunities/threats
from EFAS, Table 4–5 and the most
important strengths and weaknesses
from IFAS, Table 5–2)
Write Parts I to IV of the strategic audit. Remember to include the factors from your EFAS and IFAS
Tables in your audit.
3.05
Weight
Opportunities
O1 Economic integration of
European Community
O2 Demographics favor quality
appliances
O3 Economic development of Asia
O4 Opening of Eastern Europe
O5 Trend to “Super Stores”
Review the student-written audit of an old Maytag case in Appendix 12.C for an example.
{
5
.75
.21
.39
.15
.42
.30
.42
1.00
External Strategic Factors
Comments
4
5.0
4.2
3.9
3.0
2.8
{
.16
S
H
O
R
T
I
N
T
E
R
M
E
D
I
A
T
E
X
X
X
X
X
X
6
L
O
N
G Comments
X
Quality key to success
Name recognition
High debt
Only in N.A., U.K., and
Australia
X
Acquisition of Hoover
Maytag quality
Weak in this channel
Dominate industry
X
Asian presence
X
X
X
3.01
Notes:
1. List each of the most important factors developed in your IFAS and EFAS Tables in Column 1.
2. Weight each factor from 1.0 (Most Important) to 0.0 (Not Important) in Column 2 based on that factor’s probable impact on the company’s strategic position. The total weights must sum to 1.00.
3. Rate each factor from 5.0 (Outstanding) to 1.0 (Poor) in Column 3 based on the company’s response to that factor.
4. Multiply each factor’s weight times its rating to obtain each factor’s weighted score in Column 4.
5. For duration in Column 5, check appropriate column (short term—less than 1 year; intermediate—1 to 3 years; long term—over 3 years).
6. Use Column 6 (comments) for rationale used for each factor.
SOURCE: T. L. Wheelen and J. D. Hunger, “Strategic Factors Analysis Summary (SFAS).” Copyright © 1987, 1988, 1989, 1990, 1991, 1992,
1993, 1994, 1995, 1996, 2005, and 2009, by T. L. Wheelen. Copyright © 1997, 2005, and 2009 by Wheelen and Hunger Associates. Reprinted by
permission.
(see Figure 6–2)—where a company is able to satisfy customers’ needs in a way that rivals
cannot, given the context in which it operates.7
Finding such a niche or sweet spot is not always easy. A firm’s management must be always looking for a strategic window—that is, a unique market opportunity that is available
only for a particular time. The first firm through a strategic window can occupy a propitious
niche and discourage competition (if the firm has the required internal strengths). One company that successfully found a propitious niche was Frank J. Zamboni & Company, the manufacturer of the machines that smooth the ice at ice skating rinks. Frank Zamboni invented the
382
PART 5
Introduction to Case Analysis
7. WRITE YOUR
STRATEGIC
AUDIT: PART VI
CHAPTER 7
Strategy Formulation: Corporate Strategy
Strategic Alternatives and Recommendation
A. Alternatives
{
Develop around three mutually exclusive strategic alternatives. If appropriate to the case you are analyzing, you might propose one alternative for growth, one for stability, and one for retrenchment.
Within each corporate strategy, you should probably propose an appropriate business/competitive
strategy. You may also want to include some functional strategies where appropriate.
{
Construct a corporate scenario for each alternative. Use the data from your outside research to project general societal trends (GDP, inflation, and etc.) and industry trends. Use these as the basis of
your assumptions to write pro forma financial statements (particularly income statements) for each
strategic alternative for the next five years.
{
List pros and cons for each alternative based on your scenarios.
207
FIGURE 7–1
GROWTH
Corporate
Directional
Strategies
Concentration
Vertical Growth
Horizontal Growth
Diversification
Concentric
Conglomerate
STABILITY
RETRENCHMENT
Pause/Proceed with Caution
No Change
Profit
Turnaround
Captive Company
Sell-Out/Divestment
Bankruptcy/Liquidation
A corporation’s directional strategy is composed of three general orientations (sometimes called grand strategies):
{
Growth strategies expand the company’s activities.
{
Stability strategies make no change to the company’s current activities.
Retrenchment strategies reduce the company’s level of activities.
{
Having chosen the general orientation (such as growth), a company’s managers can select
from several more specific corporate strategies such as concentration within one product
line/industry or diversification into other products/industries. (See Figure 7–1.) These strategies are useful both to corporations operating in only one industry with one product line and
to those operating in many industries with many product lines.
GROWTH STRATEGIES
By far the most widely pursued corporate directional strategies are those designed to achieve
growth in sales, assets, profits, or some combination. Companies that do business in expanding industries must grow to survive. Continuing growth means increasing sales and a chance
to take advantage of the experience curve to reduce the per-unit cost of products sold, thereby
increasing profits. This cost reduction becomes extremely important if a corporation’s industry is growing quickly or consolidating and if competitors are engaging in price wars in attempts to increase their shares of the market. Firms that have not reached “critical mass” (that
is, gained the necessary economy of large-scale production) face large losses unless they can
find and fill a small, but profitable, niche where higher prices can be offset by special product
or service features. That is why Oracle acquired PeopleSoft, a rival software firm, in 2005. Although still growing, the software industry was maturing around a handful of large firms. According to CEO Larry Ellison, Oracle needed to double or even triple in size by buying smaller
and weaker rivals if it was to compete with SAP and Microsoft.7 Growth is a popular strategy
because larger businesses tend to survive longer than smaller companies due to the greater
availability of financial resources, organizational routines, and external ties.8
A corporation can grow internally by expanding its operations both globally and domestically, or it can grow externally through mergers, acquisitions, and strategic alliances. A
merger is a transaction involving two or more corporations in which stock is exchanged but
in which only one corporation survives. Mergers usually occur between firms of somewhat
similar size and are usually “friendly.” The resulting firm is likely to have a name derived from
its composite firms. One example is the merging of Allied Corporation and Signal Companies
B. Recommendation
8. WRITE YOUR
STRATEGIC
AUDIT: PART VII
TABLE 10–1
{
Specify which one of your alternative strategies you recommend. Justify your choice in terms of
dealing with the strategic factors you listed in Part V of the strategic audit.
{
Develop policies to help implement your strategies.
Implementation
{
Develop programs to implement your recommended strategy.
{
Specify who is to be responsible for implementing each program and how long each program will
take to complete.
{
Refer to the pro forma financial statements you developed earlier for your recommended strategy.
Use common-size historical income statements as the basis for the pro forma statement. Do the
numbers still make sense? If not, this may be a good time to rethink the budget numbers to reflect
your recommended programs.
Example of an Action Plan
Action Plan for Jan Lewis, Advertising Manager, and Rick Carter, Advertising Assistant, Ajax Continental
Program Objective: To Run a New Advertising and Promotion Campaign for the Combined Jones Surplus/Ajax
Continental Retail Stores for the Coming Christmas Season Within a Budget of $XX.
Program Activities:
1. Identify Three Best Ad Agencies for New Campaign.
2. Ask Three Ad Agencies to Submit a Proposal for a New Advertising and Promotion Campaign for Combined Stores.
3. Agencies Present Proposals to Marketing Manager.
4. Select Best Proposal and Inform Agencies of Decision.
5. Agency Presents Winning Proposal to Top Management.
6. Ads Air on TV and Promotions Appear in Stores.
7. Measure Results of Campaign in Terms of Viewer Recall and Increase in Store Sales.
Action Steps
Responsibility
Start–End
1. A. Review previous programs
B. Discuss with boss
C. Decide on three agencies
Lewis & Carter
Lewis & Smith
Lewis
1/1–2/1
2/1–2/3
2/4
2. A. Write specifications for ad
B. Assistant writes ad request
C. Contact ad agencies
D. Send request to three agencies
E. Meet with agency acct. execs
Lewis
Carter
Lewis
Carter
Lewis & Carter
1/15–1/20
1/20–1/30
2/5–2/8
2/10
2/16–2/20
3. A. Agencies work on proposals
B. Agencies present proposals
Acct. Execs
Carter
2/23–5/1
5/1–5/15
4. A. Select best proposal
B. Meet with winning agency
C. Inform losers
Lewis
Lewis
Carter
Acct. Exec
Lewis
5/15–5/20
5/22–5/30
6/1
6/1–7/1
7/1–7/3
5. A. Fine-tune proposal
B. Presentation to management
6. A. Ads air on TV
B. Floor displays in stores
Lewis
Carter
9/1–12/24
8/20–8/30
7. A. Gather recall measures of ads
B. Evaluate sales data
C. Prepare analysis of campaign
Carter
Carter
Carter
9/1–12/24
1/1–1/10
1/10–2/15
9. WRITE YOUR
STRATEGIC
AUDIT: PART VIII
Evaluation and Control
{
Specify the type of evaluation and controls that you need to ensure that your recommendation is carried out successfully. Specify who is responsible for monitoring these controls.
{
Indicate whether sufficient information is available to monitor how the strategy is being implemented. If not, suggest a change to the information system.
5. Take corrective action: If actual results fall outside the desired tolerance range, action
must be taken to correct the deviation. The following questions must be answered:
a. Is the deviation only a chance fluctuation?
b. Are the processes being carried out incorrectly?
c. Are the processes appropriate to the achievement of the desired standard? Action
must be taken that will not only correct the deviation but also prevent its happening again.
d. Who is the best person to take corrective action?
Top management is often better at the first two steps of the control model than it is at
the last two follow-through steps. It tends to establish a control system and then delegate
the implementation to others. This can have unfortunate results. Nucor is unusual in its
ability to deal with the entire evaluation and control process.
11.1
Evaluation and Control in Strategic Management
Evaluation and control information consists of performance data and activity reports (gathered
in Step 3 in Figure 11–1). If undesired performance results because the strategic management
processes were inappropriately used, operational managers must know about it so that they can
correct the employee activity. Top management need not be involved. If, however, undesired
performance results from the processes themselves, top managers, as well as operational managers, must know about it so that they can develop new implementation programs or procedures. Evaluation and control information must be relevant to what is being monitored. One
of the obstacles to effective control is the difficulty in developing appropriate measures of important activities and outputs.
An application of the control process to strategic management is depicted in Figure 11–2.
It provides strategic managers with a series of questions to use in evaluating an implemented
strategy. Such a strategy review is usually initiated when a gap appears between a company’s
financial objectives and the expected results of current activities. After answering the proposed
set of questions, a manager should have a good idea of where the problem originated and what
must be done to correct the situation.
FIGURE 11–1
Evaluation and
Control Process
1
2
Determine
what to
measure.
Establish
predetermined
standards.
3
Measure
performance.
4
Does
No
performance match
standards?
5
Take
corrective
action.
Yes
STOP
10. PROOF AND
FINE-TUNE
YOUR AUDIT
Final Draft of Your Strategic Audit
{
Check to ensure that your audit is within the page limits of your professor. You may need to cut some
parts and expand others.
{
Make sure that your recommendation clearly deals with the strategic factors.
{
Attach your EFAS and IFAS Tables, and SFAS Matrix, plus your ratio analysis and pro forma
statements. Label them as numbered exhibits and refer to each of them within the body of the audit.
{
Proof your work for errors. If on a computer, use a spell checker.
SPECIAL NOTE: Depending on your assignment, it is relatively easy to use the strategic audit you have
just developed to write a written case analysis in essay form or to make an oral presentation. The strategic audit is just a detailed case analysis in an outline form and can be used as the basic framework for
any sort of case analysis and presentation.
APPENDIX
12.C
Example of
Student-Written
Strategic Audit
(For the 1993 Maytag Corporation Case)
I. Current Situation
A. Current Performance
Poor financials, high debt load, first losses since 1920s, price/earnings ratio negative.
{ First loss since 1920s.
{ Laid off 4,500 employees at Magic Chef.
{ Hoover Europe still showing losses.
B. Strategic Posture
1. Mission
{ Developed in 1989 for the Maytag Company: “To provide our customers with products of unsurpassed performance that last longer, need fewer repairs, and are produced at the lowest possible cost.”
{ Updated in 1991: “Our collective mission is world class quality.” Expands Maytag’s
belief in product quality to all aspects of operations.
2. Objectives
{ “To be profitability leader in industry for every product line Maytag manufactures.”
Selected profitability rather than market share.
{ “To be number one in total customer satisfaction.” Doesn’t say how to measure
satisfaction.
{ “To grow the North American appliance business and become the third largest appliance manufacturer (in unit sales) in North America.”
{ To increase profitable market share growth in North American appliance and floor
care business, 6.5% return on sales, 10% return on assets, 20% return on equity, beat
competition in satisfying customers, dealer, builder and endorser, move into third
place in total units shipped per year. Nicely quantified objectives.
3. Strategies
{ Global growth through acquisition, and alliance with Bosch-Siemens.
{ Differentiate brand names for competitive advantage.
{ Create synergy between companies, product improvement, investment in plant and
equipment.
383
384
PART 5
Introduction to Case Analysis
4. Policies
{ Cost reduction is secondary to high quality.
{ Promotion from within.
{ Slow but sure R&D: Maytag slow to respond to changes in market.
II. Strategic Managers
A. Board of Directors
1. Fourteen members—eleven are outsiders.
2. Well-respected Americans, most on board since 1986 or earlier.
3. No international or marketing backgrounds.
4. Time for a change?
B. Top Management
1. Top management promoted from within Maytag Company. Too inbred?
2. Very experienced in the industry.
3. Responsible for current situation.
4. May be too parochial for global industry. May need new blood.
III. External Environment
(EFAS Table; see Exhibit 1)
A. Natural Environment
1. Growing water scarcity
2. Energy availability a growing problem
B. Societal Environment
1. Economic
a. Unstable economy but recession ending, consumer confidence growing—could increase spending for big ticket items like houses, cars, and appliances. (O)
b. Individual economies becoming interconnected into a world economy. (O)
2. Technological
a. Fuzzy logic technology being applied to sense and measure activities. (O)
b. Computers and information technology increasingly important. (O)
3. Political–Legal
a. NAFTA, European Union, other regional trade pacts opening doors to markets in
Europe, Asia, and Latin America that offer enormous potential. (O)
b. Breakdown of communism means less chance of world war. (O)
c. Environmentalism being reflected in laws on pollution and energy usage. (T)
4. Sociocultural
a. Developing nations desire goods seen on TV. (O)
b. Middle-aged baby boomers want attractive, high-quality products, like BMWs and
Maytag. (O)
c. Dual-career couples increases need for labor-saving appliances, second cars, and
day care. (O)
d. Divorce and career mobility means need for more houses and goods to fill them. (O)
CHAPTER 12
Suggestions for Case Analysis
385
C. Task Environment
1. North American market mature and extremely competitive—vigilant consumers demand high quality with low price in safe, environmentally sound products. (T)
2. Industry going global as North American and European firms expand internationally. (T)
3. European design popular and consumer desire for technologically advanced
appliances. (O)
4. Rivalry High. Whirlpool, Electrolux, GE have enormous resources & developing
global presence. (T)
5. Buyers’ Power Low. Technology and materials can be sourced worldwide. (O)
6. Power of Other Stakeholders Medium. Quality, safety, environmental regulations
increasing. (T)
7. Distributors’ Power High. Super retailers more important: mom and pop dealers less. (T)
8. Threat of Substitutes Low. (O)
9. Entry Barriers High. New entrants unlikely except for large international firms. (T)
IV. Internal Environment
(IFAS Table; see Exhibit 2)
A. Corporate Structure
1. Divisional structure: appliance manufacturing and vending machines. Floor care managed separately. (S)
2. Centralized major decisions by Newton corporate staff, with a time line of about three
years. (S)
B. Corporate Culture
1. Quality key ingredient—commitment to quality shared by executives and workers. (S)
2. Much of corporate culture is based on founder F. L. Maytag’s personal philosophy, including concern for quality, employees, local community, innovation, and performance. (S)
3. Acquired companies, except for European, seem to accept dominance of Maytag
culture. (S)
C. Corporate Resources
1. Marketing
a. Maytag brand lonely repairman advertising successful but dated. (W)
b. Efforts focus on distribution—combining three sales forces into two, concentrating
on major retailers. (Cost $95 million for this restructuring.) (S)
c. Hoover’s well-publicized marketing fiasco involving airline tickets. (W)
2. Finance (see Exhibits 4 and 5)
a. Revenues are up slightly, operating income is down significantly. (W)
b. Some key ratios are troubling, such as a 57% debt/asset ratio, 132% long-term
debt/equity ratio. No room for more debt to grow company. (W)
c. Net income is 400% less than 1988, based on common-size income statements. (W)
3. R&D
a. Process-oriented with focus on manufacturing process and durability. (S)
b. Maytag becoming a technology follower, taking too long to get product innovations to
market (competitors put out more in last 6 months than prior 2 years combined), lagging in fuzzy logic and other technological areas. (W)
386
PART 5
Introduction to Case Analysis
4. Operations
a. Maytag’s core competence. Continual improvement process kept it dominant in the
U.S. market for many years. (S)
b. Plants aging and may be losing competitiveness as rivals upgrade facilities. Quality
no longer distinctive competence? (W)
5. Human Resources
a. Traditionally very good relations with unions and employees. (S)
b. Labor relations increasingly strained, with two salary raise delays, and layoffs of
4,500 employees at Magic Chef. (W)
c. Unions express concern at new, more distant tone from Maytag Corporation. (W)
6. Information Systems
a. Not mentioned in case. Hoover fiasco in Europe suggests information systems need
significant upgrading. (W)
b. Critical area where Maytag may be unwilling or unable to commit resources needed
to stay competitive. (W)
V. Analysis of Strategic Factors
A. Situational Analysis (SWOT) (SFAS Matrix; see Exhibit 3)
1. Strengths
a. Quality Maytag culture.
b. Maytag well-known and respected brand.
c. Hoover’s international orientation.
d. Core competencies in process R&D and manufacturing.
2. Weaknesses
a. Lacks financial resources of competitors.
b. Poor global positioning. Hoover weak on European continent.
c. Product R&D and customer service innovation areas of serious weakness.
d. Dependent on small dealers.
e. Marketing needs improvement.
3. Opportunities
a. Economic integration of European Community.
b. Demographics favor quality.
c. Trend to superstores.
4. Threats
a. Trend to superstores.
b. Aggressive rivals—Whirlpool and Electrolux.
c. Japanese appliance companies—new entrants?
B. Review of Current Mission and Objectives
1. Current mission appears appropriate.
2. Some of the objectives are really goals and need to be quantified and given time horizons.
VI. Strategic Alternatives
and Recommended Strategy
A. Strategic Alternatives
1. Growth through Concentric Diversification: Acquire a company in a related industry
such as commercial appliances.
a. [Pros]: Product/market synergy created by acquisition of related company.
b. [Cons]: Maytag does not have the financial resources to play this game.
CHAPTER 12
Suggestions for Case Analysis
387
2. Pause Strategy: Consolidate various acquisitions to find economies and to encourage
innovation among the business units.
a. [Pros]: Maytag needs to get its financial house in order and get administrative control over its recent acquisitions.
b. [Cons]: Unless it can grow through a stronger alliance with Bosch-Siemens or some
other backer, Maytag is a prime candidate for takeover because of its poor financial
performance in recent years, and it is suffering from the initial reduction in efficiency inherent in acquisition strategy.
3. Retrenchment: Sell Hoover’s foreign major home appliance businesses (Australia and
UK) to emphasize increasing market share in North America.
a. [Pros]: Divesting Hoover improves bottom line and enables Maytag Corp. to focus
on North America while Whirlpool, Electrolux, and GE are battling elsewhere.
b. [Cons]: Maytag may be giving up its only opportunity to become a player in the
coming global appliance industry.
B. Recommended Strategy
1. Recommend pause strategy, at least for a year, so Maytag can get a grip on its European
operation and consolidate its companies in a more synergistic way.
2. Maytag quality must be maintained, and continued shortage of operating capital will
take its toll, so investment must be made in R&D.
3. Maytag may be able to make the Hoover UK investment work better since the recession is ending and the EU countries are closer to integrating than ever before.
4. Because it is only an average competitor, Maytag needs the Hoover link to Europe to
provide a jumping off place for negotiations with Bosch-Siemens that could strengthen
their alliance.
VII. Implementation
A. The only way to increase profitability in North America is to further involve Maytag
with the superstore retailers; sure to anger the independent dealers, but necessary for
Maytag to compete.
B. Board members with more global business experience should be recruited, with an eye
toward the future, especially with expertise in Asia and Latin America.
C. R&D needs to be improved, as does marketing, to get new products online quickly.
VIII. Evaluation and Control
A. MIS needs to be developed for speedier evaluation and control. While the question of
control vs. autonomy is “under review,” another Hoover fiasco may be brewing.
B. The acquired companies do not all share the Midwestern work ethic or the Maytag Corporation culture, and Maytag’s managers must inculcate these values into the employees of all acquired companies.
C. Systems should be developed to decide if the size and location of Maytag manufacturing plants is still correct and to plan for the future. Industry analysis indicates that
smaller automated plants may be more efficient now than in the past.