Influential factors on patient satisfaction with public hospitals in Cần Thơ city
Bạn đang xem bản rút gọn của tài liệu. Xem và tải ngay bản đầy đủ của tài liệu tại đây (387.79 KB, 6 trang )
ECONOMIC DEVELOPMENT
No. 208, December 2011
INFLUENTIAL FACTORS ON PATIENT SATISFACTION
WITH PUBLIC HOSPITALS IN CAÀN THÔ CITY
by MEcon. NGUYEÃN QUOÁC NGHI*
This research is intended to identify influential factors on patient satisfaction
with Caàn Thô City-based public hospitals. Through a survey of 425 patients and a
quantitative model for evaluating the patient satisfaction, it pointed out three major
influential factors, namely responsibility, assurance and especially responsiveness. Of
these, responsiveness is the most influential factor.
Keywords: patient, public hospital, satisfaction
1. Introduction
Vietnam’s health care system has achieved
tremendous achievements over the last decade.
The Decrees 10/2002/NÑ-CP and 43/2006/NÑ-CP
specifying financial autonomy for public health
services were introduced in the hope of
increasing efficiency, reducing costs, and
improving profits and responsiveness to local
residents’ medical demands. The implementation
of these decrees has brought positive effects such
as
upgrading
facilities
and
increasing
competitiveness among health service suppliers.
Nevertheless, as the demand for health care is
far greater than the supply of health services,
financial autonomy leads to uneven investment
in facilities among hospitals at provincial and
sub-provincial levels, entailing patient overloads
in upper-level hospitals. In fact, Caàn Thô, the
central city of the Mekong Delta, has up to 19
public hospitals, but patient overloads are
frequent due to patient transfer from hospitals at
sub-provincial levels. Based on aforementioned
56
RESEARCHES & DISCUSSIONS
facts, this research aims at providing scientific
basis for the health care system of the city in
particular and the whole country in general in
order to build plans and action programs for
improving public health care services.
2. Research methods
a. Theoretical basis:
Concerning the satisfaction concept, Bachelet
(1995) considers customer satisfaction as an
emotional response to their experience of a
product or service. According to Zeithaml &
Bitner (2000), customer satisfaction is their
evaluation if a product or service meets their
demands or expectations. Kotler (2001) defines
satisfaction as a personal state derived from the
comparison of an actual product to his
expectations.
Parasuraman, Zeithaml & Berry (1991) think
that there are five influential factors on customer
satisfaction, namely reliability, responsiveness,
assurance, empathy, and tangibles. According to
* Caàn Thô University
ECONOMIC DEVELOPMENT
No. 208, December 2011
WHO (Workbook, 2000), patient satisfaction
assessment is based on the service’s facilities,
attendant help, information sources, staff
competence, service costs, service suitability for
patient needs, service availability, waiting time,
and service effectiveness. From Donabedian’s
viewpoint (1998), patient health care is intended
not only to improve their health, but also to fulfill
their expected needs during the care to satisfy
them. Additionally, Phaïm & Phuøng (2011)
determine five influential factors on patient
satisfaction, which are hospital facilities, staff
professional competence, staff attentiveness,
treatment outcomes and treatment time.
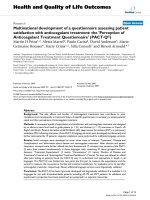
Based on research summaries, expert
consultation and a group discussion (qualitative
research) with 12 patients who used pubic
hospital services, the author identifies 22 criteria
that are considered to have effects on patient
satisfaction with public hospitals in Caàn Thô City
(Figure 1). According to Parasuraman, Zeithaml
& Berry (1985), and Luck & Laton (2000), the
scales of observed variables based on the Likert
five-level scale are selected to suit the EFA.
b. Research model
SAT = f(REL, RES, ASS, EMP, TAN)
where SAT (satisfaction) is a dependent
variable
while
REL
(reliability),
RES
(responsiveness),
ASS
(assurance),
EMP
(empathy), TAN (tangibles) are independent
variables.
The quantification of influential factors on
patient satisfaction is done through three stages.
First, the Cronbach’s Alpha reliability coefficient
is used to see how closely the questions in the
scales correlate. Second, the EFA model is used
to test influential factors and determine the
appropriate ones. Last, the multiple linear
regression model is used to identify influential
factors and the effect of each factor on patient
satisfaction.
3. Research results and discussion
To apply the theoretical model into empirical
study, the author surveyed 425 patients who
used services in Caàn Thô-based public hospitals
including Caàn Thô Central General Hospital
(170 patients), Caàn Thô General Hospital (118
patients), 121 Hospital (137 patients) from
March to April 2011.
Step 1: Tesing the scales
The testing of the reliability (or Cronbach’s
Alpha) of the scale measuring patient satisfaction
with the public hospitals includes 22 variables
belonging to five factors. The Cronbach’s Alpha
coefficient standing at 0.9 (between 0.8 and 1.0)
implies that the scale is appropriate. However,
examining correlation coefficients results in four
variables to be removed from the model because
their values are smaller than 0.3 (Nunnally,
1978; Peterson, 1994; Slater, 1995). They are
ASS4 (sufficient sickbeds), TAN2 (clear bulletin
or instruction boards), TAN3 (well-positioned and
noticeable wards), and TAN4 (hygienic hospital).
The remaining 18 variables are thus employed in
the next EFA.
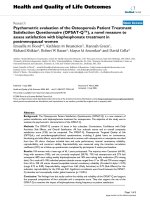
Step 2: Conducting the EFA
The EFA results after two rounds yield the
following tests: (1) the reliability of observed
variables (factor loading coefficient > 0.5); (2) the
suitability of the model (0.5 < KMO = 0.86 < 1);
(3) the Barlett test of the correlation between
observed variables (sig. < 0.05); (4) accumulative
variance = 66.2%.
The above results show that factor F1 consists
of 11 variables that are closely correlated,
namely REL4 (patient health well informed by
doctors), REL5 (serious working behavior of
hospital staff), RES1 (quick handling of
complaints), RES2 (doctors’ promptness to work
on demand), RES4 (staff availability for demand
response),
ASS1
(doctors’
straightforward
responses and counsels), ASS2 (doctors’ trustinspiring behavior), EMP1 (reasonable working
schedule), EMP2 (staff attentiveness to patients),
EMP3 (good patient service), and EMP4 (staff
helpfulness). Factor F1 is characterized by
responsibility and work ethics and therefore
called “Responsibility” (represented by X1 in the
following linear regression model).
Factor F2 is composed of REL1 (experienced
doctors), REL2 (fulfillment of commitments), and
RESEARCHES & DISCUSSIONS
57
ECONOMIC DEVELOPMENT
No. 208, December 2011
2. Responsiveness (RES): 4 variables
- Quick handling of complaints (RES1)
- Doctors’ promptness to work on demand
(RES2)
- Quick procedures for examination and
treatment (RES3)
- Staff availability for demand response (RES4)
3. Assurance (ASS): 4 variables
- Doctors’ straightforward responses and
counsels (ASS1)
- Doctors’ trust-inspiring behavior (ASS2)
- Good waiting benches (ASS3)
- Sufficient sickbeds (ASS4)
1. Reliability (REL1): 5 variables
- Experienced doctors (REL1)
- Fulfillment of commitments (REL2)
- Guarantee of hospital safety/security (REL3)
- Patient health well informed by doctors
(REL4)
- Serious working behavior of hospital staff
(REL5)
Satisfaction (SAT): 3 variables
- Persistent satisfaction provided by hospital
staff (SAT1)
- Quick procedures for examination and
treatment (SAT2)
- Modern and eye-catching tangible facilities
(SAT3)
4. Empathy (EMP): 5 variables
- Reasonable working schedule (EMP1)
- Staff attentiveness to patients (EMP2)
- Good patient service (EMP3)
- Staff helpfulness (EMP4)
- Staff friendliness (EMP5)
5. Tangible facilities (TAN): 4 variables
- Modern equipment and technology (TAN1)
- Clear bulletin or instruction boards (TAN2)
- Well-positioned and noticeable wards
(TAN3)
- Hygienic hospital (TAN4)
Figure 1: Suggested research model
Table 1: Evaluation of scale reliability after omitting variables
Factor
REL1
REL2
REL3
REL4
REL5
RES1
RES2
RES3
RES4
ASS1
ASS2
ASS3
EMP1
EMP2
EMP3
EMP4
EMP5
TAN1
Scale mean if variable to
be deleted
62.3900
62.6600
62.3900
62.8300
62.4500
63.1200
62.6200
63.4400
63.2100
62.9800
62.7000
62.7000
62.2500
63.0400
62.6900
62.6000
62.6200
62.6200
Scale variance
variable to be deleted
115.8767
111.7418
116.8464
107.8395
111.4823
108.7733
112.0764
111.8651
110.6120
107.6562
105.7475
114.5758
114.4722
109.3519
106.1959
106.1212
104.9653
116.7834
Source: Cronbach’s Alpha testing result from survey data (2011)
58
RESEARCHES & DISCUSSIONS
Item – total correlation
coefficient
0.4083
0.6488
0.3380
0.7490
0.6867
0.7199
0.5487
0.4398
0.6379
0.7121
0.8341
0.3770
0.4718
0.7357
0.8030
0.7851
0.7593
0.3430
Cronbach’s Alpha if
variable is deleted
0.9246
0.9196
0.9261
0.9169
0.9189
0.9177
0.9218
0.9255
0.9197
0.9177
0.9146
0.9262
0.9233
0.9175
0.9154
0.9158
0.9163
0.9260
ECONOMIC DEVELOPMENT
No. 208, December 2011
Table 2: Result of factor matrix analysis
Factor
REL1
REL2
REL3
REL4
REL5
RES1
RES2
RES3
RES4
ASS1
ASS2
ASS3
EMP1
EMP2
EMP3
EMP4
EMP5
Factor matrix
1
0.417
0.681
0.357
0.805
0.730
0.789
0.590
0.469
0.691
0.800
0.877
0.403
0.802
0.854
0.840
0.821
0.359
2
0.755
0.483
0.716
-0.055
0.199
-0.176
0.143
0.054
-0.144
-0.347
-0.043
0.110
-0.265
-0.202
-0.201
-0.219
0.371
3
-0.075
-0.272
-0.086
-0.032
-0.168
-0.175
-0.253
0.630
0.250
0.009
-0.037
0.612
-0.053
-0.071
-0.056
-0.031
0.474
Factor
REL1
REL2
REL3
REL4
REL5
RES1
RES2
RES3
RES4
ASS1
ASS2
ASS3
EMP1
EMP2
EMP3
EMP4
EMP5
Rotated component matrix
1
0.065
0.454
0.031
0.740
0.595
0.807
0.514
0.257
0.616
0.850
0.800
0.179
0.830
0.853
0.837
0.822
0.060
2
0.842
0.750
0.789
0.248
0.486
0.175
0.410
0.039
0.049
-0.025
0.286
0.069
0.066
0.146
0.138
0.108
0.325
3
0.188
0.038
0.153
0.208
0.101
0.049
-0.030
0.743
0.421
0.194
0.228
0.716
0.151
0.162
0.171
0.185
0.619
Source: EFA result from survey data (2011)
REL3 (guarantee of hospital safety/security). It
is represented by “Assurance” or X2 in the
following linear regression model. As for factor
F3, it is made up of RES3 (quick procedures for
examination and treatment), ASS3 (good waiting
benches), and TAN1 (modern equipment and
technology). It is called “Responsiveness” or X3 in
the following linear regression model.
The final research model is adjusted as
follows:
f(X1, X2, X3). In the model, SAT is a dependent
variable and is quantified by averaging its
observed variables. The variables X1, X2, X3 are
quantified by averaging their observed variables.
From the regression result, adjusted R2 is
0.60, which means that 60% of the variation in
service quality satisfaction is explained by the
factors in the model, and the rests are unknown
factors. Additionally, Sig.F is 0.000, much
smaller than the 5% significance level. This
implies that the regression model is suitable and
the independent variables have effects on
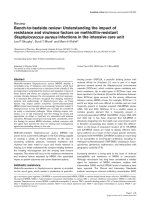
Responsibility (X1)
the dependent variable Y. The DurbinWatson coefficient is 1.98, indicating no
autocorrelation (Troïng & Ngoïc, 2008).
Assurance (X2)
Satisfaction (SAT)
The VIF of the variables is much smaller
than 10, signifying no multicollinearity
(Mai Vaên Nam, 2008).
Responsiveness (X3)
The result also reveals that the three
variables in the model are all statistically
significant (sig. <5%). The following is the
Figure 2: Adjusted research model
regression equation for estimation of influential
Step 3: Linear regression analysis
factors on patient satisfaction with the public
The analysis model for patient satisfaction
hospitals:
with public hospitals in Caàn Thô City is: SAT =
Y = 0,549 + 0,244X1 + 0,171X2 + 0,415X3
RESEARCHES & DISCUSSIONS
59
ECONOMIC DEVELOPMENT
No. 208, December 2011
Table 3: Result of linear regression analysis
Variable
coefficient
Constant
X1: Responsibility
X2: Assurance
X3: Responsiveness
Sig. F
Adjusted R2
Durbin-Watson coefficient
0.549
0.244
0.171
0.415
Beta
coefficient
0.287
0.187
0.468
Sig
VIF
0.033
0.001
0.023
0.000
1.684
1.627
1.400
0.000
0.600
1.980
Source: Regression analysis result from survey data (2011)
According to the regression equation, the
factors X1, X2, X3 are positively correlated to
patient satisfaction with the public hospitals. In
other
words,
the
patient
satisfaction
proportionally correlates with the factors of
responsibility, assurance and responsiveness.
Specifically, if the responsibility factor increases
by one point, then patient satisfaction will
increase by 0.244 point. Likewise, one additional
point in assurance causes a 0.171-point increase
in patient satisfaction, and one additional point
in responsiveness causes a 0.415-point increase
in patient satisfaction.
4. Conclusion and suggestions
Using the quantitative model for estimation of
patient satisfaction with public hospitals in Caàn
Thô City, the research has pointed out three
major factors affecting patient satisfaction,
namely
responsibility,
assurance,
and
responsiveness. Of them, responsiveness is the
most influential factor. The result accords with
reality and a research by Phaïm & Phuøng (2011),
because patients’ primary concerns about hospital
services are helpfulness, dedication and
responsibility of the staff. Research results allow
the author to propose some measures to enhance
patient satisfaction with the public hospitals.
First, it is necessary to enhance the
responsibility of doctors and the responsiveness
of public hospitals to enhance patients’ calmness.
Thanks to this, patient satisfaction will be higher
and service quality will be better.
60
RESEARCHES & DISCUSSIONS
Second, the human element of the supply
side is a crucial condition in services, especially
medical care services that require high quality
human resources. This is why human resources
development in public hospitals plays a central
role in improving service quality and patient
satisfaction.
Third, financial autonomy of public hospitals
is a good way to improve the service quality.
However, loose supervision of “autonomy in
earning and spending” can easily lead to
shortcomings as recently occurred. Hence, a strict
and consistent mechanism for supervision should
be imposed.
Finally, deeper investigation into patient
satisfaction reveals that it is greatly affected by
the disparity between the supply of and demand
for medical care services. In order to enhance the
quality of public medical services, it is essential
to upgrade lower-level hospitals for higher
responsiveness to on-the-spot medical demands
thereby reducing overloads in upper-level
hospitals. Moreover, with high inflation and tight
controls over public expenditure due to limited
budget, it seems that public – private partnership
for higher quality of public medical services is an
effective measure
ECONOMIC DEVELOPMENT
No. 208, December 2011
References
1. Chu Nguyễn Mộng Ngọc & Hoàng Trọng (2008), Phân tích dữ liệu nghiên cứu với SPSS (Research Data Analysis
with SPSS), Thống kê Publisher.
2. Dabholkar, P.A. (1995), “The Convergence of Customer Satisfaction and Service Quality. Evaluations with
Increasing Customer Patronage”, Journal of Customer Satisfaction, Dissatisfaction and Complaining Behavior, Vol. 8: pp.
32-43.
3. Mai Văn Nam (2008), Kinh tế lượng (Econometrics), Văn hóa Thông tin Publisher.
4. Nunnally, J. (1978), Psychometric Theory, McGraw-Hill, New York.
5. Parasuraman, A., V.A. Zeithaml & L.L. Berry (1985), “A Conceptual Model of Service Quality and Its Implications
for Future Research”, Journal of Marketing, Vol. 49: pp. 41-50.
6. Parasuraman, A., V.A. Zeithaml & L.L. Berry (1988), “Servqual: A Multi–Item Scale for Measuring Consumer
Perception of Service Quality”, Journal of Retailing, Vol. 64, No. 1.
7. Parasuraman, A., V.A. Zeithaml & L.L. Berry (1991), “Refinement and Reassessment of Servqual Scale”, Journal
of Retailing, Vol. 67: pp. 420 - 450.
8. Peterson, R. (1994), “A Meta-Analysis of Cronbach’s Coefficient Alpha”, Journal of Consumer Research, No. 21,
Vol. 2.
9. Phạm Xuân Lan & Phùng Thò Hồng Thắm (2011), “Các yếu tố tác động đến sự hài lòng của bệnh nhân ngoại trú
tại các bệnh viện đa khoa Tp. Hồ Chí Minh” (Influential Factors on Outpatient Satisfaction in HCMC General Hospital),
Phát triển Kinh tế, No. 245 – 2011, pp. 52-59.
10. Slater, S. (1995), “Issues in Conducting Marketing Strategy Research”, Journal of Strategic Marketing.
11. WHO (2000), “Client Satisfaction Evaluations”, Workbook 6.
RESEARCHES & DISCUSSIONS
61