Ebook Macroeconomics (3rd edition): Part 2
Bạn đang xem bản rút gọn của tài liệu. Xem và tải ngay bản đầy đủ của tài liệu tại đây (10.81 MB, 334 trang )
Find more at www.downloadslide.com
Lo n g-Ru n Eco n o m i c
G rowth : Sou rces a n d Po l i c i es
C h a pte r Outl i n e a n d
Lea r n i n g Objectives
1 0. 1
Economic Growth over nme ond around Ihe World,
page 304
Define economic growlh, calculate economic
growlh rates, and describe global trends i n
economic growlh.
1 0.2
Whal Delermlnes How Fast Economies Grow?
page 308
Use the econom i c growlh model to explain
why growlh rotes differ across countries.
1 0.3
Economic Growth I n Ihe Unlled Sloles, poge 31 5
Discuss flucluotions i n produclivity growlh in
Ihe United states.
1 0.4
Why Isn'l Ihe Whole World Rich? page 3 1 9
Explain economic catch-up ond discuss why
mony poor countries hove not experienced
rapid economic growlh.
1 0.5
Growth Policies, poge 326
Discuss govemment poli cies that fosler
economic growlh.
Find more at www.downloadslide.com
» Goog le's D i lemma i n China
Google was founded in 1998 b y Larry Page
and Sergey Brin. By 2009, Google employed
more than 20,000 people and had annual rev
enues exceeding $21 billion. But Google
encountered problems when expanding into
China in 2006. The Chinese government has
insisted on regulating how people in that
country access the Internet. In setting up
Google.cn, Google had to agree to block
searches of sensitive topics, such as the 1989
pro-democracy demonstrations in Tiananmen
Square. In 2009, Google ran into further
problems as the Chinese government insisted
that it stop showing some results from foreign
Web sites.
Google's problems highlight one of the
paradoxes of China in recent years: very rapid
economic growth occurring in the context of
government regulations that may ultimately
stifle that growth. From the time the
Communist Party seized control of China in
1 949 until the late 1 970s, the government
controlled production, and the country expe
rienced very little economic growth. China
moved away from a centrally planned economy
in 1978, and real GDP per capita grew at a rate
of 6.5 percent per year between 1 979 and
1995; it grew at the white-hot rate of more
than 9 percent per year between 1996 and
2008. These rapid growth rates have trans
formed the Chinese economy: Real GDP per
capita today is 10 times higher than it was 50
years ago.
But, as the experience of Google has
shown, China is not a democracy, and the
Chinese government has failed to fully estab
lish the rule of law, particularly with respect
to the consistent enforcement of property
rights. This is a problem for the long-term
prospects of the Chinese economy because
without the rule of law, entrepreneurs cannot
fulfill their role in the market system of bring
ing together the factors of production-labor,
capital, and natural resources-to produce
goods and services.
For a discussion of the Chinese govern
ment's attempts to spur economic growth
through higher investment spending, read AN
INSIDE LOOK AT POLICY on page 330.
Sources: Aaron Back and Jessica E. Vasceliaro, ·China Orders
Google to Halt links to Some Foreign Sites,' Wall Stleet Journal,
June
20, 2009.
Econom ics i n YOU R LIFE!
Would You Be Better Off without China?
Suppose that you cou ld choose to l ive and work in a world with the Chinese economy growi ng very
ra p i d ly or in a world with the Chi nese economy as it was before 1 978-very poor a nd g rowi ng
slowly. Which world wo uld you choose to l ive i n ? How does the cu rrent high-growth, hig h-export
Chi nese economy affect you as a co nsumer? How does it affect you as someone a bout to start a
career? As you read the chapter, see if you can answer these q uestions. You can check your answers
agai nst those we provide at the end of the cha pter.
� Continued on page 328
303
304
PA R T 3
I
Find more at www.downloadslide.com
Macroeconomic Foundations and Long-Run Growth
E
conomic growth is not inevitable. For most of human history, no sustained increases
in output per capita occurred, and, in the words of the philosopher Thomas Hobbes,
the lives of most people were "poor, nasty, brutish, and short." Sustained economic
growth first began with the Industrial Revolution in England in the late eighteenth
century. From there, economic growth spread to the United States, Canada, and the countries
of western Europe, Following World War II, rapid economic growth also began in Japan and,
eventually, in several other Asian countries, but the economies of many other countries stag
nated, leaving their people mired in poverty.
Real GDP per capita is the best measure of a country's standard of living because it rep
resents the ability of the average person to buy goods and services. Economic growth occurs
when real GDP per capita increases. Why have countries such as the United States and the
United Kingdom, which had high standards of living at the beginning of the twentieth cen
tury, continued to grow rapidly? Why have countries such as Argentina, which at one time
had relatively high standards of living, failed to keep pace? Why was the Soviet Union unable
to sustain the rapid growth rates of its early years? Why are some countries that were very
poor at the beginning of the twentieth century still very poor today? And why have some
countries, such as South Korea and Japan, that once were very poor now become much
richer? What explains China's very rapid recent growth rates? In this chapter, we will develop
a model of economic growth that helps us answer these important questions,
1 0. 1 LEARNING OBJ ECTIVE
Define economic growth,
calculate economic growth
rates, and describe global
trends In economic growth,
Econom ic Growth over Time
and a round the World
You live i n a world that i s very different fr o m the world when your grandparents were
young, You can listen to music on an iPod that fits in your pocket; your grandparents
played vinyl records on large stereo systems. You can pick up a cell phone or send a text
message to someone in another city, state, or country; your grandparents mailed letters
that took days or weeks to arrive. More importandy, you have access to health care and
medicines that have prolonged life and improved its quality, In many poorer countries,
however, people endure grinding poverty and have only the bare necessities of life, just
as their great-grandparents did,
The difference between you and people in poor countries is that you live in a coun
try that has experienced substantial economic growth. With economic growth, an econ
omy produces both increasing quantities of goods and services and better goods and
services. It is only through economic growth that living standards can increase, but
through most of human history, no economic growth took place. Even today, billions of
people are living in countries where economic growth is extremely slow.
Economic Growth from 1 , 000 , 000 B.C. to the Present
In 1 ,000,000 B.C., our ancestors survived by hunting animals and gathering edible
plants. Farming was many years in the future, and production was limited to food,
clothing, shelter, and simple tools. Bradford DeLong, an economist at the University of
California, Berkeley, estimates that in these primitive circumstances, GDP per capita
was about $ 140 per year in 2008 dollars, which was the minimum amount necessary
just to sustain life. Delong estimates that real GDP per capita worldwide was still $ 140
in the year 1 300 A.D. In other words, no sustained economic growth occurred between
1 ,000,000 B.C. and 1 300 A.D. A peasant toiling on a farm in France in the year 1 300 was
no better off than his ancestors thousands of years before. In fact, for most of human
existence, the typical person had only the bare minimum of food, clothing, and shelter
necessary to sustain life. Few people survived beyond the age of 40, and most people
suffered from debilitating illnesses.
Find more at www.downloadslide.com
C H A P T E R I O I Long-Run Growth: Sources and Policies
Significant economic growth did not begin until the Industrial Revolution, which
started in England around the year 1 750. The production of cotton doth in factories
using machinery powered by steam engines marked the beginning of the Industrial
Revolution. Before that time, production of goods had relied almost exclusively on
human or animal power. The use of mechanical power spread to the production of
many other goods, greatly increasing the quantity of goods each worker could produce.
First England and then other countries, such as the United States, France, and
Germany, experienced long-run economic growth, with sustained increases in real GDP
per capita that eventually raised living standards in these countries to the high levels of
today.
Maki ng
. the
Connect i on
I
305
Industrial Revolution The
application of mechanical power
to the production of goods.
beginning in England around
1750.
Why Did the Industrial Revolution
Beg in in England?
The Industrial Revolution was a key turning point i n human
history. Before the Industrial Revolution, economic growth
was slow and halting. After the Industrial Revolution, in a number of countries eco
nomic growth became rapid and sustained. Although historians and economists agree
on the importance of the Industrial Revolution, they have not reached a consensus on
why it happened where and when it did. Why the eighteenth century and not the six
teenth century or the twenty-first century? Why England and not China or India or
Africa or Japan?
There is always a temptation to read history backward. We know when and where
the Industrial Revolution occurred; therefore, it had to happen where it did and when
it did. But what was so special about England in the eighteenth century? Nobel
Laureate Douglass North, of Washington University in St. Louis, has argued that insti
tutions in England differed significantly from those in other countries in ways that
greatly aided economic growth. North believes that the Glorious Revolution of 1688
was a key turning point. After that date, the British Parliament, rather than the king,
controlled the government. The British court system also became independent of the
king. As a result, the British government was credible when it committed to upholding
private property rights, protecting wealth, and eliminating arbitrary increases in taxes.
These institutional changes gave entrepreneurs the incentive to make the investments
necessary to use the important technological developments of the second half of the
eighteenth century-particularly the spinning jenny and the water frame, which were
used in the production of cotton textiles, and the steam engine, which was used in
mining and in the manufacture of textiles and other products. Without the institu
tional changes, entrepreneurs would have been reluctant to risk their property or their
wealth by starting new businesses.
Although not all economists agree with North's specific argument about the origins
of the Industrial Revolution, we will see that most economists accept the idea that eco
nomic growth is not likely to occur unless a country's government provides the type of
institutional framework North describes.
Sources: Douglass C. North, Understanding the PrQcess ofEconomic Change, Princeton, NJ: Princeton University Press, 2005;
and Douglass C. North and Barry R. Weingast, "'Constitutions and Commitment: The Evolution of Institutions Governing
Public Choice in Seventeenth-Century England," Journal of &Qnomic History, VoL 49, No. 4, December 1989.
YOUR TURN : Test your understanding by doing related problem
1 .3 on page 332 at the end of
this chapter.
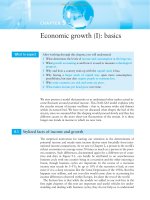
Figure 10-1 shows how growth rates of real GDP per capita for the entire world have
changed over long periods. Prior to 1 300 A.D., there were no sustained increases in real
GDP per capita. Over the next 500 years, to 1 800, there was very slow growth. Significant
growth began in the nineteenth century, as a result of the Industrial Revolution. A fur
ther acceleration in growth occurred during the twentieth century, as the average growth
rate increased from 1.3 percent per year to 2.3 percent per year.
The British government's guarantee
ofproperty rights set the stage for
the Industrial Revolution.
306
PA R T 3
I
Find more at www.downloadslide.com
Macroeconomic Foundations and Long-Run Growth
Figure 1 0- 1
Average Annual Growth Rates
for the World Economy
World economic growth was essentially zero
in the years before 1300. and it was very
slow-an average of only 0.2 percent per
year-before 1800. The Industrial Revolution
made possible the sustained increases in real
GDP per capita that have allowed some coun
tries to attain high standards ofliving.
Source: J. Bradford DeLong, "Estimating World
GOP, One Million B.C.-Prescnt," working papcr,
University of California. Berkeley.
Rates of long· run
growth In real
GOP per capita
2.5%
2.3%
2.0
1 .5
1 .0
0.5
0%
1 million
9.C.-1300
1 300-1800
1 800-1900 1 900-2000
Small Differences in Growth Rates Are Important
The difference between 1.3 percent and 2.3 percent may seem trivial but, over long periods,
small differences in growth rates can have a large impact. For example, suppose you have
$ 1 00 in a savings account earning an interest rate of 1 . 3 percent, which means you will
receive an interest payment of $ 1 .30 this year. If the interest rate on the account is 2.3 per
cent, you will earn $2.30. The difference of an extra $ 1 .00 interest payment seems insignif
icant But if you leave the interest as well as the original $ 1 00 in your account for another
year, the difference becomes greater because now the higher interest rate is applied to a
larger amount-$ 102.30-and the lower interest rate is applied to a smaller amount
$ 1 0 1 .30. This process, known as compounding, magnifies even small differences in interest
rates over long periods of time. Over a period of 50 years, your $100 would grow to $312 at
an interest rate of 2.3 percent but to only $ 1 9 1 at an interest rate of 1.3 percent.
The principle of compounding applies to economic growth rates as well as to inter
est rates. For example, in 1950, real GOP per capita in Argentina was $6,942 (measured
in 2000 dollars) , which was larger than France's real GOP per capita of $5,92 1 . Over the
next 58 years, the economic growth rate in France averaged 2.7 percent per year, while
in Argentina, growth rate was only 1 . 0 percent per year. Although this difference in
growth rates of less than 2 percentage points may seem small, in 2008, real GOP per
capita in France had risen to $27,274, while real GOP per capita in Argentina was only
$ 1 2,994. In other words, because of a relatively small difference in the growth rates of
the two economies, the standard of living of the typical person in France went from
being below that of the typical person in Argentina to being much higher. The impor
tant point to keep in mind is this: In the long run, small differences in economic growth
rates result in big differences in living standards.
Why Do Growth Rates Matter?
Why should anyone care about growth rates? Growth rates matter because an economy
that grows too slowly fails to raise living standards. In some countries in Africa and Asia,
very little economic growth has occurred in the past 50 years, so many people remain in
severe poverty. In high-income countries, only 4 out of every 1 ,000 babies die before the
age of one. In the poorest countries, more than 1 00 out of every 1 ,000 babies die before
the age of one, and millions of children die each year from diseases that could be avoided
by having access to clean water or cured by using medicines that cost only a few dollars.
Although their problems are less dramatic, countries that experience slow growth
have also missed an opportunity to improve the lives of their citizens. For example, the
failure of Argentina to grow as rapidly as the other countries that had similar levels of
GOP per capita in 1950 has left many of its people in poverty. Life expectancy in
Find more at www.downloadslide.com
CHAPTE
I Long-Run Growth: Sources and Policies
R I O
307
Don 't Let This Ha ppen to YO U I
However, this is not the growth rate between the two
years. The growth rate between these two years is the
rate at which $ 1 3 ,225 in 1950 would have to grow on
average each year to end up as $43,714 in 2008, which is
2.1 percent.
Don't Confuse the Average An n u a l
Percentage Change w i t h t h e Total
Percentage Change
When economists talk about growth rates over a period of
more than one year, the numbers are always average annual
percentage changes and not total percentage changes. For
example, in the United States, real GDP per capita was
$ 1 3,225 in 1950 and $43,714 in 2008. The percentage
change in real GDP per capita between these two years is:
( $43,714 - $ 1 3 ,225)
( $ 1 3,225)
X
100
=
YOUR TURN: Test your understanding by doing
related
problem 1 .6 on page 333 at the end of this chapter.
231%.
Argentina is several years lower than in the United States and other high-income coun
tries, and more than twice as many babies in Argentina die before the age of one.
Maki ng
the
Connection
I
The Benefits of an Earlier Start:
Standards of Living in China
and Japan
We noted at the beginning o f this chapter that China has expe
rienced very high growth rates in recent years. Between 1 996 and 2008, real GOP per
capita in China grew at an average annual rate of 8.8 percent. Real GOP per capita in
Japan, in contrast, grew at the much slower rate of 1 . 1 percent. Between 1950 and 1 978,
however, China had grown relatively slowly, while Japan was growing rapidly. As a result,
in 2008, the standard of living in China was still well below that in Japan. For example,
GOP per capita measured in U.S. dollars was $6, 140 in China in 2008 but $34,092more than five times higher-in Japan. The following table shows other measures of the
standard of living for China and Japan.
Lffe expectancy at birth
CHINA
JAPAN
73.5 years
82 . 1 years
Infant mortality (per 1 , 000 live birthsl
20.3
2.8
Percentage of the population surviving on less than $2 per day
35%
0%
Percentage of the population with access to improved water source
77%
100%
Percentage of the population with access to improved sanitation
44%
100%
Internet users per 1 , 000 people
85
668
In each of the measures shown in the preceding table, China continues to lag behind
Japan as well as the United States and other high-income countries. If the Chinese econ
omy can sustain the high growth rates of recent years, it will continue to close the gap
with Japan in real GOP per capita and other measures of the standard of living. The
moral of the story is that only by sustaining high rates of economic growth over many
years will the currently low-income countries be able to attain the high living standards
people in Japan, the United States, and other high-income countries enjoy today.
Sources: United Nations Development Programme. Humnn Development Report, 200712008, New York: Palgrave Macmillan,
2007; Organization for Economic Cooperation and Development; and CIA World Ftlctbook, 2009 online edition.
YOUR TURN : Test your
this chopter.
understanding by doing related problem 1 . 7 on page 333 at the end of
Although China has experienced
rapid economic growth, its living
standards are still well below those
o/Japan.
Find more at www.downloadslide.com
Find more at www.downloadslide.com
C H A P T E R I O I Long-Run Growth: Sources and Policies
How can a country's workers become more productive? Economists believe two key
factors determine labor productivity: the quantity of capital per hour worked and the
level of technology. Therefore, the economic growth model focuses on technological
change and changes over time in the quantity of capital available to workers in explain
ing changes in real GOP per capita. Recall that technological change is a change in the
quantity of output firms can produce using a given quantity of inputs.
There are three main sources of technological change:
Better machinery and equipment. Beginning with the steam engine during the
309
Technological change A change in
the quantity of output a firm can
produce using a given quantity of
inputs.
Industrial Revolution, the invention of new machinery has been an important
source of rising labor productivity. Today, continuing improvements in computers,
factory machine tools, electric generators, and many other machines contribute to
increases in labor productivity.
Increases in human capital. Capital refers to physical capita� induding computers,
factory buildings, machine tools, warehouses, and trucks. The more physical capital
workers have available, the more output they can produce. Human capital is the
accumulated knowledge and skills that workers acquire from education and train
ing or from their life experiences. As workers increase their human capital through
education or on-the-job training, their productivity also increases. The more edu
cated workers are, the greater is their human capital.
Hwnan capital The accumulated
knowledge and skills that workers
acquire from education and training
or from their life experiences.
Better means of organizing and managing production. Labor productivity
increases if managers can do a better job of organizing production. For example, the
just-in-time system, first developed by Toyota Motor Corporation, involves assem
bling goods from parts that arrive at the factory at exactly the time they are needed.
With this system, Toyota needs fewer workers to store and keep track of parts in the
factory, so the quantity of goods produced per hour worked increases.
Note that technological change is not the same thing as more physical capital. New
capital can embody technological change, as when a faster computer chip is embodied
in a new computer. But simply adding more capital that is the same as existing capital is
not technological change. To summarize, we can say that a country's standard of living
will be higher the more capital workers have available on their jobs, the better the capi
tal, the more human capital workers have, and the better job business managers do in
organizing production.
The Per-Worker Production Function
The economic growth model explains increases in real GOP per capita over time as
resulting from increases in just two factors: the quantity of physical capital available to
workers and technological change. Often when analyzing economic growth, we look at
increases in real GOP per hour worked and increases in capital per hour worked. We use
measures of GOP per hour and capital per hour rather than per person so we can ana
lyze changes in the underlying ability of an economy to produce more goods with a given
amount of labor without having to worry about changes in the fraction of the popula
tion working or in the length of the workday. We can illustrate the economic growth
model using the per-worker production function, which is the relationship between real
GOP per hour worked and capital per hour worked, holding the level of technology con
stant. Figure 10-3 shows the per-worker production function as a graph. In the figure, we
measure capital per hour worked along the horizontal axis and real GOP per hour
worked along the vertical axis. Letting K stand for capital, L stand for labor, and Y stand
for real GOP, real GOP per hour worked is YIL, and capital per hour worked is KIL. The
curve represents the production function. Notice that we do not explicitly show techno
logical change in the figure. We assume that as we move along the production function,
the level of technology remains constant. As we will see, we can illustrate technological
change using this graph by shifting up the curve representing the production function.
The figure shows that increases in the quantity of capital per hour worked result in
movements up the per-worker production function, increasing the quantity of output
Per-worker production function
The relationship between real GDP
per hour worked and capital per
hour worked, holding the level of
technology constant.
310
PA R T 3
Find more at www.downloadslide.com
Macroeconomic Foundations and Long-Run Growth
Figure 1 0-3
The Per-Worker Production
Function
The per-worker production function shows
the relationship between capital per hour
worked and real GDP per hour worked.
holding technology constant. Increases in
capital per hour worked increase output per
hour worked but at a diminishing rate. For
example, an increase in capital per hour
worked from $20,000 to $30,000 increases real
GDP per hour worked from $200 to $350. An
increase in capital per hour worked from
$30,000 to $40,000 increases real GDP per
hour worked only from $350 to $475. Each
additional $10,000 increase in capital per hour
worked results in a progressively smaller
increase in output per hour worked.
Real GDP per
hour worked,
YII.
Per-worker
production
function
$575
475
350
200
..... .
:
1
:
I I YI
�
! - ! ------ ! - !
$20.000 30.000 40.000 50.000
capital per hour
worked, KlL
each worker produces. When holding technology constant, however, equal increases in
the amount of capital per hour worked lead to diminishing increases in output per hour
worked. For example, increasing capital per hour worked from $20,000 to $30,000
increases real GOP per hour worked from $200 to $350, an increase of $ 1 50. Another
$ 1 0,000 increase in capital per hour worked, from $30,000 to $40,000, increases real
GOP per hour worked from $350 to $475, an increase of only $ 1 25. Each additional
$ 1 0,000 increase in capital per hour worked results in progressively smaller increases in
real GOP per hour worked. In fact, at very high levels of capital per hour worked, fur
ther increases in capital per hour worked will not result in any increase in real GOP per
hour worked. This effect results from the law ofdiminishing returns, which states that as
we add more of one input-in this case, capital-to a fixed quantity of another input
in this case, labor-output increases by smaller additional amounts.
Why are there diminishing returns to capital? Consider a simple example in which
you own a copy store. At first you have 10 employees but only I copy machine, so each
of your workers is able to produce relatively few copies per day. When you buy a second
copy machine, your employees will be able to produce more copies. Adding additional
copy machines will continue to increase your output-but by increasingly smaller
amounts. For example, adding a twentieth copy machine to the 19 you already have will
not increase the copies each worker is able to make by nearly as much as adding a sec
ond copy machine did. Eventually, adding additional copying machines will not increase
your output at all.
Which Is More Important for Economic Growth:
More Ca pita l or Technological Change?
Technological change helps economies avoid diminishing returns t o capital. Let's con
sider two simple examples of the effects of technological change. First, suppose you have
10 copy machines in your copy store. Each copy machine can produce 10 copies per
minute. You don't believe that adding an eleventh machine identical to the 10 you
already have will significantly increase the number of copies your employees can pro
duce in a day. Then you find out that a new copy machine has become available that
produces 20 copies per minute. If you replace your existing machines with the new
machines, the productivity of your workers will increase. The replacement of existing
capital with more productive capital is an example of technological change.
Or suppose you realize that the layout of your store could be improved. Maybe the
paper for the machines is on shelves at the back of the store, which requires your work
ers to spend time walking back and forth whenever the machines run out of paper. By
Find more at www.downloadslide.com
CHAPTE R
I Long-Run Growlh : Sources ond Policles
1 0
Real GOP per
hour wot1(ed,
YIL
31 1
Fig u re 1 0-4
__-----
�
Production
function4
l-_----- Production
function3
�_---- Production
function 2
$875
775
675
_�_
Production
function1
575
$50,000
Capital per hour
worked, KJL
placing the paper closer to the copy machines, you can improve the productivity of your
workers. Reorganizing how production takes place so as to increase output is also an
example of technological change.
Technological Change: The Key to Susta ining
Economic Growth
Figure 1 0-4 shows the impact of technological change on the per-worker production
function. Technological change shifts up the per-worker production function and allows
an economy to produce more real GOP per hour worked with the same quantity of cap
ital per hour worked. For example, if the current level of technology puts the economy
on Production function I ' then when capital per hour worked is $50,000, real GOP per
hour worked is $575. Technological change that shifts the economy to Production func
tion2 makes it possible to produce $675 in goods and services per hour worked with the
same level of capital per hour worked. Further increases in technology that shift the
economy to higher production functions result in further increases in real GOP per
hour worked. Because of diminishing returns to capital, continuing increases in real
GOP per hour worked can be sustained only if there is technological change. Remember
that a country will experience increases in its standard of living only if it experiences
increases in real GOP per hour worked. Therefore, we can draw the following important
conclusion: In the long run, a country will experience an increasing standard ofliving only
if it experiences continuing technological change.
Maki ng
the
Connection
I
What Explains the Economic Failure
of the Soviet Union?
The economic growth model can help explain one o f the most
striking events of the twentieth century: the economic collapse of
the Soviet Union. The Soviet Union was formed from the old Russian Empire following the
Communist revolution of 1 9 1 7. Under Communism, the Soviet Union was a centrally
planned economy where the government owned nearly every business and made all pro
duction and pricing decisions. In 1960, Nikita Khrushchev, the leader of the Soviet Union,
addressed the United Nations in New York City. He declared to the United States and the
other democracies, "We will bury you. Your grandchildren will live under Communism."
Technological Change
Increases Output per Hour
Worked
Technological change shifts up the production
function and allows more output per hour
worked with the same amount of capital per
hour worked. For example, along Production
function ! with $50,000 in capital per hour
worked, the economy can produce $575 in real
GDP per hour worked. However, an increase in
technology that shifts the economy to
Production function2 makes it possible to
produce $675 in real GDP per hour worked
with the same leve1 of capital per hour worked.
312
PA R T 3
I
Find more at www.downloadslide.com
Macroeconomic Foundations and Long-Run Growth
The fall of the Berlin Wall in
1989 symbolized the failure of
Communism.
Many people at the time took Khrushchev's boast seriously. Capital per hour
worked grew rapidly in the Soviet Union from 1950 through the 1980s. At first, these
increases in capital per hour worked also produced rapid increases in real GDP per hour
worked. Rapid increases in real GDP per hour worked during the 1950s caused some
economists in the United States to predict incorrectly that the Soviet Union would
someday surpass the United States economically. In fact, diminishing returns to capital
meant that the additional factories the Soviet Union was building resulted in smaller
and smaller increases in real GDP per hour worked.
The Soviet Union did experience some technological change---but at a rate much
slower than in the United States and other high-income countries. Why did the Soviet
Union fail the crucial requirement for growth: implementing new technologies? The key
reason is that in a centrally planned economy, the persons in charge of running most
businesses are government employees and not entrepreneurs or independent business
people, as is the case in market economies. Soviet managers had little incentive to adopt
new ways of doing things. Their pay depended on producing the quantity of output
specified in the government's economic plan, not on discovering new, better, and lower
cost ways to produce goods. In addition, these managers did not have to worry about
competition from either domestic or foreign firms.
Entrepreneurs and managers of firms in the United States, by contrast, are under
intense competitive pressure from other firms. They must constantly search for better
ways of producing the goods and services they sell. Developing and using new technolo
gies is an important way to gain a competitive edge and higher profits. The drive for
profit provides an incentive for technological change that centrally planned economies
are unable to duplicate. In market economies, decisions about which investments to
make and which technologies to adopt are made by entrepreneurs and managers who
have their own money on the line. Nothing concentrates the mind like having your own
funds at risk.
In hindsight, it is dear that a centrally planned economy, such as the Soviet Union's,
could not, over the long run, grow faster than a market economy. The Soviet Union col
lapsed in 1 9 9 1 , and contemporary Russia now has a more market-oriented system,
although the government continues to play a much larger role in the economy than
does the government in the United States.
� YOUR TURN: Test your understanding by doing
related problem 2. 1 0 on page 334 at the end of
this cha pter.
Solved Pro b l e m
1 0-2
Using the Economic Growth Model to Analyze
the Failure of the Soviet Union's Economy
Use the economic growth model and the information in the Making the Connection on pages 3 1 1-3 12 to analyze the economic
problems the Soviet Union encountered.
SOLVING TH E PROBLEM :
Step 1 : Review the chapter material. This problem is about using the economic
growth model to explain the failure of the Soviet economy, so you may want
to review the Making the Connection on pages 3 1 1-3 12.
Step 2: Draw a graph like Figure 1 0-3 on page 3 1 0 to illustrate the economic prob
lems of the Soviet Union. For simplicity, we can assume that the Soviet Union
experienced no technological change.
Find more at www.downloadslide.com
C H A P T E R 1 0 I Long-Run Growlh : Sources ond Policles
313
The Soviet Union experienced rapid increases in capital per hour worked
from 1950 through the 1980s, but its failure to implement new technology
meant that output per hour worked grew at a slower and slower rate.
Real GOP per
hour worked,
YIL
2. ... Ied to only
diminishing increases in
output per hour worked.
Real GOP per hour
worked1980
Production
;;; -..-- function
··: • • •• • • • • • •••• • • • • • • • • • •• ••••••• •• • •••• •••• • • • • • • • • • • • • • • • • • •••• • • • • • • • • • • • • =;:;;;;;;;;....
Real GOP per hour I'T�
worked197o
Real GOP per hour I : ········ ···························· ···············,.t,.worked1960
Real GOP per hour I ' ········ · ············,
worked1950
Capital
per hour
worked1 950
Capital
per hour
worked1960
Capital
per hour
worked1970
Capital Capital per hour
per hour
worked, KlL
worked19 0
8
EXTRA CREDIT: The Soviet Union hoped to raise the standard of living of its citizens
above that enjoyed in the United States and other high-income countries. Its strategy
was to make continuous increases in the quantity of capital available to its workers. The
economic growth model helps us understand the flaws in this policy for achieving eco
nomic growth.
YOUR TURN : For more
pracNce. do related problems 2.7 and 2.8 an page 334 at the end of this
��
chapter.
New Growth Theory
The economic growth model we have been using was first developed in the 1 950s by
Nobel Laureate Robert Solow, of MIT. According to this model, productivity growth is
the key factor in explaining long-run growth in real GOP per capita. In recent years,
some economists have become dissatisfied with this model because it does not explain
the factors that determine productivity growth. What has become known as the new
growth theory was developed by Paul Romer, an economist at Stanford University, to
provide a better explanation of the sources of productivity change. Romer argues that
the rate of technological change is influenced by how individuals and firms respond to
economic incentives. Earlier accounts of economic growth left technological change
unexplained or attributed it to factors such as chance scientific discoveries.
Romer argues that the accumulation of knowledge capital is a key determinant of
economic growth. Firms add to an economy's stock of knowledge capital when they
engage in research and development or otherwise contribute to technological change.
We have seen that accumulation of physical capital is subject to diminishing returns:
Increases in capital per hour worked lead to increases in real GOP per hour worked but
at a decreasing rate. Romer argues that the same is true of knowledge capital at the firm
leveL As firms add to their stock of knowledge capital, they increase their output but at
a decreasing rate. At the level of the entire economy rather than just individual firms,
however, Romer argues that knowledge capital is subject to increasing retnms. Increasing
returns can exist because knowledge, once discovered, becomes available to everyone.
The use of physical capital, such as a computer or machine tool, is rival because if one
New growth theory
A model of
long-run economic growth that
emphasizes that technological change
is influenced by economic incentives
and so is determined by the working
of the market system.
314
PA R T 3
I
Find more at www.downloadslide.com
Macroeconomic Foundations a n d Long-Run Growth
firm uses it other firms cannot, and it is excludable because the fum that owns the cap
ital can keep other firms from using it. The use of knowledge capital, such as the chem
ical formula for a drug that cures cancer, is nonrival, however, because one fum's using
that knowledge does not prevent another fum from using it. Knowledge capital is also
nonexcludable because once something like a chemical formula becomes known, it
becomes widely available for other firms to use (unless, as we discuss shordy, the gov
ernment gives the firm that invents a new product the legal right to its exclusive use).
Because knowledge capital is nonrival and nonexcludable, firms can free ride on the
research and development of other firms. Firms free ride when they benefit from the
results of research and development they did not pay for. For example, transistor tech
nology was first developed at Western Electric's Ben Laboratories in the 1 950s and
served as the basic technology of the information revolution. Ben Laboratories, how
ever, received only a tiny fraction of the immense profits that were eventually made by
all the firms that used this technology. Romer points out that firms are unlikely to invest
in research and development up to the point where the marginal cost of the research
equals the marginal return from the knowledge gained because much of the marginal
return will be gained by other fums. Therefore, there is likely to be an inefficiendy small
amount of research and development, slowing the accumulation of knowledge capital
and economic growth.
Government policy can help increase the accumulation of knowledge capital in
three ways:
Protecting intellectual property with patents and copyrights. Governments can
Patent The exclusive right to produce
a product for a period of 20 years
from the date the product is invented.
increase the incentive to engage in research and development by giving firms the
exclusive rights to their discoveries for a period of years. The u.s. government grants
patents to companies that develop new products or new ways of making existing
products. A patent gives a fum the exclusive legal right to a new product for a period
of 20 years from the date the product is invented. For example, a pharmaceutical firm
that develops a drug that cures cancer can secure a patent on the drug, keeping other
firms from manufacturing the drug without permission. The profits earned during
the period the patent is in force provide an incentive for undertaking the research
and development. The patent system has drawbacks, however. In filing for a patent, a
firm must disclose information about the product or process. This information
enters the public record and may help competing firms develop products or
processes that are similar but that do not infringe on the patent. To avoid this prob
lem, a fum may try to keep the results of its research a trade secret, without patenting
it. A famous example of a trade secret is the formula for Coca-Cola. Tension also
arises between the government's objectives of providing patent protection that gives
firms the incentive to engage in research and development and making sure that the
knowledge gained through the research is widely disseminated for the greatest
impact on the economy. Economists debate the features of an ideal patent system.
Just as a new product or a new method of making a product receives patent
protection, books, films, and other artistic works receive copyright protection.
Under U.s. law, the creator of a book, film, or other artistic work has the exclusive
right to use the creation during the creator's lifetime. The creator's heirs retain this
exclusive right for 70 years after the creator's death.
Subsidizing research and development. The government can use subsidies to
increase the quantity of research and development that takes place. In the United
States, the federal government carries out some research direcdy. For example, the
National Institutes of Health conducts medical research. The government also sub
sidizes research by providing grants to researchers in universities through the
National Science Foundation and other agencies. Finally, the government provides
tax benefits to firms that invest in research and development.
Subsidizing education. People with technical training carry out research and devel
opment. If firms are unable to capture all the profits from research and development,
Find more at www.downloadslide.com
C H A P T E R 1 0 I Long-Run Growlh : Sources ond Policles
315
they will pay lower wages and salaries t o technical workers. These lower wages and
salaries reduce the incentive to workers to receive this training. If the government
subsidizes education, it can increase the number of workers who have technical
training. In the United States, the government subsidizes education by directly pro
viding free education from grades kindergarten through 12 and by providing sup
port for public colleges and universities. The government also provides student loans
at reduced interest rates.
These government policies can bring the accumulation of knowledge capital closer
to the optimal level.
Joseph Schumpeter and Creative Destruction
The new growth theory has revived interest in the ideas of Joseph Schumpeter. Born in
Austria in 1 8 83, Schumpeter served briefly as that country's finance minister. In 1 932,
he became an economics professor at Harvard. Schumpeter developed a model of
growth that emphasized his view that new products unleash a "gale of creative destruc
tion" that drives older products-and, often, the firms that produced them-out of the
market. According to Schumpeter, the key to rising living standards is not small changes
to existing products but, rather, new products that meet consumer wants in qualitatively
better ways. For example, in the early twentieth century, the automobile displaced the
horse-drawn carriage by meeting consumer demand for personal transportation in a
way that was qualitatively better. In the early twenty-first century, the OVO and the
OVO player displaced the VHS tape and the VCR by better meeting consumer demand
for watching films at home.
To Schumpeter, the entrepreneur is central to economic growth: "The function of
entrepreneurs is to reform or revolutionize the pattern of production by exploiting an
invention or, more generally, an untried technological possibility for producing new
commodities or producing an old one in a new way."
The profits an entrepreneur hopes to earn provide the incentive for bringing
together the factors of production-labor, capital, and natural resources-to start new
firms and introduce new goods and services. Successful entrepreneurs can use their
profits to finance the development of new products and are better able to attract funds
from investors.
Economic Growth i n the U n ited States
The economic growth model can help us understand the record of growth in the United
States. Figure 10-5 shows average annual growth rates in real GOP per hour worked
since 1800. As the United States experienced the Industrial Revolution during the nine
teenth century, U.S. firms increased the quantities of capital per hour worked. New
technologies such as the steam engine, the railroad, and the telegraph also became avail
able. Together, these factors resulted in an average annual growth rate of real GOP per
worker of 1 . 3 percent from 1800 to 1900. Real GOP per capita grew at the slower rate of
1 . 1 percent during this period. At this growth rate, real GOP per capita would double
about every 63 years, which means that living standards were growing steadily but rela
tively slowly.
By the twentieth century, technological change had been institutionalized. Many
large corporations began to set up research and development facilities to improve the
quality of their products and the efficiency with which they produced them. Universities
also began to conduct research that had business applications. After World War II, many
corporations began to provide significant funds to universities to help pay for research.
In 1950, the federal government created the National Science Foundation, whose main
goal is to support university researchers. The accelerating rate of technological change
led to more rapid growth rates.
1 0.3 LEARNING OBJ ECTIVE
Discuss fluctuations In
productivity growth In
the United States.
316
PA R T 3
Find more at www.downloadslide.com
Macroeconomic Foundations and Long-Run Growth
Figure 1 0-5
Average Annual Growth Rates
In Real GDP per Haur Worked
Growth rate of
real GOP per
hour worked
3.0%
In the UnHed States
The growth rate in the United States increased
from 1800 through the mid-1970s. Then, for
more than 20 years, growth slowed before
increasing again in the mid-1990s.
Note: The values for 1800-1900 are real GDP per
worker. The values for 1900-2008 are real GDP
per hour worked and are the authors' calcula
tions. based on the methods used in Neville
Francis and Valerie A. Ramey, "'The Source of
Historical Economic Fluctuations: An Analysis
Using Long-Run Restrictions," in Jeffrey Frankel,
Richard Clarida, and Francesco Giavazzi, eds.,
International Seminar in Macroeconomics,
Chicago: University of Chicago Press, 2005; the
authors thank Neville Francis for kindly provid
ing data through 2004.
1 800-1 900
1 900-1 949
1 950-1 972
1 973-1 994
1 995�008
Economic Growth in the United States since 1 950
Continuing technological change allowed the u.s. economy to avoid the diminishing
returns to capital that stifled growth in the Soviet economy. In fact, until the 1970s, the
growth rate of the U.S. economy accelerated over time. As Figure 10-5 shows, growth in
the first half of the twentieth century was faster than growth during the nineteenth cen
tury, and growth in the immediate post-World War II period from 1 950 to 1972 was
faster yet. Then the unexpected happened: For more than 20 years, from 1 973 to 1994,
the growth rate of real GOP per hour worked slowed. The growth rate during these
years was more than 1 percentage point per year lower than during the 1950-1972
period. Beginning in the mid - 1 990s, the growth rate picked up again, although it
remained below the levels of the immediate post-World War II period.
What Caused the Productivity Slowdown
of 1 973-1 9941
Several explanations have been offered for the productivity slowdown of the mid- 1970s
to mid- 1990s, but none is completely satisfying. Some economists argue that produc
tivity really didn't slow down, it only appears to have slowed down because of problems
in measuring productivity accurately. After 1970, services---such as haircuts and fman
cial advice---b ecame a larger fraction of GOP, and goods-such as automobiles and
hamburgers---became a smaller fraction. It is more difficult to measure increases in the
output of services than to measure increases in the output of goods. For example,
before banks began using automated teller machines (ATMs) in the 1 980s, you could
withdraw money only by going to a bank before closing time---which was usually 3 :00
P.M. Once ATMs became available, you could withdraw money at any time of the day or
night at a variety of locations. This increased convenience from ATMs does not show
up in GOP. If it did, measured output per hour worked would have grown more rapidly.
There may also be a measurement problem in accounting for improvements in the
environment and in health and safety. Ouring these years, new laws required firms to
spend billions of dollars reducing pollution, improving workplace safety, and redesign
ing products to improve their safety. This spending did not result in additional output
that would be included in GOP-although it may have increased overall well-being. If
these increases in well-being had been included in GOP, measured output per hour
worked would have grown more rapidly.
Find more at www.downloadslide.com
C H A P T E R 1 0 I Long-Run Growlh : Sources ond Policles
I n the early 1 980s, many economists thought the rapid oil price increases that
occurred between 1 974 and 1 979 explained the productivity slowdown, but the produc
tivity slowdown continued after U.S. firms had fully adjusted to high oil prices. In fact,
it continued into the late 1980s and early 1990s, when oil prices declined.
Some economists argue that deterioration in the U.S. educational system may have
contributed to the slowdown in growth from the mid- 1970s to mid- 1 990s. Scores on
some standardized tests began to decline in the 1970s, which may indicate that workers
entering the labor force were less well educated and less productive than in earlier
decades. Another possibility is that the skills required to perform many jobs increased
during the 1970s and 1980s, while the preparation that workers had received in school
did not keep pace.
The United States was not alone in experiencing the slowdown in productivity. All
the high-income countries experienced a growth slowdown between the mid- 1970s and
the mid- 1 990s. Because all the high-income economies began producing more services
and fewer goods and enacted stricter environmental regulations at about the same time,
explanations of the productivity slowdown that emphasize measurement problems
become more plausible. In the end, though, economists have not yet reached a consen
sus on why the productivity slowdown took place.
Has the "New Economy" Increased Productivity?
As Figure 10-5 shows, productivity growth in the United States increased between 1995
and 2008 compared to the previous 20-year period. Some economists argue that the
development of a "new economy" based on information technology caused the higher
productivity growth that began in the mid-1990s. The spread of ever faster and increas
ingly less expensive computers has made communication and data processing easier and
faster than ever before. Today, a single desktop computer has more computing power
than all the mainframe computers NASA used to control the Apollo spacecrafts that
landed on the moon in the late 1960s and early 1970s.
Faster data processing has had a major impact on nearly every firm. Business record
keeping, once done laboriously by hand, is now done more quickly and accurately by
computer. The increase in Internet use during the 1990s brought changes to the ways
firms sell to consumers and to each other. Cell phones, laptop computers, and wireless
Internet access allow people to work away from the office, both at home and while trav
eling. These developments have significantly increased labor productivity.
Many economists are optimistic that the increases in productivity that began in the
mid- 1990s will continue. The use of computers, as well as information and communica
tions technology in general, increases as prices continue to fall. By 2009, well-equipped
desktop computers could be purchased for less than $300. Further innovations in infor
mation and communications technology may continue to contribute to strong produc
tivity growth. Some economists are skeptical, however, about the ability of the economy
to continue to sustain high rates of productivity growth. These economists argue that in
the 1 990s, innovations in information and communications technology-such as the
development of the World Wide Web, Windows 95, and computerized inventory control
systems-raised labor productivity by having a substantial effect on how businesses
operated. By the early 2000s, these economists argue, innovations in information and
communications technology were having a greater impact on consumer products, such
as cell phones, than on labor productivity. If the increases in output per hour worked that
began in the mid- 1990s do continue, this trend will be good news for increases in living
standards in the United States.
Why Has Productivity Growth Been Faster
in the United States than in Other Countries?
One notable aspect of the increase in productivity since the mid- 1990s is that, unlike the
earlier productivity slowdown, it has not been experienced equally by all of the high
income countries. Figure 10-6 shows labor productivity growth during the years from
1995 to 2008 for the high-income countries, known collectively as the Group of Seven,
317
318
PA R T 3
Find more at www.downloadslide.com
Macroeconomic Foundations and Long-Run Growth
Figure 1 0-6
ProducHvIty Growth In the Hlgh
Income Economies, 1 995-2008
Productivity growth as measured by the aver
age annual growth rate of lahor productivity
was more rapid in the United States than in
the other high-income countries during the
years between 1995 and 2008.
Source: Organization for Economic Cooperation
and Development, Economic Outlook, June 2009,
annex table 12.
Labor
productivity
growth
1 .8%
1 .6
1 .4
1 .2
1 .0
0.8
0.6
0.4
0.2
United
States
United
Kingdom
Japan
Canada
France
Germany
Italy
or the G-7 countries. Productivity growth was significantly higher in the United States
than in the other countries, with the exception of the United Kingdom. Japan, France,
Germany, and Italy actually experienced slower productivity growth during these years
than during the years from 1973 to 1994.
Why has productivity growth in the United States been more rapid than in most
other high-income countries? Many economists believe there are two main explana
tions: the greater flexibility of U.S. labor markets and the greater efficiency of the U.S.
fmancial system. U.S. labor markets are more flexible than labor markets in other coun
tries for several reasons. In many European countries, government regulations make it
difficult for firms to fire workers and thereby make firms reluctant to hire workers in the
first place. As a result, many younger workers have difficulty finding jobs, and once a job
is found, a worker tends to remain in it even if his or her skills and preferences are not
a good match for the characteristics of the job. In the United States, by contrast, govern
ment regulations are less restrictive, workers have an easier time finding jobs, and work
ers change jobs fairly frequently. This high rate of job mobility ensures a better match
between workers' skills and preferences and the characteristics of jobs, which increases
labor productivity. Many European countries also have restrictive work rules that limit
the flexibility of firms to implement new technologies. These rules restrict the tasks
firms can ask workers to perform and the number of hours they work. So, the rules
reduce the ability of firms to use new technologies that may require workers to learn
new skills, perform new tasks, or work during the night or early mornings.
Workers in the United States tend to enter the labor force earlier, retire later, and
experience fewer long spells of unemployment than do workers in Europe. As we noted
in Chapter 8, unemployed workers in the United States typically receive smaller govern
ment payments for a shorter period of time than do unemployed workers in Canada and
most of the countries of western Europe. Because the opportunity cost of being unem
ployed is lower in those countries, the unemployment rate tends to be higher, and the
fraction of the labor force that is unemployed for more than one year also tends to be
higher. Studies have shown that workers who are employed for longer periods tend to
have greater skills, greater productivity, and higher wages. Many economists believe that
the design of the U.S. unemployment insurance program has contributed to the greater
flexibility of U.S. labor markets and to higher rates of growth in labor productivity.
As we have seen, technological change is essential for rapid productivity growth. To
obtain the funds needed to implement new technologies, firms turn to the financial sys
tem. It is important that funds for investment be not only available but also allocated
efficiently. We saw in Chapter 5 that large corporations can raise funds by selling stocks
and bonds in financial markets. U.S. corporations benefit from the efficiency of U.S.
Find more at www.downloadslide.com
C H A P T E R 1 0 I Long-Run Growth: Sources ond Policies
319
financial markets. The level o f legal protection of investors i s relatively high i n U.S.
financial markets, which encourages both U.S. and foreign investors to buy stocks and
bonds issued by U.S. firms. The volume of trading in U.S. financial markets also ensures
that investors will be able to quickly sell the stocks and bonds they buy. This liquidity
serves to attract investors to U.S. markets.
Smaller firms that are unable to issue stocks and bonds often obtain funding from
banks. Entrepreneurs founding new ftrms-"start-ups"-particularly firms that are
based on new technologies, generally find that investors are unwilling to buy their stocks
and bonds because the firms lack records of profitability. Banks are also reluctant to lend
to new firms founded to introduce new and unfamiliar technologies. However, some
technology start-ups obtain funds from venture capital firms. Venture capital firms raise
funds from institutional investors, such as pension funds, and from wealthy individuals.
The owners of venture capital firms closely examine the business plans of start-up firms,
looking for those that appear most likely to succeed. In exchange for providing funding,
a venture capital firm often becomes part owner of the start-up and may even play a role
in managing the firm. A successful venture capital firm is able to attract investors who
would not otherwise be willing to provide funds to start-ups because the investors would
lack enough information on the start-up. A number of well-known U.S. high-technology
firms, such as Google, relied on venture capitals firms to fund their early expansion. The
ability of venture capital firms to finance technology-driven start-up firms may be giving
the United States an advantage in bringing new products and new processes to market.
The U.S. financial system suffered from severe problems between 2007 and 2009.
But, over the long run, it has succeeded in efficiently allocating investment funds.
Why Isn't the Whole World Rich?
The economic growth model tells u s that economies grow when the quantity o f capital
per hour worked increases and when technological change takes place. This model seems
to provide a good blueprint for developing countries to become rich: ( i ) Increase the
quantity of capital per hour worked and (2) use the best available technology. There are
economic incentives for both of these things to happen in poor countries. The profitabil
ity of using additional capital or better technology is generally greater in a developing
country than in a high-income country. For example, replacing an existing computer
with a new, faster computer will generally have a relatively small payoff for a firm in the
United States. In contrast, installing a new computer in a Zambian firm where records
have been kept by hand is likely to have an enormous payoff.
This observation leads to the following important conclusion: The economic growth
model predicts that poor countries will grow faster than rich countries. If this prediction is
correct, we should observe poor countries catching up to the rich countries in levels of
GOP per capita (or income per capita). Has this catch-up----or convergence-actually
occurred? Here we come to a paradox: Looking only at the countries that currently have
high incomes, the lower-income countries have been catching up to the higher-income
countries, but the developing countries as a group have not been catching up to the
high-income countries as a group.
Catch-up: Sometimes, but Not Always
We can construct a graph that makes it easier to see whether catch-up is happening. In
Figure 10-7 the horizontal axis shows the initial level of real GOP per capita, and the
vertical axis shows the rate at which real GOP per capita is growing. We can then plot
points on the graph for rich and poor countries. Each point represents the combination
of a country's initial level of real GOP per capita and its growth rate over the following
years. Low-income countries should be in the upper-left part of the graph because they
would have low initial levels of real GOP per capita but fast growth rates. High-income
countries should be in the lower-right part of the graph because they would have high
initial levels of real GOP per capita but slow growth rates.
1 0.4 LEARNING OBJ ECTIVE
Explain economic catch-up
and discuss why many
poor countries have not
experienced rapid economic
growth.
Catch-up The prediction that the
level of GDP per capita (or income
per capita) in poor countries will
grow faster than in rich countries.
PA R T 3
320
Find more at www.downloadslide.com
Macroeconomic Foundations and Long-Run Growth
Figure 1 0-7
The Catch-up Predicted by
the Economic Growth Model
Growth In
real GOP
per capita
According to the economic growth model,
countries that start with lower levels of real
GOP per capita should grow faster (points
near the top of the line) than countries that
start with higher levels of real GOP per capita
(points near the bottom of the line),
Calch-up iine
Richer countries should
grow more slowly and
be on this section of
the line.
In�lal level of
real GOP per capita
Catch-up among the High-Income Countries If we look at only the countries that
currently have high incomes, we can see the catch-up predicted by the economic growth
model. Figure 10-8 shows that the high-income countries that had the lowest incomes in
1960, such as Ireland and Japan, grew the fastest between 1 960 and 2008. Countries that had
the highest incomes in 1 960, such as Switzerland and the United States, grew the slowest.
Are the Developing Countries Catching Up to the High-Income Countries?
If we expand our analysis to include every country for which statistics are available, it
becomes more difficult to find the catch-up predicted by the economic growth model.
Figure 10-9 does not show a consistent relationship between the level of real GDP in
1 960 and growth from 1960 to 2008. Some countries that had low levels of real GDP per
capita in 1 960, such as Niger, Madagascar, and the Democratic Republic of the Congo,
actually experienced negative economic growth: They had lower levels of real GDP per
Figure 1 0-8
There Has Been Colch-up
among High-Income Countries
Looking only at countries that currently have
high incomes, countries such as Ireland and
Japan that had the lowest incomes in 1960
grew the fastest between 1960 and 2008.
Countries such as Switzerland and the United
States that had the highest incomes in 1960
grew the slowest.
Note: Data are real GOP per capita in 2000 dol
lars. Each point in the figure represents one high
income country.
Sources: Authors' calculations from data in Alan
Heston. Robert Summers. and Bettina Aten. Penn
World Table Version 6.2. Center for International
Comparisons of Production. Income and Prices at
the University of Pennsylvania. September 2006;
and International Monetary Fund. World Economic
Outlook Da abase, Apra 2009.
Average annual growth
rate of real GOP per
capital 196()'2008
__ Hong
5%
Kong
t
$2.000
4.000
6.000
8.000
1 0.000
1 2.000 1 4.000 1 6,000
Real GOP per capita in 1960
Find more at www.downloadslide.com
C H A P T E R I O I Long·Run Growth: Sources and Policies
Average annual growth 7%
rate of real GDP per
capita, 1960-2008
..r- Ch;na
•
• V South Korea
•
: . MaJays;a
•
••
• • •
." .
•
..
� ..
. .
•
• •• • • • •
'1
.. .. .. - .
....
.
• ••
��oo
·1
Niger
·2
·3
Fig u re 1 0-9
321
•
4,000
r lsrael
• ' •e\ •
•
.
.
•
... .
\-.! Venezuela
6,000
8,000
Madagascar
� Congo, Oemocratic Republic
10,000
•
•
•
•
1 2,000 1 4,000 1 6,000
Real GOP per capita In 1960
Most of the World Hasn't Been Catchtng Up
Looking at all countries for which statistics are available does not show the catch-up
predicted by the economic growth modeL Some countries that had low levels of real
GDP per capita in 1960, such as Niger, Madagascar, and the Democratic Republic of
the Congo, actually experienced negative economic growth. Other countries that
started with low levels of real GDP per capita. such as Malaysia and South Korea.
grew rapidly. Some middle-income countries in 1960. such as Venezuela. hardly grew
between 1960 and 2008. while others. such as Israel. experienced significant growth.
Note: Data are real GOP per capita in 2000 dollars. Each point in the figure represents one
country.
Sources: Authors' calculations from data in Alan Heston, Robert Summers, and Bettina
Aten. Penn World Table Version 6.2. Center for International Comparisons of Production.
Income and Prices at the University of Pennsylvania, September 2006; and International
Monetary Fund. World Eronomic Outlook Database.April 2009.
capita in 2008 than in 1960. Other countries that started with low levels of real GDP per
capita, such as Malaysia and South Korea, grew rapidly. Some middle-income countries
in 1960, such as Venezuela, hardly grew between 1960 and 2008, while others, such as
Israel, experienced significant growth.
So lved Pro b l e m
1 0-4
The Economic Growth Model's Prediction of Catch-up
The economic growth model makes predictions about the
relationship between an economy's initial level of real GDP
per capita relative to other economies and how fast the
economy will grow in the future.
a. Consider the statistics in the following table.
REAL GOP PER CAPITA
IN 1960 (2000 OOLLARSI
ANNUAL GROWTH IN REAL
GOP PER CAPITA. 1960-2008
Taiwan
$ 1 ,443
6.01%
Tunisia
2,102
3.14
COUNTRY
Brazil
2,643
2.37
Algeria
3,843
1 .05
Venezuela
7,838
0.82
Are these statistics consistent with the economic growth
model? Briefly explain.
b. Now consider the statistics in the following table.
COUNTRY
Japan
Italy
REAL GOP PER CAPITA
IN 1960 (2000 DOlLARS I
ANNUAL GROWTH IN REAL
GOP PER CAPITA, 19611-2008
$4,509
3. 73%
7,167
2.47
Untted Kingdom
10,323
2.14
New Zealand
1 2,063
1 .41
Are these statistics consistent with the economic growth
model? Briefly explain.
c.
Construct a new table that lists all nine countries, from
lowest real GDP per capita in 1960 to highest, along
with their growth rates. Are the statistics in your new
table consistent with the economic growth model?
322
PA R T 3
I
Find more at www.downloadslide.com
Macroeconomic Foundations and Long-Run Growth
SOLVING TH E PROBLEM
Step 1 : Review the chapter material. This problem is about catch-up in the eco
nomic growth model, so you may want to review the section "Why Isn't the
Whole World Rich?" which begins on page 3 19.
Step 2: Explain whether the statistics in the table in part a are consistent with the
economic growth model. These statistics are consistent with the economic
growth model. The countries with the lowest levels of real GDP per capita in
1960 had the fastest growth rates between 1960 and 2008, and the countries
with the highest levels of real GDP per capita had the slowest growth rates.
Step 3: Explain whether the statistics in the table in part b are consistent with the ec0nomic growth model. These statistics are also consistent with the economic
growth model. Once again, the countries with the lowest levels of real GDP per
capita in 1960 had the fastest growth rates between 1960 and 2008, and the coun
tries with the highest levels of real GD P per capita had the slowest growth rates.
Step 4: Construct a table that includes all nine countries from the tables in parts a and
b and discuss the results.
REAL GOP PER CAPITA IN 1960
(2000 OOLLARSI
ANNUAL G ROWTH IN REAL GOP
PER CAPITA. 19611-2008
Taiwan
$ 1 ,443
6.01%
Tunisia
2 , 1 02
3.14
Brazil
2,643
2.37
Algeria
3,843
1 .05
Japan
4,509
3.73
tta�
7,167
2.47
Venezuela
7,838
0.82
Untted Kingdom
1 0,323
2.14
New Zealand
1 2 ,063
1 .41
COUNTRY
The statistics in the new table are not consistent with the predictions of the eco
nomic growth model. For example, New Zealand and the United Kingdom had
higher levels of real GDP per capita in 1960 than did Algeria and Venewela. The
economic growth model predicts that New Zealand and the United Kingdom
should, therefore, have grown more slowly than Algeria and Venezuela. The data
in the table show, however, that New Zealand and the United Kingdom grew
faster. Similarly, Italy grew faster than Brazil, even though its real GDP per capita
was already much higher than Brazil's in 1960.
EXTRA CREDIT: The statistics in these tables confirm what we saw in Figures 10-8 and
10-9 on pages 320-3 2 1 : There has been catch-up among the high-income countries, but
there has not been catch-up if we include in the analysis all the countries of the world.
� YOUR TURN:
For more practice, do problems 4.4 and 4.5 on page 336 at the end of this chapter.
Why Don't More Low-Income Countries Experience
Ra pid Growth?
The economic growth model predicts that the countries that were very poor in 1 960
should have grown rapidly over the next 45 years. As we have just seen, a few did, but
most did not. Why are many low-income countries growing so slowly? There is no sin
gle answer, but most economists point to four key factors:
Failure to enforce the rule of law
Wars and revolutions
Find more at www.downloadslide.com
C H A P T E R I O I Long-Run Growth: Sources ond Policies
323
Poor public education and health
Low rates of saving and investment
Failure to Enforce the Rule ofLaw In the years since 1960, increasing numbers of devel
oping countries, including China, have abandoned centrally planned economies in favor of
more market-oriented economies. For entrepreneurs in a market economy to succeed, how
ever, the government must guarantee private property rights and enforce contracts. Unless
entrepreneurs feel secure in their property, they will not risk starting a business. It is also dif
ficult for businesses to operate successfully in a market economy unless they can use an inde
pendent court system to enforce contracts. The rule of Iaw refers to the ability of a govern
ment to enforce the laws of the country, particularly with respect to protecting private
property and enforcing contracts. The failure of many developing countries to guarantee
private property rights and to enforce contracts has hindered their economic growth.
Consider, for example, the production of shoes in a developing country. Suppose the
owner of a shoe factory signs a contract with a leather tannery to deliver a specific quantity
of leather on a particular date for a particular price. On the basis of this contract, the owner
of the shoe factory signs a contract to deliver a specific quantity of shoes to a shoe whole
saler. This contract specifies the quantity of shoes to be delivered, the quality of the shoes,
the delivery date, and the price. The owner of the leather tannery uses the contract with the
shoe factory to enter into a contract with cattle ranchers for the delivery of hides. The shoe
wholesaler enters into contracts to deliver shoes to retail stores, where they are sold to con
sumers. For the flow of goods from cattle ranchers to shoe customers to operate efficiently,
each business must carry out the terms of the contract it has signed. In developed coun
tries, such as the United States, businesses know that if they fail to carry out a contract, they
may be sued in court and forced to compensate the other party for any economic damages.
Many developing countries do not have functioning, independent court systems. Even if
a court system does exist, a case may not be heard for many years. In some countries, bribery
of judges and political favoritism in court rulings are common. If firms cannot enforce con
tracts through the court system, they will insist on carrying out only face-to-face cash trans
actions. For example, the shoe manufacturer will wait until the leather producer brings the
hides to the factory and will then buy them for cash. The wholesaler will wait until the shoes
have been produced before making plans for sales to retail stores. Production still takes place,
but it is carried out more slowly and inefficiently. With slow and inefficient production, firms
have difficulty finding investors willing to provide them with the funds they need to expand.
Maki ng
•
the
Connect I on
I
What Do Parking Tickets in New York
City Have to Do With Poverty
in the Developing World?
In many developing countries, the breakdown i n the rule of
law can be seen in widespread corruption, with government officials insisting on receiv
ing bribes to process most transactions. Not surprisingly, by and large, the more corrupt
a country's government, the lower the country's growth rate. Economists at the World
Bank have developed an index that ranks the countries of the world from most corrupt
to least corrupt. The figure at the top of the next page compares GDP per capita in the
20 most corrupt and the 20 least corrupt countries. GDP per capita is more than 1 0
times higher i n the least corrupt countries than i n the most corrupt countries.
But does corruption cause countries to be poor, or does a country's being poor lead
to its being corrupt? Some economists have made the controversial argument that cor
ruption may be the result of culture. If a culture of corruption exists in a country, then
the country may have great difficulty establishing an honest government that is willing
to enforce the rule of law. Economists Raymond Fisman of the Columbia Business
School and Edward Miguel of the University of California, Berkeley, came up with an
ingenious method of testing whether a culture of corruption exists in some countries.
Every country in the world sends delegates to the United Nations in New York City.
Under international law, these delegates cannot be prosecuted for violating U.S. laws,
Property rights The rights
individuals or firms have to the
exclusive use of their property,
including the right to buy or sell it.
Rule of law The ability of a
government to enforce the laws
of the country, particularly with
respect to protecting private
property and enforcing contracts.
324
PA R T 3
I
Find more at www.downloadslide.com
Macroeconomic Foundations and Long-Run Growth
GDP $45,000
per capita
40,000
35,000
30,000
25,000
20,000
1 5,000
1 0,000
5,000
Least corrupt
countries
Most corrupt
countries
including parking regulations. So, a delegate to the United Nations can double park or
park next to a fire hydrant and ignore any parking ticket he or she would receive.
Fisman and Miguel argue that if a culture of corruption exists in some countries,
the delegates from these countries would be more likely to ignore parking tickets than
would the delegates from countries without a culture of corruption. Fisman and Miguel
gathered statistics on the number of parking violations per delegate and compared the
statistics to the World Bank's index of corruption. They found that as the level of cor
ruption in a country increases, so does the number of parking violations by the coun
try's United Nations delegates. For example, the figure below shows that the 15 percent
of countries that are most corrupt had more than 10 times as many parking violations
as the 15 percent of countries that are least corrupt.
Number of 25
parking tickets
per delegate
20
15
10
Least corrupt
oountries
Most corrupt
countries
Of course, ignoring parking regulations is a relatively minor form of corruption.
But if Fisman and Miguel are correct, and a culture of corruption has taken hold in
some developing countries, then it may be a difficult task to reform their governments
enough to establish the rule of law.
Sources: Raymond Fisman and Edward Miguel, Economic Gangsters. Princeton, NT: Princeton University Press, 2009,
Chapter 4; Daniel Kaufmann. Aart Kraay, and Massimo Mastruzzi, Governance MntttTS V: Aggregate Governnnce Indicators,
19�2007, World Bank working paper; and International Monetary Fund, World Economic Outlook Database. April 2009.
� YOUR TURN: Test your understanding by doing
related problem 4.7 on page 336 at the end of
this cha pter.
Wars and Revolutions Many of the countries that were very poor in 1960 have expe
rienced extended periods of war or violent changes of government during the years
since. These wars have made it impossible for countries such as Afghanistan, Angola,
Ethiopia, the Central African Republic, and the Congo to accumulate capital or adopt
new technologies. In fact, conducting any kind of business has been very difficult. The
Find more at www.downloadslide.com
C H A P T E R I O I Long-Run Growth: Sources and Policies
325
positive effect on growth of ending war was shown in Mozambique, which suffered
through almost two decades of civil war and declining real GDP per capita. With the end
of civil war, Mozambique experienced a strong annual growth rate of 5.0 percent in real
GDP per capita from 1 990 to 2008.
Poor Public Education and Health We have seen that human capital is one of the
determinants of labor productivity. Many low-income countries have weak public
school systems, so many workers are unable to read and write. Few workers acquire the
skills necessary to use the latest technology.
Many low-income countries suffer from diseases that are either nonexistent or
treated readily in high-income countries. For example, few people in developed coun
tries suffer from malaria, but more than I million Africans die from it each year.
Treatments for AIDS have greatly reduced deaths from this disease in the United States
and Europe. But millions of people in low-income countries continue to die from AIDS.
Low-income countries often lack the resources, and their governments are often too
ineffective, to provide even routine medical care, such as childhood vaccinations.
People who are sick work less and are less productive when they do work. Poor
nutrition or exposure to certain diseases in childhood can leave people permanently
weakened and can affect their intelligence as adults. Poor health has a significant nega
tive impact on the human capital of workers in developing countries.
Low Rates of Saving and Investment To invest in factories, machinery, and com
puters, firms need funds. Some of the funds can come from the owners of the firm and
from their friends and families, but as we noted in Chapter 9, firms in high-income
countries raise most of their funds from bank loans and selling stocks and bonds in
financial markets. In most developing countries, stock and bond markets do not exist,
and often the banking system is very weak. In high-income countries, the funds that
banks lend to businesses come from the savings of households. In high-income coun
tries, many households are able to save a significant fraction of their income. In develop
ing countries, many households barely survive on their incomes and, therefore, have lit
tle or no savings.
The low savings rates in developing countries can contribute to a vicious cycle of
poverty. Because households have low incomes, they save very little. Because households
save very little, few funds are available for firms to borrow. Lacking funds, firms do not
invest in the new factories, machinery, and equipment needed for economic growth.
Because the economy does not grow, household incomes remain low, as do their sav
ings, and so on.
The Benefits of Globalization
One way for a developing country to break out of the vicious cycle of low saving and
investment and low growth is through foreign investment. Foreign direct investment
(FDI) occurs when corporations build or purchase facilities in foreign countries.
Foreign portfolio investment occurs when an individual or a firm buys stocks or bonds
issued in another country. Foreign direct investment and foreign portfolio investment
can give a low-income country access to funds and technology that otherwise would not
be available. Until recently, many developing countries were reluctant to take advantage
of this opportunity.
From the 1940s through the 1970s, many developing countries sealed themselves off
from the global economy. They did this for several reasons. During the 1930s and early
1940s, the global trading and financial system collapsed as a result of the Great Depression
and World War II. Developing countries that relied on exporting to the high-income
countries were hurt economically. Also, many countries in Africa and Asia achieved inde
pendence from the colonial powers of Europe during the 1950s and 1960s and were afraid
of being dominated by them economically. As a result, many developing countries
imposed high tariffS on foreign imports and strongly discouraged or even prohibited for
eign investment. This made it difficult to break out of the vicious cycle of poverty.
Foreign direct investment (FDIl The
purchase or building by a corporation
of a facility in a foreign country.
Foreign portfolio investment The
purchase by an individual or a firm
of stocks or bonds issued in another
country.
326
PA R T 3
Find more at www.downloadslide.com
Macroeconomic Foundations and Long-Run Growth
Figure 1 0- 1 0
Globalization and Growth
Developing countries that were more open to
foreign trade and investment grew much
faster during the 19905 than developing coun
tries that were less open.
Source: David Dollar. "'Globalization. Inequality,
and Poverty since 1980." World Bank Research
Observer. Vol. 20. No. 2. Fall 2005. pp. 145-175.
Average annual growth
rate of real GOP per
capita, 1990-1999
6%
More globalized countries
Less globalized countries
-2
Globalization The process of
countries becoming more open
to foreign trade and investment.
1 0.5 LEARNING OBJ ECTIVE
Discuss government policies
that foster economic growth,
The policies of high tariff barriers and avoiding foreign investment failed to pro
duce much growth, so by the 1980s, many developing countries began to change poli
cies, The result was globalization, which refers to the process of countries becoming
more open to foreign trade and investment,
If we measure globalization by the fraction of a country's GDP accounted for by
exports, we see that globalization and growth are strongly positively associated.
Figure 1 0- 1 0 shows that developing countries that were more globalized grew faster
during the 1 990s than developing countries that were less globalized. Globalization
has benefited developing countries by making it easier for them to get investment
funds and technology.
Growth Policies
What can governments do to promote long-run economic growth? We have seen that
even small differences in growth rates compounded over the years can lead to major dif
ferences in standards of living. Therefore, there is potentially a very high payoff to gov
ernment policies that increase growth rates. We have already discussed some of these
policies in this chapter. In this section, we explore additional policies.
Enhancing Property Rights and the Ru le of Law
A market system cannot work well unless property rights are enforced. Entrepreneurs
are unlikely to risk their own funds, and investors are unlikely to lend their funds to
entrepreneurs, unless property is safe from being arbitrarily seized. We have seen that in
many developing countries, the rule of law and property rights are undermined by gov
ernment corruption. In some developing countries, it is impossible for an entrepreneur
to obtain a permit to start a business without paying bribes, often to several different
government officials. Is it possible for a country to reform a corrupt government
bureaucracy?
Although today the United States ranks among the least corrupt countries, recent
research by economists Edward Glaeser and Claudia Goldin of Harvard University has
shown that in the late nineteenth and early twentieth centuries, corruption was a signif
icant problem in the United States. The fact that political reform movements and cru
sading newspapers helped to reduce corruption in the United States to relatively low
levels by the 1920s provides some hope for reform movements that aim to reduce cor
ruption in developing countries today.