Multi-criteria methods for ranking project activities
Bạn đang xem bản rút gọn của tài liệu. Xem và tải ngay bản đầy đủ của tài liệu tại đây (462.61 KB, 19 trang )
Yugoslav Journal of Operations Research
26 (2016), Number 2, 201-219
DOI: 10.2298/YJOR140618012H
MULTI-CRITERIA METHODS FOR RANKING PROJECT
ACTIVITIES
Yossi HADAD
SCE — Shamoon College of Engineering,Beer-Sheva, Israel
Baruch KEREN
SCE — Shamoon College of Engineering, Beer-Sheva, Israel
Zohar LASLO
SCE — Shamoon College of Engineering, Beer-Sheva, Israel
Received: June 2014 / Accepted: March 2015
Abstract: This paper presents multi-criteria methods (based on the Analytical
Hierarchical Process (AHP), and Data Envelopment Analysis (DEA) used on the
common ranking indexes) for ranking project activities according to several ranking
indexes, and reviews ranking indexes of project activities for project management tasks.
Ranking of project activities in one project is applicable for focusing the attention of the
project manager on important activities. Selection of the appropriate ranking indexes
should be done in accordance with managerial purposes: 1) Paying attention to activities
throughout the execution phase and those in the resources allocation process in order to
meet pre-determined qualities, and to deliver the project on time and within budget, i.e.,
to accomplish the project within the "iron triangle" 2) Setting priorities in order to share
the managerial care and control among the activities. The paper proposes the use of
multi-criteria ranking methods to rank the activities in the case where several ranking
indexes are selected.
Keywords: Project Management (PM), Ranking Indexes (RI), Multi-Criteria Ranking Method
(MCRM), Analytical Hierarchical Process (AHP), Data Envelopment Analysis (DEA).
MSC: 90B50, 65C05.
202
Y.Hadad, B.Keren, Z.Laslo/ Multi-Criteria Methods
1. INTRODUCTION
A project is a complicated task that requires coordinated efforts to achieve a set of
goals. These goals typically include complying with pre-determined parameters,
delivering the project on time and within the budget and the required quality standards.
These three requirements are known in project management as the "iron triangle". Other
goals can include executing the project according to the policy of the organization, and
minimizing interruptions to other activities. In [24], a formulation which reflects a
triangular trade-off structure between the project objectives of time, budget, and quality
is developed. The major challenge for the project manager is to carry out a balanced
distribution of managerial efforts between various project tasks, activities, and objectives
[20], [34].
The project program should be prepared initially, taking into consideration the set of
project activities with their precedence priorities, as well as possible execution modes of
each activity [30]. The planning of the project includes an optimization allocation of
budgeting for the activities of the project, i.e., minimization of the total budget subject to
on time accomplishment of the project. Such optimizations of multi-mode optimization
problems are performed via the Critical Path Method (CPM), a time-cost tradeoffs
procedure [22],[23], when the deterministic duration of all project activities is
considered. In the case of a project with stochastic durations, a semi-stochastic time-cost
tradeoffs procedure [17] or a stochastic time-cost procedure [32] should be performed.
Recently, many heuristics for multi-mode resource-constrained scheduling optimization
problems have been tested on sets of benchmark instances, sourced from the PSPLIB
library [27], [28]. However, uncertainty throughout the lifecycles of the project is
invariably disabled following the initial timetable. Thus, best practice requires a dynamic
scheduling routine in cases of resource shortages during project execution decisions, and
these should be reconsidered and taken via dispatching. When decision-making is based
on the deterministic activities durations, the minimum slack dispatching rule was found
very effective for the reestablishment of the time targets of the project [8]. Considering
the uncertain durations of project activities, [30] introduced for this purpose a heuristic
pair wise dispatching that raises the probability confidence of accomplishing the project
on time. Dynamic scheduling determines which project activities are in process at each
point during the execution of the project.
When several activities are processed simultaneously, it is important to rank the
activities according to their relative importance in keeping project performances within
the “iron triangle”. Such ranking enables the project manager to focus his or her
managerial efforts and control on the most important activities. The ability to do that
increases the probability of project success. This paper reviews several ranking indexes
that help rank project activities, which are in process, by their importance as the aid for
attaining project targets. By selecting an appropriate ranking index, a project manager
can rank all these activities. If the project manager prefers to use several ranking indexes,
he or she must set relative weights for each selected index. The most important activities
would be directly managed by the project manager. The project manager will directly
manage 20% of the activities that have effect of about 80%on the project success. This is
similar to the Pareto principle which suggests that approximately 80% of all possible
effects are generated by approximately 20% of all related causes.
Y.Hadad, B.Keren, Z.Laslo/ Multi-Criteria Methods
203
The values of the relative weights can be determined by subjective methods such as:
Analytical Hierarchical Process (AHP) [38], ELimination and Choice Expressing REality
(ELECTRE) [36], [37]; Simple Multi-Attribute Technique (SMART) ([11], [12]), or
objectively, by the decision makers. The values of the relative weights can be determined
by objective methods via Data Envelopment Analysis (DEA) [3], such as the Super
Efficiency [2]; Canonical Correlation Analysis [14]; Global Efficiency (GE) method
[15]; Cross Efficiency method [39]. For reviews about the ranking methods via DEA, see
[1], [19].
Ranking of the project activities can be done for two distinct goals. The first goal is to
set priorities for performing the activities and for resources allocation in order to meet the
due date. The second goal is to set priorities in order to share managerial care and control
among activities. Ranking indexes that are important for meeting the due date in a
stochastic case are the Significance Index (SI) in[43]; Activity Criticality Index (ACI) in
[41][35]; Cruciality Index (CRI), [42], [13]; time–cost tradeoffs under uncertainty [32]
and others. In a deterministic case, the minimum slack (the difference between the latest
and earliest start time of the activity) is useful. These indexes are presented in the next
section. Ranking indexes that are useful for sharing managerial care and control are
related to the cost, duration, and risk of an activity. Several indexes of this type are also
presented in the next section.
Furthermore, the importance of the activities is dynamic and can be changed during
project execution. Therefore, at every major milestone, the project manager must
recalculate the ranking indexes, taking into account the current status of the project. In
other words, when several activities have been completed, the ranking of the
uncompleted activities should be carried out again. Milestones are events in a project that
divide the project into stages for the purposes of monitoring and measuring of work
performance. These events typically indicate completion of a major deliverable of a
project.
2. RANKING INDEXES FOR PROJECT ACTIVITIES
The Critical Path Method (CPM) was developed in the 1950s. It represents a project
as an activity network, shown as a graph that consists of a set of nodes
N 1, 2, . . . , n and a set of arcs A { i, j | i, j N} . The nodes represent project
activities, where the arcs that connect the nodes represent precedence relationships. Each
activity j has either a deterministic activity duration, or a stochastic duration, denoted
by t j . Each activity can start after all of its predecessors have been completed. CPM uses
an early-start schedule in which activities are scheduled to start as soon as possible.
However, most projects are not deterministic because they are subject to risk and
uncertainties due to external factors, technical complexity, shifting objectives and scope,
and poor management. In practice, project risk management includes the process of risk
identification, analysis, and handling [18].Ranking indexes allow project activities (or
risks) to be ranked, based on the impact they have on project objectives. A distinction
needs to be made between activity-based ranking indices (those that rank activities) and
risk-driven ranking indices (those that rank risks) [5], [6], [7]. Because different ranking
indices result in different rankings of activities and risks, one might wonder which
ranking index is better to use. This paper proposes a method to weight several ranking
Y.Hadad, B.Keren, Z.Laslo/ Multi-Criteria Methods
204
indexes in order to rank the project activities according to their importance instead of
using only one ranking index.
This section presents the ranking indexes that will be used for calculating the scores of
each project activity. The first indexes are related to the duration of the project and to the
duration of the risks (2.2); the rest are related to cost and managerial care.
2.1. Notations
This subsection presents the notations that are used for determined the ranking
indexes.
(ti ) - The expected duration of activity i i 1, 2,..., n .
(ti ) - The standard deviation of the duration of activity i i 1, 2,..., n .
(ci ) -The expected cost of activity i i 1, 2,..., n .
(ci ) - The standard deviation of the cost of activity i i 1, 2,..., n .
tik - The duration of activity i i 1, 2,..., n in simulation runs k k 1, 2,..., K .
cik - The cost of activity i i 1, 2,..., n in simulation runs k k 1, 2,..., K .
2.2.Ranking indexes for duration of an activity
In this subsection the ranking indexes for the duration of an activity are presented. For
a more detailed discussion on the ranking indices presented below, refer to [13];[9].
2.2.1. Rank Positional Weight (RPW)
[20]suggested the use of the Rank Positional Weight (RPW) index that was developed
by [21] for a ranking index for the duration of activity. The RPW of an activity is the sum
of the duration of all activities, following the activity in the precedence network,
including the duration of the activity itself. The RPW is calculated by:
RPW
1
RPW 1 RPW 2 ... RPW K
K
(1)
where
RPW k -The RPW index of simulation runs k k 1, 2,..., K is computed by the equation
RPW k A t k . In this equation, A is the (n n) fixed precedence matrix with
1 if i j or i j
otherwise
0
elements: ai , j
Y.Hadad, B.Keren, Z.Laslo/ Multi-Criteria Methods
205
2.2.2. Significance Index (SI)
The Significance Index (SI) was developed by [42]. In order to better reflect the
relative importance between project activities, the sensitivity index of activity i has been
formulated as follows:
Tmax
t ik
1 K
SI i
k
k
K k 1 t i TFi T
(2)
The SI is usually estimated by simulation methods [42], and is calculated by:
SI i
T k
t ik
1 K
k
k
K k 1 t i TFi T
(3)
where
tik - duration of activity i i 1, 2,..., n in simulation runs k k 1, 2,..., K .
TFi k - total float of an activity i i 1, 2,..., n in simulation runs k k 1, 2,..., K . (Refer
to [9] for a definition of total float).
T - total project duration (a random variable).
T k - total project duration in simulation runs k k 1, 2,..., K .
T - average project duration over K simulations.
2.2.3. Coefficient of Variation (CV) for activity duration
The Coefficient of Variation (CV) is often used as a risk measure for time and cost
[33]. [44]claimed that the CV can be used as a reasonable measure of cost variation and
as a complement to sensitivity measures. [25], [26], [27] used the CV for project
evaluation and selection. The coefficient of variation for the duration of activity i is
computed by:
1 K k
t t
ˆ (ti ) K 1 k 1 i i
CV (ti )
=
ti
ti
1
2
2
(4)
2.2.4. Activity Criticality Index (ACI)
A common practice in project risk management is to focus mitigation efforts on the
critical activities of the deterministic early-start schedule [16]. One index that enables
Y.Hadad, B.Keren, Z.Laslo/ Multi-Criteria Methods
206
determination of the critical activities is the Activity Criticality Index (ACI). The ACI
was developed by [41] and later by [35]. The ACI index of activity i is computed by:
1 K k
i ,
K k 1
1 if i is critical in simulation run k
where ik
otherwise
0
ACI i
(5)
For more details about the activity criticality index see [5].
2.2.5. Cruciality Index (CRI)
The Cruciality Index (CRI) was developed by [42] and [13]. This index is defined as
the absolute value of the correlation between activity duration and total project duration.
The CRI of activity i is computed by:
CRIi corr tik , T k
(5a)
[4]suggested calculating the CRI according to Spearman's rank correlation. This
measure is computed as follows:
CRIi 1
K
6
k
k
Rank(ti ) Rank(T )
2
K ( K 1) k 1
2
(5b)
2.2.6. Schedule Sensitivity Index (SSI)
Cho and Yom [4]proposed their Uncertainty Importance Measure (UIM) to measure
the impact of the variability in activity durations on the variability of the project
completion time. The UIM is evaluated as follows:
UMI i
Var (ti )
Var (T )
(6a)
The PMI Body of Knowledge [40] and [42] defined the Schedule Sensitivity Index
(SSI) ranking index, which combines the ACI and the variance of ti (duration of activity
i ) and T (total project duration). The SSI is computed as follows:
SSI i ACI i
Var (ti )
Var (T )
(6b)
Y.Hadad, B.Keren, Z.Laslo/ Multi-Criteria Methods
207
2.2.7. Critical Delay Contribution (CDC)
The Critical Delay Contribution (CDC) was developed by [7]. The CDC redistributes
the project delay over the combinations of activities and risks that cause the delay. The
term CDCi,e represents the proportion of the project delay that originates from the
E
impact of a risk e : e E on an activity i ,and is computed as follows:
m T T
1 k1 i ,e, k i , k k
E
CDCi ,e
K
E
K
mi ,e, k i, k
K
E
E
(7)
iN eE k 1
where mi ,e, k is the random variable of the risk impact of a risk e on the duration of an
activity j in simulation k . i, k equals 1 if j is critical in simulation k ,and 0 if j is not
critical.
E
2.3. Ranking indexes for cost
In this subsection the ranking indexes for the cost of an activity are presented. For
more details see [20].
2.3.1. Expenditure Rate (ER)
The Expenditure Rate (ER) was used by [20] as a ranking index for project activities.
The ER of activity i , ERi , is calculated by:
ERi
1
K
K
ck
i
k
k 1 t
(8)
i
where cik is the cost of activity i in simulation run k .
2.3.2. Coefficient of Variation (CV) for activity cost
The Coefficient of Variation (CV) is often used as a risk measure for cost [33].The
CV for the cost of activity i is computed by:
1 K k
c ci
ˆ (ci ) K 1 k 1 i
CV (ci )
=
ci
ci
1
2
2
(9)
Y.Hadad, B.Keren, Z.Laslo/ Multi-Criteria Methods
208
3. RANKING METHODS
This section presents three common ranking methods that enable determination of the
relative weights of the ranking indexes that were selected by the decision makers for
ranking project activities: the Analytical Hierarchical Process (AHP); The Data
Envelopment Analysis (DEA), and the Global Efficiency (GE) method via DEA. The
advantage of the AHP as a multi-criteria ranking method is that it generates common
weights identical for all the activities. On the other hand, the AHP is useful only when
the decision makers can subjectively determine the relative importance of several ranking
indexes. The DEA method does not need any subjective evaluations because the weights
are calculated by mathematical methods. The disadvantage of the DEA is that it does not
generate common weights and the weights vary among the activities.
3.1. Analytical Hierarchical Process
The Analytical Hierarchical Process (AHP) methodology developed by Saaty[38]is
used to quantify the value of qualitative or subjective criteria. AHP has been widely used
in real-life applications (see surveys in [20]). In our case, each project activity is
evaluated according to several indexes. The output of AHP produces relative weights of
each selected ranking index. These weights allow full ranking of all project activities.
The input of the AHP is a pairwise comparison matrix for every pair of ranking indexes
selected for ranking by the decision makers. A common scale of values for pairwise
comparison ranges is from 1 (indifference) to 9 (extreme preference). The pairwise
comparison matrix A ai , j
has an element ai , j 1
, ai,i 1 and each element
a j ,i
S S
,
in the matrix is strictly positive - ai, j 0, i 1, 2,...,S, j 1, 2,...,S . For S-ranking
indexes, the number of comparisons to be carried out is S S 1 /2 . According to Saaty's
definition, the eigenvector W , of the maximal eigenvalue max , of each pairwise
comparison matrix, is utilized for ranking the activities. For more detail about AHP
methodology see [38]. AHP has been widely used in real-life applications (see a survey
in [19]). In [38], a statistical measure to test the consistency of the respondent is defined.
The statistical measure of the consistency index ( CI ) is:
CI
max S
S 1
,
and the Consistency Ratio (CR) is given by:
CI
CR 100% ,
RI
where:
max - is the maximal eigenvalue of the matrix,
S - is the number of rows and columns of the matrix,
Y.Hadad, B.Keren, Z.Laslo/ Multi-Criteria Methods
209
RI - is the random index, which is the average of the CI for a large number of randomly
generated matrices. The values of RI can be found in the table developed by[38].
The consistency of the decision makers can be checked by the value of CR .
Generally, if the CR is 10% or less, the respondent is considered consistent and
acceptable, and the computed comparison matrix can be used [38]. If the CR is greater
than 10%, the respondent is not consistent and his or her pairwise estimations must be
corrected.
3.2. Data envelopment analysis
In our case,the ranking indexes are complex and it is not always easy for the decision
makers to perform a pairwise comparison. In situations like ours, where the decision
makers cannot perform pairwise comparison between the indexes, the AHP pairwise
matrix cannot be generated. We therefore proposed the use of the DEA methodology
developed by [3]to determine the relative weights of the ranking indexes. DEA finds
different weights for each activity, such that any activity obtains the optimal weights that
maximize its score. In DEA, the weights vary from activity to activity.
DEA methodology uses inputs and outputs to calculate relative efficiency. In our
case, we use a special form of DEA with only outputs (the ranking indexes). Adjustment
of the DEA model is done according to the following steps:
Step 1: Normalize the values of the selected ranking indexes. This is done by dividing the
values of each index by its maximum value. For example, if the value of the type r
ranking index for activity i is Vr ,i , the normalized value is calculated as follows:
Yr ,i
Vr ,i
max Vr ,i
.
i
Step 2: Solve the linear programming formulation (10) for each activity.
S
Max Ei U ri Yr ,i
r 1
Subject To
S
i
U r Yr ,i 1 i 1, 2..., n
(10)
r 1
U ri 0 r 1, 2,..., S
Step 3: The average of the optimal weights for the type r ranking index (as obtained for
all the activities by formulation (10)) is the common weight of the type r ranking index.
The common weights for all the selected ranking indexes are calculated as follows:
Y.Hadad, B.Keren, Z.Laslo/ Multi-Criteria Methods
210
n
Wr
Ur
i
i 1
n
r 1, 2,..., S
(11)
Step 4: The ranking score of each activity is calculated as follows:
S
Si Wr Yr ,i
r 1
i 1, 2,..., n
(12)
3.3. Global Efficiency
In [15], the Global Efficiency (GE) method to find the best common weights is
proposed. Their method was to maximize the sum of scores of all the activities. In other
words, if the optimal efficiency score Ei* , based on the optimal common weights, is
S
Ei* U r* Yr , j , these common weights will be obtained by linear programming, as in
r 1
the following DEA-like formulation:
n
n
S
MaxZ E j U r Yr ,i
i 1
i 1 r 1
Subject To
S
U r Yr ,i 1 i 1, 2..., n
r 1
(13)
S
Ur 1
r 1
U r 0 r 1, 2,..., S
One drawback of the GE method is that it commonly provides a solution such that all
the weights (excluding one) receive a value of the lower bound U r , and one weight
receives a value of 1 S .
4. A PROCEDURE FOR RANKING PROJECT ACTIVITIES
In order to rank project activities according to their importance, the following
procedure is proposed:
Step 1: Plan the project and collect data: Build the CPM network and set milestones.
Determine duration, and budget for each activity. Estimate the excepted values and the
variances for each activity.
Y.Hadad, B.Keren, Z.Laslo/ Multi-Criteria Methods
211
Step 2: Determine managerial objectives (such as meeting due dates or sharing
managerial care and control) and select the appropriate ranking indexes that would
support these objectives.
Step 3: Simulate the project and obtain the needed values for calculation of the selected
ranking indexes (durations, costs, variances, criticality, and so on). Calculate the values
of the indexes for each activity.
Step 4: If only one ranking index is selected, all the activity should be ranked according
to the value of this index (step 5). If several ranking indexes are selected, a multi-criteria
ranking method must be selected (such as AHP, DEA, GE). The weights of the indexes
must be determined and the weighted score of each project activity must be calculated.
Step 5:Rank uncompleted activities of the project in descending order according to their
scores. For example, one rank could be for supporting the objective of meeting the due
date and another rank could be for sharing managerial care and control.
This procedure must be performed at each milestone for the uncompleted activities.
5. THE CASE STUDY
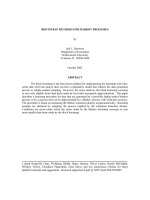
An Activity-on-Node (AON) project network with 17 activities is presented to
illustrate the applicability of the proposed activity ranking method (Figure 1). For each
network activity, i A1, A2,..., A17 , the expected value and the standard deviation of its
duration ( ti and ti ), and the expected value and the standard deviation of its cost
( Ci and Ci ), were determined.
A8
A1
A5
A9
A13
A2
S
A16
A6
A10
A14
A3
E
A17
A7
A11
A15
A4
A12
Figure 1: A project network
The ranking indexes were dividedinto two groups: 1) Indexes related to the durations.
2) Indexes related to the costs. In this case study, the following indexes related to
durations were selected: ACI, CRI, CV (t ) ,SI and RPW. The following indexes, related to
Y.Hadad, B.Keren, Z.Laslo/ Multi-Criteria Methods
212
cost were selected: Cost (shown as C in Table 2), CV for activity cost and ER. For any
pair of indexes, the decision maker set the following AHP pairwise matrixes (Table 1 and
Table 2).
Table 1: Pairwise matrix for the duration indexes
ACI
CRI
CV (t )
SI
RPW
ACI
1
3
7
1
3
CRI
1/3
1
3
1/3
1
CV (t )
1/7
1/3
1
1/7
1/3
SI
1
3
7
1
1
PRW
1/3
1
3
1
1
The maximum eigenvalue of the matrix in Table 1 is max 5.1372, and the
consistency measure of the respondent is:
max n
5.1372 5
0.0343
n 1
5 1
CI
0.0343
CR 100%
100% 3.06% 10%
RI
1.12
CI
Hence, the respondent can be considered consistent, and the comparison pairwise
matrix can be used. The weight of each index is calculated by the following normalized
eigenvector:
N1T 0.3628, 0.1269, 0.0464, 0.2983, 0.1656
Table 2:Pairwise matrix for the cost indexes
C
C
CV (C )
ER
1
3
5
CV (C )
1/3
1
3
ER
1/5
1/3
1
The maximum eigenvalue of the matrix in Table 2 is max 3.0385, and the
consistency measure of the respondent is:
Y.Hadad, B.Keren, Z.Laslo/ Multi-Criteria Methods
max n
213
3.0385 3
0.0193
3 1
CI
0.0193
CR 100%
100% 3.32% 10%
RI
0.58
CI
n 1
Hence, the respondent can be considered consistent, and the comparison matrix can
be used. The weight of each index is calculated by the following normalized eigenvector:
N1T 0.6370,0.2583,0.1047
The following milestones were set:
1.
At the beginning of the project.
2.
After the completion of the activities A1,A2,A3,A4 .
3.
After the completion of the activities A5,A6,A7 .
4.
After the completion of the activities A8,A9,A10,A11, A12 .
5.
After the completion of the activities A13,A14,A15 .
6.
After the completion of the activities A16,A17 , at the end of the project.
Table 3 presents the expected values and the standard deviations for the durations and
costs of each project activity, i A1,A2,...,A17 . Moreover, Table 3 includes the same
parameters as obtained by 100 simulation runs, assuming that the durations and costs
come from normal distribution.
Y.Hadad, B.Keren, Z.Laslo/ Multi-Criteria Methods
214
Table 3: Data for the case study project
Values of the parameters
Duration
i
t
i
The simulation results
Cost
t
i
Duration
Cost
m
i
m
i
ti
ˆt ,i
Ci
ˆC ,i
months
months
$
$
months
months
$
$
A1
7.12
1.38
7,125
658
7.0406
1.4263
7,078
671
A2
3.28
0.58
2,446
179
3.4181
0.5675
2,439
165
A3
6.91
1.47
5,199
413
6.9646
1.5465
5,184
413
A4
2.15
0.37
958
109
2.1909
0.3376
965
112
A5
3.05
0.43
1,357
187
3.0509
0.3921
1,334
180
A6
4.13
0.99
3,249
127
4.1107
1.0426
3,254
127
A7
1.81
0.15
1,151
184
1.8055
0.1348
1,133
182
A8
3.33
0.74
1,304
191
3.2778
0.7294
1,326
194
A9
4.78
1.13
4,218
139
4.6056
1.1562
4,196
145
A10
1.36
0.21
1,021
114
1.3667
0.1967
1,020
110
A11
8.16
0.39
7,134
617
8.1971
0.3796
7,119
624
A12
7.12
1.04
5,836
481
7.1251
1.1061
5,843
394
A13
1.17
0.09
1,215
97
1.1872
0.0855
1,230
88
A14
3.91
0.13
6,082
108
3.8991
0.1193
6,096
111
A15
6.48
1.08
5,473
279
6.4024
1.0888
5,469
302
A16
4.36
0.73
3,875
402
4.2918
0.6163
3,823
430
A17
3.81
0.47
4,316
87
3.7851
0.4678
4,323
84
Table 4 presents the values of the ranking indexes as obtained after 100 simulation runs
using equations (1-9).
Y.Hadad, B.Keren, Z.Laslo/ Multi-Criteria Methods
215
Table 4: Values of the ranking indexes (via 100 simulation runs)
Duration
i
RPWi
SIi
CV (ti )
Cost
ACIi
CRIi
CV (ci )
ERi
A1
35.2793
0.6489
0.2171
0.0300
0.1653
0.0905
1,052.93
A2
38.6545
0.7918
0.1805
0.3900
0.1645
0.0712
767.30
A3
29.0082
0.9256
0.2081
0.5800
0.7002
0.0790
773.96
A4
3.9117
0.2846
0.1784
0.0000
0.1635
0.1048
480.22
A5
23.9741
0.4792
0.1209
0.0300
0.1256
0.1262
446.65
A6
21.4226
0.8015
0.2615
0.3900
0.2808
0.0377
887.82
A7
21.9300
0.8366
0.0752
0.5800
0.2659
0.1487
665.75
A8
8.6830
0.3244
0.2106
0.0000
0.0602
0.1333
413.15
A9
10.2098
0.4779
0.2327
0.0100
0.0047
0.0339
937.29
A10
11.6491
0.2864
0.1515
0.0200
0.0122
0.1069
787.21
A11
20.1344
0.9409
0.0439
0.5800
0.0684
0.0751
879.26
A12
17.4226
0.8702
0.1530
0.3900
0.3912
0.0847
846.80
A13
5.4284
0.2016
0.0679
0.0100
0.0609
0.0747
1,064.44
A14
11.9892
0.8979
0.0364
0.5800
0.1961
0.0174
1,554.85
A15
10.3159
0.8710
0.1514
0.4100
0.3519
0.0572
863.14
A16
4.2673
0.8802
0.1644
0.4500
0.3597
0.0968
910.26
A17
3.8087
0.9176
0.1225
0.5500
0.3432
0.0204
1,151.72
One can see that according to all seven criteria, not one of the activities can be
defined as the most important (Table 4).All values of the indexes in Table 4 were
normalized by dividing each value by the maximum value in its column. The scores of
each activity according to the duration indexes were then weighted by AHP weights.
Table 5 indicates that activity A3 has the highest score (0.9443). This means that A3
requires special care. An example for such special care is that it would be directly
managed by the project manager. Similarly, the scores of each activity according to the
cost indexes were weighted by AHP weights. Table 5 also indicates that activity A1 has
the highest score (0.8614) with respect to the cost.
216
Y.Hadad, B.Keren, Z.Laslo/ Multi-Criteria Methods
Table 5: The weighted scores of the ranking criteria for each activity
Duration
Cost
scores
scores
A1
0.4441
0.8614
A2
0.7224
0.3936
A3
0.9443
0.6532
A4
0.1683
0.3007
A5
0.3176
0.3687
A6
0.6871
0.4164
A7
0.7835
0.4045
A8
0.1883
0.3780
A9
0.2436
0.4975
A10
0.1823
0.3300
A11
0.7675
0.8267
A12
0.6925
0.7270
A13
0.1165
0.3115
A14
0.7408
0.6804
A15
0.6674
0.6468
A16
0.6731
0.5715
A17
0.7351
0.4998
When the project begins (after the first milestone), activities A1,A2,A3,A4 are
executed in parallel. The aim of the project manager is to rank these four activities in
order to share managerial efforts among them. According to duration, the order of ranks
is A3,A2,A1,A4 According to cost, the rank is A1,A3,A2,A4 . To prevent ambiguity
between ranks, the project manager can set weights for the two dimensions, duration and
cost. For example, by setting a weight of 60% for the duration, and 40% for the cost, the
combined rank is A3,A1,A2,A4 . At the second milestone (after the completion of
A1,A2,A3,A4 ), the same procedure is performed, taking into account that A1,A2,A3,A4
were completed and their duration and cost are now known values. In general, this should
be done at every milestone because some of the index values can be changed with the
progress of the project.
If the decision maker cannot perform pairwise comparisons between the indexes,
DEA methodology can be used. The DEA weights (see section 3.2) for the five duration
ranking indexes are presented in Table 6. These weights are different from the weights
that were obtained by AHP methodology.
Y.Hadad, B.Keren, Z.Laslo/ Multi-Criteria Methods
217
Table 6: The relative weights via DEA
RPWi
SIi
CV (ti )
ACIi
CRIi
0.1670
0.2448
0.3370
0.1755
0.0757
6. CONCLUSION
This paper proposes a method for ranking project activities where each activity is
evaluated by several indexes. The proposed model allows ranking of the activities
according to several indexes, without demanding the project manager to select only one
index. Thus, a project activity ranking, based on several indexes, may provide more
accurate evaluation with respect to the correct rank of project activities. The method is
especially useful for projects with many activities. In such projects, the project manager
is unable to share equally his efforts and managerial attention to all project activities.
The paper also reviews ranking indexes of project activities for project management
tasks. The ranking indexes can be used for focusing the attention of the project manager
on important activities and to correctly focus his or her managerial efforts, seeking
control among the activities. The ranking of project activities is useful for two distinct
goals: 1) Prioritizing activities in execution and in allocation of resources in order to meet
due dates. 2) Setting priorities in order to share managerial care and control among the
activities. The paper proposes the use of multi-criteria ranking methods in order to rank
the activities in the case where several ranking indexes are selected.
Acknowledgement: The authors would like to express gratitude for the contribution of
the YUJOR referees to the quality of this paper and for their constructive and helpful
comments to the paper.
REFERENCES
[1] Adler, N., Friedman, L. and Sinuany-Stern, Z., "Review of ranking methods in the DEA
context", European Journal of Operational Research, 140 (2) (2002)249–265.
[2] Anderson, P., and Peterson, N.C.,"A procedure for ranking efficient units in
DEA",Management Science, 39(10) (1993) 1261–1264.
[3] Charnes, A., Cooper, W.W., and Rhodes, E.,"Measuring the efficiency of decision making
units", European Journal of Operational Research, 2(6) (1978) 429–444.
[4] Cho, J.G., and Yum, B.J.,"An uncertainty importance measure of activities in PERT
networks", International Journal of Production Research, 35 (10) (1997) 2737-2758.
[5] Creemers, S., Demeulemeester, E. and Van de Vonder, S., "A new approach for quantitative
risk analysis", Annals of Operations Research, 213 (1) (2014) 27-65.
[6] Creemers, S., Demeulemeester, E. and Van de Vonder, S.,"Project risk management: A new
approach", IEEE International Conference on Industrial Engineering and Engineering
Management (IEEM), 2011, 839-843.
[7] Creemers, S, Demeulemeester, E., and Van de Vonder, S.,"A new approach for quantitative
risk analysis", Annals of Operations Research, 213(1)(2014) 27-65.
[8] Davis, E.W., and Patterson, J.H., A comparison of heuristic and optimum solutions in
resource-constrained project scheduling, Management Science, 21(8)(1975) 944-955.
218
Y.Hadad, B.Keren, Z.Laslo/ Multi-Criteria Methods
[9] Demeulemeester, E., and Herroelen, W., International Series in Operations Research and
Management Science: Vol. 49, Project scheduling—A Research Handbook, Boston, Kluwer
Academic, 2002.
[10] Demeulemeester, E., and Herroelen, W.,“New benchmark results for the resource-constrained
project scheduling problem”, Management Science, 43(1997) 1485–1492.
[11] Edwards, W.,“How to use multi attribute utility measurement for social decision making”,
IEEE Transactions on Systems, Man and Cybernetics, 7(1977) 326-340.
[12] Edwards, W., and Barron, F.A.,“Smarts and SMARTER: Improved simple methods for multi
attribute utility measurement”, Organizational Behavior and Human Decision Processes, 60
(1994) 306-324.
[13] Elmaghraby, S.E.,"On criticality and sensitivity in activity networks", European Journal of
Operational Research, 127(2) (2000) 220-238.
[14] Friedman, L. and Sinuany-Stern, Z. "Scaling units viathe canonical correlation analysis in the
DEA context", European Journal of Operational Research, 100(3) (1997) 629-637.
[15] Ganley, J.A., and Cubbin, S.A., Public Sector Efficiency Measurement: Applications of Data
Envelopment Analysis. Elsevier Science Publishers, Amsterdam, North-Holland, 1992.
[16] Goldrat, E., Critical Chain. The North River Press, Great Barrington, 1997.
[17] Golenko–Ginzburg, D., "A two-level decision–making model for controlling stochastic
projects", International Journal of Production Economics, 32(1) (1993) 117–127.
[18] Gray, C.F., and Larson, E.W., Project Management: The Management Process, third ed.
McGraw-Hill, New York, 2005.
[19] Hadad, Y., and Hanani, Z.M., "Combining the AHP and DEA methodologies for selecting the
best alternative", International Journal of Logistics Systems and Management, 9(3) (2011)
251- 267.
[20] Hadad, Y., and Keren, B., "Decision support model for ranking project network activities
based on multiple criteria of precedence, duration, and cost International", Journal of
Engineering Management and Economics, 4(1) (2013) 1-17.
[21] Helgeson, W.B., and Birnie, D.P., "Assembly line balancing using the ranked positional
weight technique", Journal of Industrial Engineering,12(4) (1961) 394-398.
[22] Kelley, J.E.Jr., and Walker, M.R., "Critical Path Planning and Scheduling", in: Proceedings of
the Eastern Joint Computer Conference, Boston MA, 1959, 160–73.
[23] Kelley, J.E.Jr., "Critical Path Planning and Scheduling: Mathematical Basis", Operations
Research, 9 (1961) 296–320.
[24] Keren, B., and Cohen, Y., "Optimizing project performance: the triangular trade-off
optimization approach", Int. J. Engineering Management and Economics, 3(2012) 152–170.
[25] Khorramshahgol, R., and Steiner, H., "Resource analysis in project evaluation: A multicriteria
approach", Journal of Operational Research Society, 39(9)(1988) 795–803.
[26] Khorramshahgol, R., andVassilis, S., "Delphic Hierarchy Process (DHP): A methodology for
priority setting derived from the Delphi Method and Analytical Hierarchy Process", European
Journal of Operational Research, 37(3) (1988) 347–354.
[27] Khorramshahgol, R.,"An integrated approach to project evaluation and selection", IEEE
Transactions on Engineering Management, 35(4) (1988) 265–271.
[28] Kolisch, R., and Hartmann, S., "Experimental investigation of heuristics for resourceconstrained project scheduling - An update", European Journal of Operational Research, 174
(2006) 23–37.
[29] Kolisch, R., and Padman, R., "An integrated survey of deterministic project scheduling",
Omega, 29(2001) 249–272.
[30] Laslo, Z., "Project portfolio management: An integrated method for resource planning and
scheduling to minimize planning/scheduling-dependent expenses", International Journal of
Project Management, 28(2010) 609–618.
Y.Hadad, B.Keren, Z.Laslo/ Multi-Criteria Methods
219
[31] Laslo, Z., and Gurevich G., "A simulation-based decision support system for managing
information technology project portfolios", International Journal of Information Technology
Project Management, 4(2) (2013a) 1-17.
[32] Laslo Z., and Gurevich G.,"PERT-type projects: time–cost tradeoffs under uncertainty",
Simulation, 89 (3) (2013b) 278-293.
[33] Levy, H., and Sarnat, M., Capital Investment and Financial Decisions. Prentice-Hall,
Englewood Cliffs, New Jersey, (1995).
[34] Mahmood, M.A., Pettingell, K.J. and Shaskevich, A.I., "Measuring productivity of software
projects: A data envelopment analysis approach", Decision Sciences, 27(1) (1996) 57–80.
[35] Martin, J., "Distribution of the time through a directed acyclic network", Operations
Research, 13(1) (1965) 46–66.
[36] Roy, B., "The outranking approach and the foundations of ELCTRE methods", in: C. A. Bana
e Costa, (ed.), Readings in Multiple Criteria Decision Aid, Springer - Verlag, Berlin, 1989.
[37] Roy, B., "Decision-aid and decision-making", European Journal of Operational Research,
45(1990) 324-331.
[38] Saaty, T.L., The Analytic Hierarchy Process, Planning Priority Setting Resource Allocation,
McGraw-Hill, New York, 1980.
[39] Sexton, T.R., Silkman, R.H. and Hogan, A.J., "Data envelopment analysis: Critique and
extensions", in: R.H., Silkman, (ed.), Measuring Efficiency: An Assessment of Data
Envelopment Analysis, Jossey-Bass, San Francisco, CA, 1986, 73-105.
[40] The Project Management Institute, Guide to the project management body of knowledge
(PMBOK guide), Newton Square: The Project management Institute, 2008.
[41] Van Slyke, R.M., "Monte Carlo methods and the PERT problem", Operations Research,
11(5)(1963) 839-860.
[42] Vanhoucke, M., "Using activity sensitivity and network topology information to monitor
project time performance", Omega, 38(5)(2010) 359-370.
[43] Williams, T.M., "Criticality in stochastic networks", Journal of Operations Research Society,
43 (4)(1992) 353-357.
[44] Yeo, K.T., "Project cost sensitivity and variability analysis", International Journal of Project
Management, 9 (2)(1991) 111-116.