Optimization to water supply system design and operation scheme in high rise buildings
Bạn đang xem bản rút gọn của tài liệu. Xem và tải ngay bản đầy đủ của tài liệu tại đây (1.52 MB, 9 trang )
Journal of Science and Technology in Civil Engineering NUCE 2018. 12 (3): 123–131
OPTIMIZATION TO WATER SUPPLY SYSTEM DESIGN AND
OPERATION SCHEME IN HIGH RISE BUILDINGS
Nguyen Lan Huonga,∗, Nguyen Viet Anha , Dang Thi Thanh Huyena ,
Tran Hoai Sona , Dinh Viet Cuonga
a
Faculty of Environmental Engineering, National University of Civil Engineering,
55 Giai Phong road, Hai Ba Trung district, Hanoi, Vietnam
Article history:
Received 12 March 2018, Revised 03 April 2018, Accepted 27 April 2018
Abstract
Greenhouse Gas emission from high-rise buildings has been increasing mainly due to excessive energy consumption of the HVAC system, structural system and electrical system. Electricity consumption for pump
system accounts for 15% of total electricity usage in building. Therefore the reduction of electricity in operation is crucial to the overall reduction of GHGs in urban areas. In this study, a lab-scale experiment was
conducted to test the electricity consumption in applying different design approaches; the energy efficiency of
the system was calculated. Finally, this study proposes the advanced water supply design scheme to reduce
electricity consumption of the pump system.
Keywords: Water supply system; high-rise building; energy consumption.
c 2018 National University of Civil Engineering
1. Introduction
Currently, the process of urbanization has led to a major change in the urban view with rapid
growth of high-rise buildings and skyscrapers. Efficient energy use in these buildings in order to
reduce emissions and ensure green building elements is a critical demand in many municipalities in
Vietnam [1]. According to recent statistics [2], the total energy consumption of buildings accounts
for 40–70% of the energy supply for the municipality, in which the high-rise buildings such as hotels,
commercial buildings, etc. consume about 35–40% of this part. The cost of electricity to operate the
pumps for water supply systems are relatively high (20-40%), based on a study of the 20 - year - life
- cycle cost of water supply system in high-rise buildings [3]. Burton [4] showed that raw and treated
water pumping can account for up to 95% of water utility’s energy use. Similarly, the Electric Power
Research Institute [5] suggests that more than 85% of the energy use in water supply operations is
consumed by pumps alone.
While Wong [6] rendered that in most cases, the energy efficiency for highrise water supply
system is below 25% and more than 75% input energy is wasted. Half of the energy loss attributes to
water pumps.
∗
Corresponding author. E-mail address: (Huong, N. L.)
123
Huong, N. L. et al. / Journal of Science and Technology in Civil Engineering
It is found that two main kinds of systems may cause significant energy wasted [7]. First is a kind
of system that incorporates one pump to run continuously, even during low-flow or no-flow periods.
This system utilizes a thermal bleed solenoid valve to dump water that is overheated in the pump
casing due to the impeller operating below the demand flow rate. Both energy for pumps and water
for pumping are wasted in this case. The second is a kind of system that generates a single water
pressure for the entire building that is high enough to satisfy the upper-level fixtures and then reduce
that pressure through pressure-reducing valves to satisfy lower-level pressure zones in the building.
In this case, energy is wasted via the pressure-reducing valves.
Study on high-rise system shows that the design of water supply system for high-rise buildings is
often not optimal, so that pump heads are usually 1.2–1.3 times higher than the height of the building
(> 100 m H2 O), the pumping efficiency is very low at only 40–60%, electricity used for O&M is very
high, resulting in high rate of energy waste and expense lost. According to [8], optimization of the
design and operation of indoor water supply and boosting system in mega cities of China can save
25% of energy consumption and reduce annual emission by 8,600 tCO2 e.
Energy saving and use of efficient energy source in high-rise buildings not only reduces budgets of
investors but also comply with the Vietnam Government’s strategies for energy security, sustainable
development and environment protection. Therefore, the objectives of this research are (1) to study the
electricity consumption and energy efficiency of different design approaches using lab-scale booster
system; (2) to propose the advanced water supply design scheme to reduce electricity consumption of
the pump system for highrise building.
2. Materials and Method
2.1. Lab-scale experiment
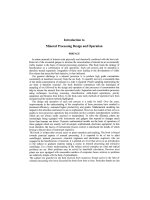
Two typical systems (roof tank system and booster system) [9] for water supply in high-rise
buildings were chosen for the experiment (Fig. 1).
(RT)
(R)
(R)
(P1)
(BP)-
Scheme 1
Scheme 2
Figure 1. Water supply systems in high-rise buildings
Figure 1. Water supply systems in high-rise buildings
Scheme 1. City water supply to reservoir (R) at the basement of building, water is then lifted from reservoir (R) to the roof-tank (RT)
on the most top floors by pump system 1 (P1) at the basement. The water tank will supply water to the below floors at the same time
Scheme
1. water
Cityfor
water
supply
to The
reservoir
(R)supplying
at the basement
building,
then(P2);
lifted
from2. City water is
reserves
the upper
floors.
water tank
water to theof
upper
floors bywater
boosterispump
Scheme
provided
reservoir
at the (RT)
basement
will supply
water
with constant
pressure to all the floors
reservoir
(R)totoa the
roof-tank
on of
thebuilding.
most topBooster
floorspump
by pump
system
1 (P1)
at the basement.
continuously
with
the support
of Booster
Water
is pumped
from
the water
tank pump
to the(BP).
upper floors by booster pump (P2);
A lab-scale experiment is set up to analyse the pump efficiency of different water supply system designs in high-rise building (
124
Figure 2). The system consists of : 01 water tank with dimension BxLxH = 1250 x 750 x 350 mm, storage capacity of 280 liter; 02
3
(R)
(R)
(BP)(P1)
Huong, N. L. et al. / Journal of Science and Technology in Civil Engineering
Scheme 1
Scheme 2
Figure 1. Water supply systems in high-rise buildings
Scheme 2. City water is provided to a reservoir at the basement of building. Booster pump will
Scheme
City constant
water supply
to reservoir
(R)the
at the
basement
of building,bywater
is then
lifted from
reservoir (R) to the roofsupply
water1.with
pressure
to all
floors
continuously
booster
pumps
(BP).
tank (RT)Aon
the
most
top
floors
by
pump
system
1
(P1)
at
the
basement.
The
water
tank
will
supply
water
to
the below
floors at the
lab-scale experiment is set up to analyze the pump efficiency of different water supply
system
same time reserves water for the upper floors. The water tank supplying water to the upper floors by booster pump (P2); Scheme 2.
designs in high-rise building (Fig. 2). The system consists of: 01 water tank with dimension B ×
City water is provided to a reservoir at the basement of building. Booster pump will supply water with constant pressure to all the
L continuously
× H = 1250with
× 750
× 350ofmm,
storage
of 280 liter; 02 vertical centrifugal pump unit with
floors
the support
Booster
pumpcapacity
(BP).
variable speed motor, each unit has the capacity of Q p = 3.5 m3 /hr and head Hmax = 30 m; pump
A lab-scale experiment is set up to analyze the pump efficiency of different water supply system designs in high-rise building
motor P = 0.37 kW. The pump unit is installed in parallel on the pump base, connected with the inlet
(Fig. 2). The system consists of : 01 water tank with dimension BxLxH = 1250 x 750 x 350 mm, storage capacity of 280 liter; 02
3
pipecentrifugal
D75 andpump
discharge
D75.
Onmotor,
the discharge
pipe,
were
water
meter
(Grundfos,
0.6-12
vertical
unit withpipe
variable
speed
each unit has
the there
capacity
of Qp=
3.5 m
/hr and
head Hmax=30m;
pump motor
3
m /hr),The
pressure
gauge
(Grundfos,
0-10
atm),
pressure
sensor with
(Danfoss,
atm),
Watt pipe
meter
P=0.37kW.
pump unit
is installed
in parallel
on the
pump
base, connected
the inlet 0-10
pipe D75
andand
discharge
D75. On the
discharge
pipe, there
(Grundfos,
0-10 atm),
pressuresystem
sensor (Danfoss,
0-10
(Grundfos).
Atwere
onewater
end meter
of the(Grundfos,
discharge0.6-12m3/hr),
pipe, total pressure
6 watergauge
tap was
installed.
The pump
was
atm),controlled
and Watt meter
(Grundfos).
At
one
end
of
the
discharge
pipe,
total
6
water
tap
was
installed.
The
pump
system
was
controlled
by
by the control panel Grundfos HYDRO-MPC E2XCRE3-05, the screen indicates various
the control panel Grundfos HYDRO-MPC E2XCRE3-05, the screen indicates various system configurations such as: set
up
pump
het
system configurations such as: set up pump het (atm), actual pump head (atm), water volume (m3 /hr),
(atm), actual pump head (atm), water volume (m3/hr), and electricity consumption (kW), percentage of motor speed to the full speed of
electricity
consumption (kW), percentage of motor speed to the full speed of 2950 r/min (%).
2950and
r/min
(%).
Figure 2. Lab-scale pump system outline and photo
Figure 2. Lab-scale pump system outline and photo
2.2. Pump configurations and data monitoring
2
2.2.1. Pump curves
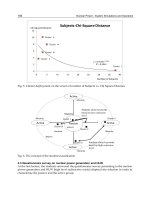
The pump operation curves at different operation modes are constructed by changing the pump
discharge output through PLC unit. The pump speed varies at 95%, 90%, 85%, 80%, 75%, 70%,
65%, 60%, 55%, 50% of the full speed. The consumption pattern was changed by opening the valves
on the discharge pipe.
The pumps operate individually and in parallel, the output parameters were recorded and the
curves were constructed as shown in Figs. 3 and 4.
2.2.2. Pump system configuration
Two lab-scale experiments are built: (1) Roof tank system: Q= 6 m3 /h, h = 20 m, Tank volume 2
m3 ; (2) Booster pump system, in which (2a) the first booster pump system with Q p = 6 m3 /h, h = 20
m; (2b) the second pump system with Q p = 5.85 m3 /h, h = 10 m. Both systems are run with the
different Peak factor: Kh = 2.5; 2; 1.8 ([10, 11]).
125
a.Pump
Pumpcurves
curves
a.
The
pump operation curves at different operation modes are constructed by changing the pump discharge output through PLC unit. The
pump
speed
varies at
95%,
85%,operation
80%,
75%,
70%,
55%,
50%
of the
the pump
fullthe
speed.
The
consumption
wasPLC
changed
Thepump
pump
operation
curves
at different
operation
modes
are 60%,
constructed
by changing
pump
discharge
outputpattern
through
unit. The
The
operation
curves
at90%,
different
modes
are65%,
constructed
by changing
discharge
output
through
PLC
unit.
The
pump
speedthe
varies
95%,
90%,
85%,
80%,
75%,
50%
full The
speed.
The consumption
pattern
was changed
by
opening
valves
on
the
discharge
pipe.
pump
speed
varies
at at
95%,
90%,
85%,
80%,
75%,
70%,70%,
65%,65%,
60%,60%,
55%, 55%,
50% of
the of
fullthe
speed.
consumption
pattern was
changed
byopening
openingthe
thevalves
valves
discharge
pipe.
by
onon
thethe
discharge
pipe.
The pumps operate individually and in parallel, the output parameters were recorded and the curves were constructed as shown in Figs
pumps
operate
individually
and
in
the
parameters
were recorded
the were
curves
were constructed
The
pumps
individually
andL.
inetparallel,
the output
parameters
were recorded
theand
curves
constructed
as shownas
in shown
Figs in Figs
Huong, N.
al.parallel,
/ Journal
of output
Science
and Technology
inand
Civil
Engineering
3The
and
4. operate
33and
and4.4.
Huong, N. L. et al./ Journal of Science and Technology in Civil Engineering
Efficiency,
Head, configurations
m
2.2. Pump
and
data %
monitoring
Efficiency,
%%
Efficiency,
Head,
Head, m
m
Power,
kW
a. Pump
curves
Power,
kW
Power,
kW
The pump
operation
curves at
different operation
by Two
changing
theoperate
pump
discharge
output
through
PLC unit. The
Pump11operates
operates
individually
with
speed.
(b) Two
pumps
operate
in parallel
with
fullspeed
(a)(a)Pump
individually
withfull
fullmodes
speedare constructed(b)
pumps
in parallel
with
fullspeed
(a) Pump
Pump1at1operates
operates
individually
with
full
speed.
(b)
Two
pumps
in parallel
fullspeed
(a)
individually
full
speed.
(b)the
Two
pumps
operate
in parallel
withwith
fullspeed
pump speed
varies
95%,
90%,
85%, 80%,with
75%,
70%,
65%, 60%, 55%, 50% of
full
speed.
Theoperate
consumption
pattern
was
changed
by opening the valves on the discharge pipe.
Figure 3. Pump operation curves
Figure 3.Figure
Pump3.operation
curvescurves
Pump operation
Figure
3. Pump were
operation
curves
The pumps operate individually and in parallel, the output
parameters
recorded
and the curves were constructed as shown in Figs
3 and 4.
kW
kWkW
(a) Head-Discharge curve
(b) Power-Discharge curve
Figure 4. Pump operation curves when operating in parallel with different operation modes (variable speed pump)
(a) Head-Discharge curve
(b) Power-Discharge curve
(a)
Head-Discharge
curve
(b)
Power-Discharge
curvespeed pump)
Figure
4.
Pump
operation
curves
when
operating
in
parallel
with
different
operation
modes
(variable
(a) Head-Discharge curve
(b) Power-Discharge
curve
Efficiency,
% curves when operating in parallel with different operation modes (variable speed pump)
operation
Head, mFigure 4. Pump
Power, kW
Figure 4. Pump operation curves when operating in parallel with different operation modes
speed pump)(b) Two pumps operate in parallel with fullspeed
(a) Pump 1 operates individually with full speed.
(variable
Figure 3. Pump operation curves
3
2.2.3. Experiment process
kW
Roof-tank system: From the control panel, set the pump operation at the set point with: Q p = 6
m3 /h, h = 20 m. Maintain the operation and record the electricity consumption data by hours in 24
hours.
Booster pump system: From the peak-factor data, each hour set the operation point with corresponding Q p and h. The water discharge was controlled by the water tap. For each value in an hour,
electricity consumption was recorded in 24 hours.
126
(a) Head-Discharge curve
(b) Power-Discharge curve
Figure 4. Pump operation curves when operating in parallel with different operation modes (variable speed pump)
3
3
Huong, N. L. et al. / Journal of Science and Technology in Civil Engineering
2.2.4. Pump efficiency
Pump efficiency is calculated as followed:
Pump Hydraulic Efficiency (η pump , %) =
Pump Hydraulic Power Output (kW) × 100
Pump input Shaft Power (kW)
(1)
The Pump Hydraulic Power Output is calculated for each design systems with formula as followed:
N pump =
ρ×g×H×Q
(kW)
102
(2)
in which: H: total head (m); Q: flowrate (m3 /s), ρ: density of the fluid (kg/m3 ); g: acceleration due
to gravity (m/s2 ).
Pump output Shaft Power is measured using voltage and current meter. Head and Flow are
recorded based on information display on the control panel of the pump system.
2.3. Case study
Based on the lab scale data, we design water supply system for a commercial apartment building
(35 floors, 1 basement) with 03 different design approach:
- Roof-tank system 1.1: City water supply to reservoir (R) at the basement of building. Water is
then lifted from reservoir (R) to the water tank (WT) on the most top floors by pump system 1 (P1)
at the basement. The water tank will supply water to the below floors at the same time reserves water
for the upper floors. The water tank supplying water to the upper floors by booster pump (P2). The
system is divided into 04 zones (roof tank system).
- Intermediate-tank system 1.2: City water was stored in a reservoir at the basement of building.
Water supply system is divided into different water pressure zones. Each zone consists of 15-20 floors.
Every zone has a water tank and served by its own booster pump. The pump only supplies water to
the tanks of the above zones. At the most top-floor a booster pump is installed. In case of emergency,
electricity breakdown, the tank will be able to provide water in12 hours. (intermediate tank system).
- Booster pump system 1.3: City water is provided to a reservoir at the basement of building.
Booster pump will supply water with constant pressure to all the floors continuously with the support
of Variable Frequency Drive (VFD). The system consists of 02 sets of booster pumps to supply water
to 02 pressure zones (Booster system).
2.4. Life-cycle cost
Life cycle cost calculations for pumping systems of a 35 floor-building are conducted with three
parameters taken into account: (i) capital costs; (ii) Maintenance cost and (iii) Operation costs.
- Capital cost for pump system, reservoir, water tank, piping and valves, Ci , is obtained from the
manufacturer of the system supplying equipment with the equivalent capacity.
- Maintenance costs - Cm is obtained from manufacturer (estimation for booster sets is 50% of
booster’s initial purchase price, pipe and pressure reduction valves 5% of initial investment, roof, base
and break tanks 20% of tanks initial costs).
Operation cost - Energy costs - Ce : Energy consumption is the result obtained from lab-scale
experiment.
So the Life cycle cost (LCC) is the sum of the three components:
LCC = Ci + Cm + Ce
127
(3)
Huong, N. L. et al. / Journal of Science and Technology in Civil Engineering
3. Results and discussion
3.1. Experimental results
Huong, N. L. et al./ Journal of Science and Technology in Civil Engineering
Huong,
N. L. et al./ Journal
of Science
and and
Technology
Civil Engineering
Comparing the Energy
consumption
between
roof tank
pump in
booster
systems are showed
in Fig. 5. Overall, the energy consumption for roof tank system was about 30% higher than that of
booster pump system. This result is consistent with the previous study by [2]. The explanation lies
4. Results
discussion
in
the and
fact
the water is often pumped through where it is required (extra energy applied) and a
4. Results
andthat
discussion
4.1.
Experimental
results
number
of pressure
valves
haveThe
to be
installed.
The energy
consumption in the maximumnumber of pressure
reducing
valvesreducing
have to be
installed.
energy
consumption
in the maximum-water-using
day of booster system
4.1. Experimental
results
was reducedwater-using
around
27% to
33%.
day
of booster
systembetween
was reduced
to 33%.
Comparing
the
Energy
consumption
roof tank around
and pump27%
booster
systems are showed in Fig. 5. Overall, the energy
Comparing the Energy consumption between roof tank and pump booster systems are showed in Fig. 5. Overall, the energy
consumption
for for
roofroof
tanktank
system
waswas
about
30%
higher
thanthan
thatthat
of booster
pump
system.
This
result
is consistent
with
thethe
previous
consumption
system
about
30%
higher
of booster
pump
system.
This
result
is consistent
with
previous
study
by
[2].
The
explanation
lies
in
the
fact
that
the
water
is
often
pumped
through
where
it
is
required
(extra
energy
applied)
andand
a a
study by [2]. The explanation lies in the fact that the water is often pumped through where it is required (extra energy applied)
number
of pressure
reducing
valves
have
to be
TheThe
energy
consumption
in the
maximum-water-using
dayday
of of
booster
system
number
of pressure
reducing
valves
have
to installed.
be installed.
energy
consumption
in the
maximum-water-using
booster
system
waswas
reduced
around
27%27%
to 33%.
reduced
around
to 33%.
kWh
kWh
Peak-factor K
Roof-tank
Roof-tank
Booster
Booster
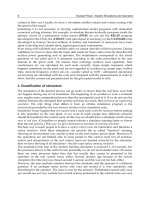
Figure 5. Electricity consumption of two water supply systems with different Kh in the maximum-water-using day
Figure 5. Electricity consumption of two water supply systems with different Kh
the maximum-water-using
day consumption of the systems changes closely with
Peak-factor
K the
Peak-factor
K electricity
Studying the working chart of direct booster pump in
systems
shows
that
the water use patterns
according
to the
different non-harmonic
water
use coefficients.
Figure
5. Electricity
consumption
of two
water
supply
systems
with
different
Kh K
inh the
maximum-water-using
dayday
Figure
5. Electricity
consumption
of two
water
supply
systems
with
different
in the
maximum-water-using
The pumps are controlled
by
the
inverter
system
that when
changing
the flow
by
closing
orthe
opening
the valves,
the speeds of pump
Studying
the
working
chart
ofso
direct
booster
pump
systems
shows
that
electricity
consumption
are changed of
automatically
to
suit
the
installation
pressure
of
the
system.
The
pump
efficiency
is
still
higher
than
50%changes
(Figure
Studying
the
working
chart
of
direct
booster
pump
systems
shows
that
the
electricity
consumption
of
the
systems
the Studying
systemsthechanges
with booster
the water
patterns
to theconsumption
different non-harmonic
working closely
chart of direct
pumpuse
systems
shows according
that the electricity
of the systems
changes 6, 7,
8).The high
efficiency
of pump
isaccording
from
40%
to
55%
(Figure
7). The water
pump
efficiency
reduces to under 10% in the low water use
closely
withwith
therange
water
use
patterns
to the
different
non-harmonic
use
coefficients.
closely
the
water
use
patterns
according
to
the
different
non-harmonic
water
use
coefficients.
water use coefficients.
period time (From 0 am to 5 am) (Figure 6, Figure 8), at this period time the flow is very low compared to the average flow, but the
The
pumps
are are
controlled
by the
inverter
so that
when
changing
flow
bychanging
closing
opening
thethe
valves,
thethe
speeds
The
pumps
arecontrolled
controlled
by
thesystem
inverter
system
so
thatthework
when
the
flow
by
closing
or ofwith
The
pumps
by the
inverter
system
so that
that
when
changing
the
flow
by
or
opening
valves,
speeds
of the
pump is still working
with
the
installation
pressure
point
so
the
pumps
in
theclosing
lowor efficiency
zone.
However,
pump
are are
changed
automatically
to suit
the the
installation
pressure
of the
system.
TheThe
pump
efficiency
is still
higher
than
50%
(Figs.
6, 6,
7, 7,
pump
changed
automatically
to
suit
installation
pressure
of
the
system.
pump
efficiency
is
still
higher
than
50%
(Figs.
valves, theconsumption
speeds of pump
are system
changed
automatically
installation
operation in opening
24 hours, the
the electricity
of booster
is much
lower thanto
thesuit
roofthe
tank
system. pressure of
8).The
highhigh
efficiency
range
of pump
is from
40%
to 55%
(Fig.
7). 7).
TheThe
pump
efficiency
reduces
to to
under
10%
in in
thethe
low
water
useuse
8).The
efficiency
range
of pump
is from
40%
to 55%
(Fig.
pump
efficiency
reduces
under
10%
low
water
the
system.
The
pump
efficiency
is 8),
still
higher
than
(Figs.
6,low
7,
8).Thetohigh
efficiency
range
of
period
time
(From
0 am
to
5toam)
(Figs.
6 and
8),
at this
period
time
the50%
flow
is
very
low
compared
the
average
flow,
but
thethe
pump
is is
period
time
(From
0 am
5 am)
(Figs.
6 and
at this
period
time
the
flow
is very
compared
to the
average
flow,
but
pump
iswith
from
to 55%
(Fig.point
7).
The
pump
efficiency
to under
10%
in the
low
water
usein in
stillpump
working
the40%
installation
pressure
so
that
thethe
pumps
work
in the
lowlow
efficiency
zone.
However,
with
thethe
operation
2424
still
working
with
the
installation
pressure
point
so that
pumps
work
inreduces
the
efficiency
zone.
However,
with
operation
hours,
the the
electricity
consumption
of booster
system
is much
lower
than
thethe
roofroof
tank
system.
hours,
electricity
consumption
of booster
system
is much
lower
than
tank
system.
Figure 6. Electricity consumption of booster pump Figure 7. Electricity consumption of booster pump
system with peak factor Kh=2.5
system with peak factor Kh=2.0
Figure
6. Electricity
consumption
of booster
system
with
Figure
7.
consumption
of of
booster
pump
system
with
Figure
6.
consumption
of booster
pump
system
with Figure
Figure
7.
Electricity
consumption
booster
pump
system
with
Figure
6. Electricity
Electricity
consumption
ofpump
booster
pump
7. Electricity
Electricity
consumption
of
booster
pump
peak
factor
Kh=2.5
peak
factor
K
=2.0
peak
factor
Kh=2.5
peak
factor
K
=2.0
h
h
system with peak factor Kh = 2.5
system with peak factor Kh = 2.0
128
Huong, N. L. et al. / Journal of Science and Technology in Civil Engineering
period time (From 0 am to 5 am) (Figs. 6 and 8), at this period time the flow is very low compared to
the average flow but the pump is still working with the installation pressure point so that the pumps
work
efficiency
zone.
However, with
theEngineering
operation in 24 hours, the electricity consumption
Huong,
N. L.inetthe
al./ low
Journal
of Science
and Technology
in Civil
of booster system is much lower than the roof tank system.
s
3.2. Case study results
e study
m can
0, 11):
shows that the optimization of the
The result from case study shows that the optimization of the
be studied under various design
water supply system can be studied under various design
approaches (Figures 9, 10, 11):
as lowest initial- costs:
less investment
for
System
1.1 has lowest
initial costs: less investment for
3.2. Case study results
n contrast, this systempump
has highest
electricity
system,
tanks. In contrast, this system has highest
all of the pump
power
is used
liftconsumption
water
electricity
because
all of theofpump
The
result
from tocase
study to
shows that
the optimization
the power
is usedsystem
to lift water
the topunder
floors.
water supply
can betostudied
various design
- compared
System
1.2
higher
initial costs compared to system
(Figures
9, has
10, 11):
higher initialapproaches
costs
to
system
1.1
- 1.1
System
1.1 has
costs:
investmentintermediate
for
because
of lowest
higherinitial
costs
for less
purchasing
ts for purchasing intermediate
pump systems
pump system,
tanks.
In contrast,
this
system
hasthe
highest
pump
systems
and
break
tanks,
but
total LCC
he total LCC reduces because
the consumption
electricity because all of the pump power
electricitybecause
reduces
the
electricity
consumption
cost
uces.
is used to lift water to the top floors.
reduces.
- because
Systemof1.2
higher
initial costs compared to system
highest initial costs
the has
highest
costs
1.1 because of higher costs for
purchasing
intermediate
Figure
8.
Electricity
consumption
of
booster pump system
The booster pump
sets
equipped
with
frequency
System
1.3 has
highest
costs
of the
highest
8.and
Electricity
consumption
of booster
pump
system Figure
with peak8.factor
Kh = 1.8 consumption of boost
pump Figure
systems
break initial
tanks,
but
the because
total
LCC
Electricity
with
peak factor
Kh=1.8
xpensive than the normal
pump
sets.
However,
costs
for
pump
installation.
The
booster
pump
sets
equipped
reduces because the electricity consumption cost
system
with
peak
factor Kh=1.8
and construction costswith
reduce
because there
is no
frequency
converter
is more expensive than the normal
reduces.
in the system. In addition,
electricity
consumption
the lowest
compared
the other systems. The results
pumpthesets.
However,
other iscosts
for pipes
and toconstruction
Case
study
results
consumption for3.2.
this
system
can
reducedinitial
by 1.6costs
times.
Regarding
the
electricity
consumption
per volume
- booster
System
1.3 has
highest
highest
costs
reduce
because
there
is
nobecause
need of
forthe
break
tanks
in the
In consumption
addition, theofelectricity
consumption is
Figure
8. system.
Electricity
booster pump
costs for
pump
installation.
The the
booster
pump
sets(Fig.
equipped
, the booster systems consume
much
times
lesssystems.
then
other
systems
10). that
compared
to6.1
the
other
The
results
show
electricity
consumption
for
this
booster
system
can red
system with peak factor Kh=1.8
The
result
fromconverter
case
study
shows
thatthan
thethe
optimization
of
the
water
supply system
can besystems
studiedconsume mu
with
frequency
is more
expensive
normal
times.
Regarding
the
electricity
consumption
per
volume
of
water
consumption,
the
booster
gain are similar to thosepump
in previous
study [3,other
13] in
which
they
that the booster system and intermediate
sets.design
However,
costs
for
pipesfound
construction
underless
various
approaches
(Figs.
9,and10,
11):
then
the
other
systems
(Figure
10).
ior to the roof tank solution
when
it comes
to is
initial
investment,
maintenance
and
energyInefficient
operation.
costs- both
reduce
because
there
no need
for break
tanks in the
system.
addition,
the electricity consumption is the lowest
System
1.1
has
lowest
initial
costs:
less
investment
for pump
system,
tanks.
In contrast,
ndered to explain, for instance,
booster
sets
and low pressure
levels can
create
compared
to theconfigurations
other systems.with
Theseveral
resultsbooster
show that
electricity
consumption
for
this booster
system
can reducedthis
by 1.6
These
findings
again
are
similar
to
those
in
previous
study
[3,
13]
in
which
they
found
that
the
system
times.
Regarding
the
electricity
consumption
per
volume
of
water
consumption,
the
booster
systems
consume
muchto
6.1the
timesand interm
here is little or system
no flow, while
break tanks
made it possible
to use water
on stock all
in order
to adapt
to power
peak flow
has highest
electricity
consumption
because
of the
pump
is used to liftbooster
water
system
are
superior
the
roofcantank
solution
-water
bothatwhen
it comes
to initial
investment, maintenance and energy efficien
less
then thetoother
systems
(Figure
10).
e two booster
system
and
intermediate
systems
provide
enough
acceptable
low
power
consumption.
top floors.
Some reasons were rendered to explain, for instance, booster configurations with several booster sets and low pressure level
-findings
System
1.2there
has
higher
initial
costswhile
compared
system
1.1
higher
costs
purchasThese
again
are
similar
to those
in previous
study [3,
13] to
in
whichmade
they
found
that theof
booster
system
andfor
intermediate
tank to adapt t
even
pressure
when
is
little
or
no
flow,
break
tanks
it because
possible
to
use water
on
stock
in order
system
are
superior
to the
roof
tank
solution
- both
when
it comesbut
to
initial
investment,
maintenance
and
energy
efficient
operation.
situations.
Thus,
these
two
booster
system
and
intermediate
systems
can LCC
provide
enoughbecause
water
atthe
acceptable
low power con
ing intermediate
pump
systems
and
break
tanks,
the total
reduces
electricity
Some reasons were rendered to explain, for instance, booster configurations with several booster sets and low pressure levels can create
consumption
even
pressure whencost
therereduces.
is little or no flow, while break tanks made it possible to use water on stock in order to adapt to peak flow
situations. Thus, these two booster system and intermediate systems can provide enough water at acceptable low power consumption.
Construction
(tanks)
US$400,000
Pipe & PRVs
US$400,000US$300,000
Pump set
1.
Sy
2
st
em
1.
3
US$300,000US$200,000
US$200,000
st
em
US$100,000
US$100,000
l cost for different water supply systems
US$-
US$Figure 10. Operational cost (mostly electric consumption)
for
System
the total life span of 20 years
System System 1.1
System
System System
1.2
1.3
1.1
1.2
1.3
Figure 10. Operational cost (mostly electric consumptio
Figure 10.
Operational
cost (mostly
electric
the
Figure
10. Operational
cost
(mostly
electric
Co
total
lifeconsumption)
span
of 20for
years
Figure 9. Capital cost for different water supply systems
kW/m3
kW/m3
6.0
6.0
4.0
4.0
2.0
2.0
US$500,000
US$500,000
US$400,000
US$400,000
129
US$300,000
US$300,000
US$200,000
US$200,000
US$100,000
US$100,000
US$US$3
8.0
8.0
total
20 years
consumption)
forlife
thespan
totaloflife
span of 20 years
2
systems
1
Figure
9. Capital
cost for
different
water supply
Figure
9. Capital
cost
for different
watersystems
supply
đờ
Co
Maintenance
Mainten
Operation
Operati
Construction
Constru
US$400,000
US$400,000
US$300,000
US$300,000
US$200,000
Huong, N. L. et al. / Journal of Science and Technology in Civil Engineering
US$200,000
US$100,000
- System 1.3 has highest initial costs because of the highest
costs for pump installation. The
US$100,000
booster pump sets equipped with frequency converter is more expensive than the normal pump sets.
US$However, other costs for pipes and construction costs reduceUS$because there
is no System
need forSystem
break
System
System
System
System
tanks in the system. In addition, the electricity consumption is the lowest compared
to the other
1.1
1.2
1.3
1.3 by 1.6
systems. The results show that electricity consumption for this booster1.1
system 1.2
can reduced
Figure
9. Regarding
Capital cost the
for different
water
supply systems
Figureof10.
Operational
cost (mostly
electric consumption)
for the
times.
electricity
consumption
volume
water
consumption,
the booster
systems
Figure
9. Capital
cost for different
water supply
systems perFigure
10. Operational
cost (mostly electric
consumption)
for the
C
total life span of 20 years
consume much 6.1 times less then the other systems (Fig. 10). total life span of 20 years
đ
US$500,000
US$500,000
US$400,000
US$400,000
US$300,000
US$300,000
US$200,000
US$200,000
US$100,000
US$100,000
US$- US$-
2.02.0
0.00.0
Construction
Construction
System
System
System
System
System
System
1.11.1 1.2 1.2 1.3 1.3
1.
3
4.04.0
Operation
Operation
ste
m
kW/m3
kW/m3
6.06.0
Figure 11. Electricity consumption per volume water
supply (kW/m3 )
C
Maintenance
Maintenance
Sy
ste
m
1.
SSy
1
ysst
teem
m
SSyy 1.12
ssttee
mm
Sy 1.23
8.08.0
Initial Initial
investment
investment
Figure 12. Life-cycle cost assessment results for
case study
6
These findings again are similar to those in previous study [3, 12] in which they found that the
booster system and intermediate tank system are superior to the roof tank solution - both when it
comes to initial investment, maintenance and energy efficient operation. Some reasons were rendered
to explain, for instance, booster configurations with several booster sets and low pressure levels can
create even pressure when there is little or no flow, while break tanks made it possible to use water
on stock in order to adapt to peak flow situations. Thus, these two booster system and intermediate
systems can provide enough water at acceptable low power consumption.
The system LCC assessment for 20 years (Fig. 12) shows that booster system (system 1.3) has
the lowest electricity consumption (46% of total LLC) but highest initial investment costs (45% of
total LCC). This makes sense in a way that for the booster system, more pumps are installed. This
should be kept in mind that using booster system shall be vulnerable in case of pump failure and
quite sensitive to electrical fall outs. The intermediate system has the lowest operational cost for total
life span of 20 years, but it normally requires spaces on service floor, which eventually take away
potential revenue-generating space and has high risk of micro-bacterial growth in break tanks [2].
4. Conclusions
The results from experiment shows that energy consumption for booster system does not have
much difference with the intermediate tank systems, this might be the results of operating conditions
(the flow is adjusted with the water tap that effect the pump efficiency). This suggests that booster
pump set could have better energy performance if the water consumption is more stable (smaller
difference between the max/min flow) i.e. large buildings.
The result from case study calculation shows that: Roof tank system (system 1.1) and intermediate
system (system 1.2) has not much difference in the total life cycle costs. Depending the number of
floors and the water consumption pattern (building type), we can design a suitable system.
130
6
Huong, N. L. et al. / Journal of Science and Technology in Civil Engineering
The result from case study for LCC assessment for 20 years shows that booster system (system
1.3) has lowest electricity consumption (46% of total LLC) but highest initial investment costs (45%
of total LCC).
Based on this study’s results, when optimizing the indoor water supply systems the engineers
need to consider the various factors include: Energy saving, small carbon footprint, lower life cycle
cost, type of buildings (number of floors, purpose of building). The author suggests utilizing a booster
system for long-term economical and environmental impact.
Acknowledgement
The authors express grateful appreciation to KURITA, KARG-AIT fund for financial support;
Mr. Nguyen Manh Hung and colleagues from Grundfos Company for technical support; and student
research group of 59MNE, National University of Civil Engineering for their support during survey
and experiment trials.
References
[1] Chinh, P. M. (2011). Assessing energy saving of heat recovery ventilation equipment in ventilation and
air conditioning system. Journal of Science and Technology in Civil Engineering (STCE)-NUCE, 5(3):
128–133. (in Vietnamese).
[2] International Energy Agency (2012). CO2 emissions from fuel combustion beyond 2020. (Online
database).
[3] Jens, N. and Anders, N. (2014). Water supply in tall buildings: Roof tanks vs. pressurised systems.
Grundfos Water Boosting.
[4] Burton, F. (1996). Water and wastewater industries: Characteristics and energy management opportunities. No. Rep. CR-106941), Electric Power Research Institute, Palo Alto, CA.
[5] Electric Power Research Institute (2002). Water and sustainability (volume 4): U.S. electricity consumption for water supply and treatment - the next half century. (No. Technical Rep. 1006787), Palo Alto,
CA.
[6] Wong, L. T., Mui, K. W., Lau, C. P., and Zhou, Y. (2014). Pump efficiency of water supply systems in
buildings of Hong Kong. Energy Procedia, 61:335–338.
[7] Jim, B. (2007). Domestic water system design for high-rise buildings. Plumbing Systems & Design
Magazine, (May/June 2007):40–45.
[8] Smith, K., Liu, S., Liu, Y., Liu, Y., and Wu, Y. (2017). Reducing energy use for water supply to Chinas
high-rises. Energy and Buildings, 135:119–127.
[9] Nhue, T. H., Ha, T. D., Hai, D., Dung, U. Q., and Tin, N. V. (1996). Water supply and sanitation. Science
and Technology Publication House. (in Vietnamese).
[10] Surendran, S., Tanyimboh, T. T., and Tabesh, M. (2005). Peaking demand factor-based reliability analysis
of water distribution systems. Advances in Engineering Software, 36(11-12):789–796.
[11] Ministry of Construction (2006). Vietnam technical standard TCVN 33:2006: Water supply - water
distribution network and water works design.
[12] Tin, N. V. (2014). Study on design code for water supply and drainage system for high scrappers in
Vietnam. Project report. (in Vietnamese).
131