Study on using maximum amount of fly ash in producing ultra high performance concrete
Bạn đang xem bản rút gọn của tài liệu. Xem và tải ngay bản đầy đủ của tài liệu tại đây (656.15 KB, 11 trang )
Journal of Science and Technology in Civil Engineering NUCE 2018. 12 (3): 51–61
STUDY ON USING MAXIMUM AMOUNT OF FLY ASH IN
PRODUCING ULTRA-HIGH PERFORMANCE CONCRETE
Van Viet Thien Ana,∗
a
Faculty of Building Materials, National University of Civil Engineering,
55 Giai Phong road, Hai Ba Trung district, Hanoi, Vietnam
Article history:
Received 21 March 2018, Revised 06 April 2018, Accepted 27 April 2018
Abstract
In the present study, the synergic effects of cementitious materials in the ternary binder containing cement,
silica fume, fly ash on the workability and compressive strength were evaluated by using the D-optimal design
of Design-Expert 7. The ternary binder composed of 65 vol.-% cement, 15 vol.-% SF and 20 vol.-% FA at the
W/Fv ratio of 0.50 is the optimum mixture proportions for the highest compressive strength of the UHPC. To
produce the sustainable UHPC, high-volume fly ash ultra high performance concrete with a good flowability
and 28-d compressive strength over 130 MPa can be produced with fly ash content up to 30 vol.-% in the binder.
Keywords: UHPC; high volume fly ash; silica fume; workability; compressive strength.
c 2018 National University of Civil Engineering
1. Introduction
Ultra-high performance concrete (UHPC) is a new type of concrete being researched and used
in many constructions [1, 2]. UHPC possesses good flowability, 28-d compressive strength over 130
MPa at the normal curing condition, very low porosity and high durability [3, 4]. To obtain these outstanding properties, UHPC commonly consists of a low water to binder ratio, high amount of Portland
cement, silica fume (SF) and superplasticizer (SP) [3–5]. With high content of Portland cement and
silica fume, UHPC is not only very expensive compared with normal and high performance concrete
but also not environmentally friendly. In order to develop more sustainable and eco-efficient UHPC,
various pozzolanic materials have been used as partial cement replacement in UHPC [6–8].
Silica fume is commonly pozzolanic material used in UHPC. It plays three main functions: 1)
to fill the voids between particles to achieve a high packing density; 2) to improve the rheological
properties by lubrication effects resulting from small and perfect spherical particles; and 3) to produce
secondary hydration products by consumption of portlandite (the pozzolanic reaction). Hence, SF
strongly influences properties of concrete [9–11]. In a Portland cement concrete with water cement
ratio of 0.5, about 18.3% SF, referred to the weight of cement, is enough to totally consume Ca(OH)2
that is released from cement hydration [12]. However, the optimal SF content of UHPC is normally
about 20-30 wt.-% of cement to improve the filler effect [13–15]. However, the high price of SF
∗
Corresponding author. E-mail address: (An, V. V. T)
51
An, V. V. T. / Journal of Science and Technology in Civil Engineering
makes it as a non-desired material in producing UHPC. The other pozzolanic materials such as fly
ash (FA), available in huge volume as a waste material with low cost and environmental problem can
be used in UHPC [8, 16, 17]. When FA partially replaces Portland cement, the workability of the
UHPC increases but its compressive strength decreases. When quartz powder is completely replaced
by FA, the workability of the UHPC dramatically decreases with coarse FA and is constant with finer
ones. The mixture containing fine FA to partially replace SF needs higher SP dosage and possesses
slower compressive strength development in water at 20˚C compared to the mixture containing SF.
The present study investigates synergic effects of SF and FA partially replacing cement on workability and compressive strength of UHPC at the ages of 3 and 28 days by using statistical analysis
of the Design-Expert software. With the purpose of using FA as much as possible, workability and
compressive strength of UHPC containing different FA and water contents were also studied in this
study.
2. Materials and methods
2.1. Materials
Cementitious materials used in this study were ordinary Portland cement, fine fly ash (FA) and
undensified powder of SF. Quartz sand was utilized as aggregate. Chemical compositions and physical
properties of the materials are given in Table 1 and Table 2. Superplasticizer was a polycarboxylate
ether type.
Table 1. Chemical composition of cementitious materials, (%)
N◦
1
2
3
Materials
Cement
SF
FA
SiO2
Fe2 O3
Al2 O3
CaO
Na2 O
K2 O
MgO
L.O.I
22.6
92.6
58.7
3.5
1.85
7.3
5.3
0.9
22.9
64.2
0.32
1.0
0.14
0.39
0.33
0.61
1.20
3.6
2.3
0.85
0.9
0.81
1.60
4.41
Table 2. Physical properties of materials
N◦
1
2
3
Items
Specific density, (g/cm3 )
Mean particle size (µm)
Compressive strength of cement (MPa)
Cement
SF
FA
Quartz sand
3.1
21.1
3 days
2.2
0.151
28.7
2.24
7.87
28 days
2.64
313.45
47.9
2.2. UHPC compositions and testing methods
UHPC has two main parts which are paste and aggregate particles. Typical UHPC mixtures are
given in Table 3. The paste volume is 57 vol.-% of UHPC. W/Fv is the volume of water to the volume
of fine materials (cementitious materials) ratio. The pozzolanic admixtures partially replace cement
in volume. Superplasticizer (SP) dosage is 1.1% in solid content of cementitious materials.
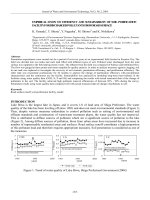
UHPC was mixed with a total mixing time of 13 minutes based on the sequence shown in Fig. 1.
Mini-cone slump flow of UHPC mixtures was determined 12 minutes after water addition. The slump
52
No
1
2
3
Items
Cement
SF
FA
Specific density, (g/cm3)
3.1
2.2
2.24
Mean particle size (µm)
21.1
0.151
7.87
Compressive strength of cement
3 days:
28.7
28 days:
(MPa)
An, V. V. T. / Journal of Science and Technology in Civil Engineering
2.2. UHPC compositions and testing methods
Quartz sand
2.64
313.45
47.9
Table are
3. Typical
proportions
of Typical
UHPC UHPC mixtures are given in Table
UHPC has two main parts which
paste andmix
aggregate
particles.
3. The paste volume is 57 vol.-% of UHPC. W/Fv is the volume of water to the volume of fine materials
(cementitious materials) ratio. The pozzolanic
admixtures partially replace cement in volume. Superplasticizer (SP)
Quartz
SF
FA
Total Water
Cement
dosage
is
1.1%
in
solid
content
of
cementitious
◦
sandmaterials.
N
w/b
Mixtures
W/Fv
UHPC was mixed with a total mixing time of 13 minutes
[kg/m3 ] based on the sequence shown in Fig. 1. Mini-cone
slump flow of UHPC mixtures was determined 12 minutes after water addition. The slump flow values were
measured
after further 2 minutes
50 mm3 were formed without0.191
vibration, kept in
1
75:15:10
855.0without stroking. Samples 50 x 50 x82.4
moulds at 27°C, 95% relative humidity (RH) for 24h and followed by storing at 27°C, 100% RH until examination.
2
65:15:20
741.0was tested in accordance
164.8
0.197
121.4
202.3
0.55
Compressive
strength of samples
with ASTM
C109.
3
55:15:30
541.5
4
75:15:10
883.5
5
6
7
765.7
o
N65:15:20
Mixtures
55:15:30
Table 3. Typical mix proportions
of UHPC
247.1
85.1
Quartz
Cement
1135.2 sand
75:15:10
855.0
2
65:15:20
741.0
914.0
8
365:15:2055:15:30792.1
9
455:15:3075:15:10670.2
883.5
5
765.7
6
65:15:20
55:15:30
SF
125.4
0.174
Total
190.0
Water
FA
170.2
[kg/m3]
647.9
1
75:15:10
0.203
255.4
0.185
0.191
82.4
121.4
129.7
541.5
88.1
164.8
176.1
247.1
125.4
647.9
0.156
202.3
0.197
176.9
0.203
0.161
0.55
0.45
0.174
0.166
85.1
264.2
1135.2
0.179 W/Fv0.50
w/b
170.2
190.0
0.179
0.50
0.185
255.4
flow values were measured after further 2 minutes without stroking. Samples 50 x 50 x 50 mm3 were
7
0.156
75:15:10
914.0
88.1
formed without vibration, kept in moulds at 27˚C, 95% relative humidity (RH) for 24h and followed
8
0.161
65:15:20
792.1 examination. 129.7
176.1 strength
176.9of samples
by storing
at 27˚C,
100% RH until
Compressive
was0.45
tested in
9
0.166
55:15:30
670.2
264.2
accordance with ASTM C109.
Cement +
Pozzolans +
Quartz Sand
1 min
85%
Water
+
50% SP
3 min
15%
Water
+
50% SP
9 min
UHPC
mixture
Figure 1. Mixing procedure of UHPC
Figure 1. Mixing procedure of UHPC
2.3. Mixture design model
2
Concrete is a multivariate system and n����������������������������������������������������������������������������������������������������������������������������������������������������������������������������������������������������������������������������������������������������������������������������������������������������������������������������������������������������������������������������������������������������������������������������������������������������������������������������������������������������������������������������������������������������������������������������������������������������������������������������������������������������������������������������������������������������������������������������������������������������������������������������������������������������������������������������������������������������������������������������������������������������������������������������������������������������������������������������������������������������������������������������������������������������������������������������������������������������������������������������������������������������������������������������������������������������������������������������������������������������������������������������������������������������������������������������������������������������������������������������������������������������������������������������������������������������������������������������������������������������������������������������������������������������������������������������������������������������������������������������������������������������������������������������������������������������������������������������������������������������������������������������������������������������������������������������������������������������������������������������������������������������������������������������������������������������������������������������������������������������������������������������������������������������������������������������������������������������������������������������������������������������������������������������������������������������������������������������������������������������������������������������������������������������������������������������������������������������������������������������������������������������������������������������������������������������������������������������������������������������������������������������������������������������������������������������������������������������������������������������������������������������������������������������������������������������������������������������������������������������������������������������������������������������������������������������������������������������������������������������������������������������������������������������������������������������������������������������������������������������������������������������������������������������������������������������������������������������������������������������������������������������������������������������������������������������������������������������������������������������������������������������������������������������������������������������������������������������������������������������������������������������������������������������������������������������������������������������������������������������������������������������������������������������������������������������������������������������������������������������������������������������������������������������������������������������������������������������������������������������������������������������������������������������������������������������������������������������������������������������������������������������������������������������������������������������������������������������������������������������������������������������������������������������������������������������������������������������������������������������������������������������������������������������������������������������������������������������������������������������������������
quadratic model should be satisfactory to represent
effectaof(+)
the indicate
mixture components
on the
Pointsthewith
replicates
predicted responses. The complete mixture quadratic model is in Eq (1).
7.5% ≤ B ≤ 22.5%
R = f(A, B, C)=1A+ 2B+3C+12AB+13AC+23BC
(1)
10% ≤ C
≤ 30%
where β1, β2, β3 are linear coefficients; β12, β13, β23 are cross product coefficients
The designing
produced
Design-Expert
7 are shownmodel
in Fig. 2. should
and Table 4.be
They
are the
The D-optimal design was chosen
andexperiments
assumed
thatbyathemixture
quadratic
satisactual mixture components. The complete model has 16 runs including 11 runs at different contents of the binder and
factory to represent the effect
of therunsmixture
components
the ratio
predicted
The
complete
5 replicated
to provide an
estimate of error. on
The W/Fv
of 0.55 wasresponses.
used in 16 mixtures
to make
sure all the
mixtures having sufficient flowability. The typical mix proportions of mixtures can be found in Table 3.
mixture quadratic model is in Eq.Experimental
(1). results of mini-cone flow (R1) and compressive strength at the age of 3 days (R2) and 28 days
(R3) of 16 mixtures are also given in Table 4.
R = f (A, B, C) = β1 A + β2 B + β3C + β12 AB + β13 AC + β23 BC
(1)
where β1 , β2 , β3 are linear coefficients; β12 , β13 , β23 are cross product coefficients.
The designing experiments produced by the Design-Expert 7 are shown in Fig. 2 and Table 4.
They are the actual mixture components. The complete model has 16 runs including 11 runs at
different contents of the binder and 5 replicated runs to provide an estimate of error. The W/Fv ratio
of 0.55 was used in 16 mixtures to make sure all the mixtures having sufficient flowability. The typical
mix proportions of mixtures can be found in Table 3. Experimental results of mini-cone flow (R1 )
and compressive strength at the age of 3 days (R2 ) and 28 days (R3 ) of 16 mixtures are also given in
Table 4.
3
3.2. Statistical analysis
The 16 designed mixtures of UHPC in Fig. 2 and Table 4 were mixed and tested the slump
flow, 3-d and 28-d compressive strength. The 16-designed run data is analyzed by Design-Expert
7. The first step in the analysis is to identify a suitable model. Even though the design selected the
mixture quadratic model, other model may be suggested by the software to have a better fitness for
the experimental data. With the input data, the fit summary suggests the mixture quadratic model for
the responses of the slump flow and 28-d compressive strength, and the mixture special cubic model
for the responses of 3-d compressive strength. The complete models are as follows:
R1 (flowability) = 52.78A − 1052.84B + 55.79C + 2392.61AB + 960.66AC + 1236.61BC
(2)
R2 (3d strength) = − 28.07A − 320.65B − 698.59C + 1173.44AB + 1619.68AC
+ 4624.61BC − 10027.21ABC
(3)
R3 (28d strength) = − 11.0A − 911.16B − 606.19C + 1645.72AB + 1306.93AC + 2064.31BC (4)
54
An, V. V. T. / Journal of Science and Technology in Civil Engineering
Table 4. 16-run D-optimal design with data
Run
1
2
3
4
5
6
7
8
9
10
11
12
13
14
15
16
Cement
SF
FA
Experimental
A [%]
B [%]
C [%]
R1 [mm]
R2 [MPa]
R3 [MPa]
60.0
55.0
47.5
70.0
72.5
62.5
57.5
67.5
65.0
82.5
82.5
47.5
67.5
62.5
72.5
75.0
15.0
15.0
22.5
15.0
7.5
7.5
22.5
22.5
15.0
7.5
7.5
22.5
22.5
7.5
7.5
15.0
25.0
30.0
30.0
15.0
20.0
30.0
20.0
10.0
20.0
10.0
10.0
30.0
10.0
30.0
20.0
10.0
292
305
283
262
260
290
280
263
273
200
205
280
257
285
272
258
56.2
52.3
51.4
66.1
76.5
70.7
57.7
79.1
63.2
61.3
62.5
52.1
78.8
69.3
74.2
69.9
110.3
102.1
92.3
109.5
101.5
95.9
109.2
104.8
120.5
79.5
81.5
94.8
106.9
93.8
103.8
104.8
The adequacy of the complete regression models (Eqs. (2), (3) and (4)) is assessed by using
some standards. Firstly, the analysis of variance (ANOVA) is used to check the significance of the
models. All of the models are significant. Their lacks of fit are not significant (Table 5, 6 and 7). The
Table 5. ANOVA for the complete mixture quadratic model of the workability
Source
Sum of
Squares
Df
Mean
Square
F Value
p-value
Prob ¿ F
Model
11604.88
5
2320.98
40.50
¡ 0.0001
Linear Mixture
8466.01
2
4233
73.87
¡ 0.0001
AB
584.73
1
584.73
10.20
0,0096
AC
277.63
1
277.63
4.84
0.0523
BC
121.57
1
121.57
2.12
0.1759
Residual
573.06
10
57.31
Lack of Fit
453.56
5
90.71
3.8
0.0848
Not significant
Pure Error
119.50
5
23.90
SD
7.57
Cor total
12177.94
15
Mean
266.56
R-Squared
0.9529
Adj R-Squared
0.9294
C.V%
2.84
Pred R-Squared
0.8885
Adeq Precision
19.987
PRESS
1357.34
55
significant
An, V. V. T. / Journal of Science and Technology in Civil Engineering
Table 6. ANOVA for the complete mixture special cubic model of the 3d strength
Source
Sum of
Squares
Df
Mean
Square
F Value
p-value
Prob ¿ F
Model
1335.83
6
222.64
154.39
¡ 0.0001
Linear Mixture
435.53
2
217.76
151.01
¡ 0.0001
AB
AC
1.69
136.86
1
1
1.69
136.86
1.17
94.91
0,3075
¡ 0.0001
BC
0.63
1
0.63
0.44
0.5248
ABC
175.90
1
175.90
121.98
¡ 0.0001
Residual
12.98
9
1.44
Lack of Fit
8.34
4
2.09
2.25
0.1987
Not significant
Pure Error
4.64
5
0.93
SD
1.20
Cor total
1348.80
15
Mean
65.08
R-Squared
Pred R-Squared
0.9904
0.9643
C.V%
PRESS
1.85
48.13
Adj R-Squared
Adeq Precision
0.9840
34.599
significant
adjusted R-squared and the predicted R-squared of the responses are suitable. Hence, these models
are adequate. Some of the coefficients in the complete models (Eqs. (2), (3) and (4)) are insignificant
and could be eliminated. In this case, there is no advantage to the reduced models because the adjusted
R-squared is only slightly changed. Moreover, the interactions should not be removed in the mixture
model, especially with the mixture quadratic model [18, 19]. Therefore, the complete models in the
Eqs. (2), (3) and (4) should be used for further navigations.
Table 7. ANOVA for the complete mixture quadratic model of the 28d strength
Source
Sum of
Squares
Df
Mean
Square
F Value
p-value
Prob > F
Model
1642.45
5
328.49
47.06
< 0.0001
Linear Mixture
254.23
2
127.12
18.21
0.0005
AB
276.65
1
276.65
39.63
< 0.0001
AC
513.84
1
513.84
73.61
< 0.0001
BC
338.78
1
338.78
48.53
< 0.0001
Residual
69.81
10
6.98
Lack of Fit
57.63
5
11.53
4.73
0.0566
Not significant
Pure Error
12.18
5
2.44
SD
2.64
Cor total
1712.26
15
Mean
100.70
R-Squared
0.9592
Adj R-Squared
0.9388
C.V%
2.62
Pred R-Squared
0.9061
Adeq Precision
21.322
PRESS
160.81
56
significant
An, V. V. T. / Journal of Science and Technology in Civil Engineering
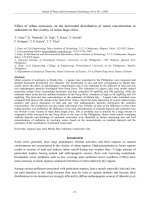
3.3. Influence of cementitious materials on the flowability of UHPC
To interpret the influence of the cementitious materials on the mini-cone slump flow of UHPC,
3D response surface and contour plots of the flowability response in dependence of cement, SF and
FA contents have been plot in Fig. 3.
Results in Fig. 3 show that increasing the FA content improves the workability of UHPC at all
levels of SF. At the low FA contents, the flowability of UHPC strongly increases when SF content
increases. But at the higher contents of FA, the flowability of UHPC increases initially and then
decreases when the SF content increases. Therefore, with the aim to obtain the maximum slump flow
of UHPC, it needs adjusting the variables to a high content of FA with an optimum content of SF
(Fig. 3).
An, V. V. T./ Journal of Science and Technology in Civil Engineering
An, V. V. T./ Journal of Science and Technology in Civil Engineering
Figure 3. Response surface and contour plots of flowability of UHPC
of cementitioussurface
materials on compressive
strength of UHPC
Figure3.4.3.Influence
Response
and contour
plots of flowability of UHPC
Similar to the flowability response, 3D response surface and contour plots of the 3-day and 28-day
compressive strength responses in dependence of cement, SF and FA contents have been present in Figs. 4, 5
respectively.
3.4. Influence of cementitious materials on compressive strength of UHPC
Similar
the surface
flowability
response,
Figureto
3. Response
and contour plots of
flowability of UHPC3D response surface and contour plots of the 3-day and 28-day
compressive strength responses in dependence of cement, SF and FA contents have been present in
Similar to the flowability response, 3D response surface and contour plots of the 3-day and 28-day
Figs.strength
4 and
5,in respectively.
compressive
responses
dependence of cement, SF and FA contents have been present in Figs. 4, 5
3.4. Influence of cementitious materials on compressive strength of UHPC
An, V. V. T./ Journal of Science and Technology in Civil Engineering
respectively.
Figure 4. Response surface and contour plots of 3-d compressive strength of UHPC
6
Figure 4. Response surface and contour plots of 3-d compressive strength of UHPC
Figure 5. Response surface and contour plots of 28-d compressive strength of UHPC
Figure 4. Response surface and contour plots of 3-d
compressive strength of UHPC
The results
4 illustrate that at the
low content ofand
FA, i.e contour
C=10%, the compressive
the age of
Figure
5.in Fig.
Response
surface
plotsstrength
of at28-d
3 days of UHPC increases when the content of SF increases. Meanwhile, at the SF content of 7,5%, the 3-d strength
compressive
UHPC
of UHPC initially increases
and then decreases duringstrength
the increase of theof
content
of FA. But at high contents of SF or
FA, the increase of the other mineral admixture will induce low 3-d compressive strength of UHPC (Fig. 4).
3D response surface and contour plots of the 28-day compressive strength response in Fig. 5 show that at any
of FA, compressive strength of UHPC initially increases and then decreases when the content of SF increases.
The results in Fig. 4 illustrate that at the lowcontent
FA,
i.e C
the
Andcontent
at any content of of
SF, there
is an optimized
content=
of FA10%,
which enables
UHPC compressive
containing SF to obtain the
6 highest compressive strength at the age of 28 days. It means that the highest compressive strength comes from a
strength at the age of 3 days of UHPC increases when
content
ofFA (Fig.
SF5). increases. Meanwhile, at
ternary binderthe
composed
of cement, SF and
3.5. Optimization of mix proportions of UHPC containing SF and FA
57
The optimization tool of the Design-Expert 7 software is inducted to find the optimal proportions of UHPC
containing SF and FA. The input criteria are present in Table 8. The program offers some solutions. The best solution
is chosen in terms of the highest compressive strength (Table 8).
The results of the slump flow, compressive strength of the experimental mixture and Design-Expert’s mixture
in Table 8 are similar. Thus, UHPC with the binder containing 15 vol.-% SF and 20 vol.-% FA is selected as the
optimal mix proportions.
Table 8. Experimental proportions versus optimized proportions
The mix proportions having the
An, V. V. T. / Journal of Science and Technology in Civil Engineering
the SF content of 7,5%, the 3-d strength of UHPC initially increases and then decreases during the
increase of the content of FA. But at high contents of SF or FA, the increase of the other mineral
admixture will induce low 3-d compressive strength of UHPC (Fig. 4).
3D response surface and contour plots of the 28-day compressive strength response in Fig. 5 show
that at any content of FA, compressive strength of UHPC initially increases and then decreases when
the content of SF increases. And at any content of SF, there is an optimized content of FA which
enables UHPC containing SF to obtain the highest compressive strength at the age of 28 days. It
means that the highest compressive strength comes from a ternary binder composed of cement, SF
and FA (Fig. 5).
3.5. Optimization of mix proportions of UHPC containing SF and FA
The optimization tool of the Design-Expert 7 software is inducted to find the optimal proportions
of UHPC containing SF and FA. The input criteria are present in Table 8. The program offers some
solutions. The best solution is chosen in terms of the highest compressive strength (Table 8).
The results of the slump flow, compressive strength of the experimental mixture and DesignExpert’s mixture in Table 8 are similar. Thus, UHPC with the binder containing 15 vol.-% SF and 20
vol.-% FA is selected as the optimal mix proportions.
Table 8. Experimental proportions versus optimized proportions
N◦ Material
Variable
Goal
Constrains
Unit
The mix proportions having
the highest strength
Design-Expert
1
Cement
2
SF
3
4
5
6
FA
A
B
C
Slump flow
Comp. strength at 3d
Comp. strength at 28d
47.5-82.5
In range
7.5-22.5
10.0-30.0
In range
200-305
In range
51.4-79.1
Maximum 79.5-120.5
63.4
[vol.-%] 17.3
[mm]
[MPa]
19.3
283
61.0
116.8
Experimental
65
15
20
273
63.2
120.5
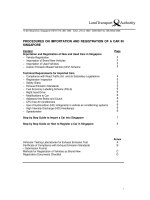
3.6. High-volume fly ash UHPC
The compressive strength at the age of 28 days of the selected UHPC in section 3.3 is still lower
than 130 MPa. This mixture has a W/Fv of 0.55 with very high mini-cone slump flow. With the
purpose of producing UHPC containing high volume of FA, workability and compressive strength of
UHPC containing 15% SF with different contents of FA and W/Fv ratios are shown in Table 9 and
Fig. 6.
The results in Table 9 and Fig. 6(a), (b), (c) show that at the same water content, the more the FA
content, the higher the flowability and the lower the compressive strength at the ages of 3 and 7 days.
At the W/Fv ratios of 0.55 and 0.50, UHPC possesses the highest 28-d compressive strength at the FA
content of 20%. Meanwhile, the 28-d strength of mixture with the W/Fv ratio of 0.45 still increases
when the FA content increases (Table 9 and Fig. 6(d)). Normally, when the water content decreases,
the workability of the mixture reduces. The flowability of the mixtures dramatically decreases at
the W/Fv ratio of 0.45. With the same cementitious content, UHPC has the maximum strength at
58
An, V. V. T. / Journal of Science and Technology in Civil Engineering
An, V. V.and
T./ Journal
of Science
and of
Technology
Civil Engineering
Table 9. Workability
compressive
strength
UHPC at in
different
FA and water contents
3.6. High-volume fly ash UHPC
Compressive strength, MPa
Mixture
W/Fvat the
Workability,
mmof the selected UHPC in section 3.3 is still lower than 130
N◦ The
compressive strength
age of 28 days
3 slump
days flow. With
7 days
28 days UHPC
MPa. This mixture has a W/Fv of 0.55 with very high mini-cone
the purpose of producing
containing high volume of FA, workability and compressive strength of UHPC containing 15% SF with different
75:15:10
258
69.9
92.6
104.8
1
contents of FA and W/Fv ratios are shown in Table 9 and Fig. 6.
2
3 No
4 1
5 2
3
4
7 5
8 6
7
9 8
9
6
65:15:20
0.55
273
63.2
83.5
120.5
Table 9. Workability and compressive strength of UHPC at different FA and water contents
Compressive
55:15:30
305Workability, mm
52.3
75.8strength, MPa102.1
Mixture
W/Fv
3 days
7 days
28 days
75:15:10
245
79.1
118.7
132.8
75:15:10
258
69.9
92.6
104.8
65:15:20
0.55
273
63.2
83.5
120.5
65:15:20
270
73.7
104.0
142.7
0.50
55:15:30
305
52.3
75.8
102.1
55:15:30
295
68.5
96.8
135.5
75:15:10
245
79.1
118.7
132.8
75:15:10
190
74.8
101.6
107.2
65:15:20
0.50
270
73.7
104.0
142.7
55:15:30
295
68.5
96.8
135.5
65:15:20
235
68.3
80.5
115.3
0.45
75:15:10
190
74.8
101.6
107.2
55:15:30
245
55.9
72.3
121.3
65:15:20
0.45
235
68.3
80.5
115.3
55:15:30
245
55.9
72.3
121.3
a
b
c
d
Figure 6.
6. Effect
Effect of
: a)a)Flowability
; b)b)3-d
; c)c)7-d
Figure
of FA
FA content
contentand
andW/Fv
W/Fvonon:
Flowability;
3dstrength
strength;
7d strength
strengthand
andd)d)28-d
28dstrength
strength
The results in Table 9 and Fig. 6a, b, c show that at the same water content, the more the FA content, the
higher the flowability and the lower the compressive strength at the ages of 3 and 7 days. At the W/Fv ratios of 0.55
the W/Fv ratio of 0.50. At the W/Fv ratio of 0.50, the 28-d compressive strength of the mixture
and 0.50, UHPC posseses the highest 28-d compressive strength at the FA content of 20%. Meanwhile, the 28-d
containing
20%FA
over
MPastill
and
the mixture
containing
FA has
the9 strength
of
strength
of mixture
withobtains
the W/Fv
ratio140
of 0.45
increases
when the
FA content30%
increases
(Table
and Fig. 6d).
Normally, when the water content decreases, the workability of the mixture reduces. The flowability of the mixtures
dramatically decreases at the W/Fv ratio of 0.45. With the same cementitious content, UHPC has the maximum
59
strength at the W/Fv ratio of 0.50. At the W/Fv ratio of 0.50, the 28-d compressive strength of the mixture containing
20%FA obtains over 140 MPa and the mixture containing 30% FA has the strength of 135.5 MPa. Therefore, the
An, V. V. T. / Journal of Science and Technology in Civil Engineering
135.5 MPa. Therefore, the high-volume fly ash ultra-high performance concrete can be produced
from a ternary binder containing 15 vol.-% SF and 30 vol.-% FA at the W/Fv ratio of 0.50.
4. Conclusions
The following conclusions can be drawn from the results of this study:
- The mixture models of flowability and compressive strength of UHPC with the binder containing
three mixture components of cement, fly ash and silica fume using D-optimal design of Design-Expert
7 fitted well with the experimental data. It can be analyzed the influence of the variables on the
workability and compressive strength of UHPC by using 3D response surface and contour plots.
- Fly ash improves flowability and reduces compressive strength of UHPC at the early age of 3
days. At the age of 28 days, the ternary binder composed of 65 vol.-% cement, 15 vol.-% SF and 20
vol.-% FA at the W/Fv ratio of 0.50 is the optimum mixture proportions for the highest compressive
strength of the UHPC in this study.
- With the purpose of using as much as FA in UHPC, high-volume fly ash ultra high performance
concrete with a good flowability and 28-d compressive strength over 130 MPa can be produced with
fly ash content up to 30 vol.-% in the binder.
References
[1] Resplendino, J. (2012). State of the art of design and construction of UHPFRC structures in France. In
Proceedings of Hipermat-3rd International Symposium on UHPC and Nanotechnology for Construction
Materials, 27–41.
[2] Schmidt, M. (2012). Sustainable building with ultra-high-performance concrete (UHPC)–Coordinated
research program in Germany. In Proceedings of Hipermat 2012 3rd International Symposium on UHPC
and Nanotechnology for High Performance Construction Materials, Kassel University Press, Kassel,
Germany, 17–25.
[3] Schmidt, M. and Fehling, E. (2005). Ultra-high-performance concrete: research, development and application in Europe. In The 7th International Symposium on the Utilization of High-Strength- and HighPerformance-Concrete, ACI Washington, 51–78.
[4] Schmidt, M. (2007). Von der Nanotechnologie zum Ultra-Hochfesten Beton. In The 16th International
Conference on Building Materials, number 2, Weimar, Germany, 1405–1416. (in German).
[5] Shah, S. P. (1993). Recent trends in the science and technology of concrete. Concrete Technology: New
Trends, Industrial Applications - Proceedings of the International RILEM 26, (26):1–18.
[6] Yu, R., Spiesz, P., and Brouwers, H. (2015). Development of an eco-friendly Ultra-High Performance
Concrete (UHPC) with efficient cement and mineral admixtures uses. Cement and Concrete Composites,
55:383–394.
[7] Kim, H., Koh, T., and Pyo, S. (2016). Enhancing flowability and sustainability of ultra high performance
concrete incorporating high replacement levels of industrial slags. Construction and Building Materials,
123:153–160.
[8] Ferdosian, I., Cam˜oes, A., and Ribeiro, M. (2017). High-volume fly ash paste for developing ultra-high
performance concrete (UHPC). Ciˆencia & Tecnologia dos Materiais, 29(1):e157–e161.
[9] Chung, D. D. L. (2002). Review: Improving cement-based materials by using silica fume. Journal of
Materials Science, 37(4):673–682.
[10] Gatty, L., Bonnamy, S., Feylessoufi, A., Clinard, C., Richard, P., and Van Damme, H. (2001). A transmission electron microscopy study of interfaces and matrix homogeneity in ultra-high-performance cementbased materials. Journal of Materials Science, 36(16):4013–4026.
[11] Chan, Y. W. and Chu, S. H. (2004). Effect of silica fume on steel fiber bond characteristics in reactive
powder concrete. Cement and Concrete Research, 34(7):1167–1172.
60
An, V. V. T. / Journal of Science and Technology in Civil Engineering
[12] Papadakis, V. G. (1999). Experimental investigation and theoretical modeling of silica fume activity in
concrete. Cement and Concrete Research, 29(1):79–86.
[13] Richard, P. and Cheyrezy, M. (1995). Composition of reactive powder concretes. Cement and Concrete
Research, 25(7):1501–1511.
[14] De Larrard, F. and Sedran, T. (1994). Optimization of ultra-high-performance concrete by the use of a
packing model. Cement and Concrete Research, 24(6):997–1009.
[15] Park, J. J., Kang, S. T., Koh, K. T., and Kim, S. W. (2008). Influence of the ingredients on the compressive
strength of UHPC as a fundamental study to optimize the mixing proportion. In Proceedings of the 2nd
International Symposium on Ultra High Performance Concrete, Germany Kassel, 105–112.
[16] Gerlicher, T., Leonhardt, S., Heinz, D., and Urbonas, L. (2009). Einfluss des Steinkohlenflugascheeinsatzes auf die Frisch-und Festbetoneigenschaften von ultrahochfestem Beton. In The 17th International
Conference on Building materials (ibausil), Weimar, Germany, (1)1091–(1)1098.
[17] Yazıcı, H., Yardımcı, M. Y., Aydın, S., and Karabulut, A. S¸. (2009). Mechanical properties of reactive powder concrete containing mineral admixtures under different curing regimes. Construction and
Building Materials, 23(3):1223–1231.
[18] Myers, R. H., M., C., D., and Anderson-Cook, C. M. (2009). Response surface methodology: process
and product optimization using designed experiments. Third edition, Wiley.
[19] Anderson-Cook, C. M., Goldfarb, H. B., Borror, C. M., Montgomery, D. C., Canter, K. G., and Twist,
J. N. (2004). Mixture and mixture–process variable experiments for pharmaceutical applications. Pharmaceutical Statistics, 3(4):247–260.
61