Experimental study on ultimate strength of normal sections in reinforced concrete beams
Bạn đang xem bản rút gọn của tài liệu. Xem và tải ngay bản đầy đủ của tài liệu tại đây (2.13 MB, 9 trang )
RESEARCH RESULTS AND APPLICATIONS
EXPERIMENTAL STUDY ON ULTIMATE STRENGTH
OF NORMAL SECTIONS IN REINFORCED CONCRETE BEAMS
Nguyen Truong Thang1*, Nguyen Viet Phuong2
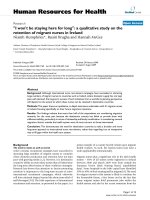
Abstract: This paper presents an experimental programme conducted on a number of six reinforced concrete (RC) beams in order to investigate the developments of strain and stress, moment-curvature relationship, failure mode and the ultimate strength on normal sections (USoNS) of this type of basic structural
element. The beam specimens were 120mm × 200mm in cross section and 2.2m in length. They were
divided into three series with the longitudinal reinforcement ratio varied from 0.42, 0.65 and 0.94%. There
were two identical beams in each series. The experimental data were incorporated to validate the results calculated based on various design codes for RC structures including ACI 318- 11, EN 1992-1-1:2004, TCVN
5574:2012 and SP 63.13330.2012. The up-to-date Russian code SP 63.13330.2012, which is currently used
as a basis for drafting the new Vietnamese code to replace TCVN 5574:2012, also adopts the plane strain
assumption and the simplified stress-strain relationships of materials in the calculation based on non-linear
deformation model similar to ACI and EC2. It is shown that such assumption and design procedure for
USoNS specified in SP 63.13330.2012 can be applied with reliability for specimens made and tested in
Vietnam condition.
Keywords: Strength, bending moment, normal section, beam, reinforced concrete.
Received: October 1st, 2017; revised: October 16th, 2017; accepted: November 2nd, 2017
1. Introduction
Reinforced concrete (RC) beams are among the flexural elements commonly used in the structural
systems of civil and industrial buildings, bridges, ports, etc. In RC beams, longitudinal reinforcement and
stirrups are designed based on the ultimate limit states that to avoid failure occurred on normal sections (due
to bending moment) and on inclined sections (due to shear force), respectively.
In the determination of ultimate strength on normal sections (which will be hereafter abbreviated as
USoNS) in RC beams, simplified assumptions and calculation principles are developed in various national
and regional design codes. However, there have been different approaches among the codes. The previous
Russian code [1] as well as the current Vietnamese code for design of concrete structures [2] use stress-based
principle whereas the codes of Western countries [3,4] adopt the plane strain assumption to determine the
bending moment resistance of RC beams. Recently, the new Russian code [5] has also accepted the plane
strain assumption for the calculation based on non- linear deformation model like those of the US [3] and the
EU [4]. Since SP 63.13330.2012 is currently used as a basis for drafting the new Vietnamese code to replace
TCVN 5574:2012, it is important to study on the reliability of applying SP 63.13330.2012 into Vietnam condition.
This fact motivated the authors to conduct an experimental study on a fair number of test specimens
in order to investigate the developments of strain and stress, moment-curvature relationship, failure mode
and the USoNS in RC beams. The six beam specimens had identical lengths of 2.2m and cross sections of
120mm×200mm. They were divided into three series with the longitudinal reinforcement ratio varied from
0.42, 0.65 and 0.94%. B25-30 concrete and AII-AIII-type reinforcement were used. The experimental data
are compared to the results calculated based on [2-5]. Test results and the discussions on the parameters
affecting the flexural behavior and strength, as well as on the reliability of calculating the USoNS of the test
specimens based on SP63 will be presented in the latter part of the paper.
Dr, Faculty of Building and Industrial Construction, National University of Civil Engineering.
Postgraduate student, Graduate School, National University of Civil Engineering.
* Corresponding author. E-mail:
1
2
44
Vol. 11 No. 6
11 - 2017
JOURNAL OF SCIENCE AND TECHNOLOGY IN CIVIL ENGINEERING
RESEARCH RESULTS AND APPLICATIONS
2.Theoretical ultimate strength on normal sections in RC beams
Fig. 1(a) shows a simply-supported RC beam carrying its self-weight and two symmetric point loads P
that are gradually increased from zero till the beam fails by means of bending moment on the normal section
A-A at its mid-span.
Figure 1. RC beam subjected to bending moment
The maximum bending moment Mu that the beam can sustain at section A-A, so-called the USoNS,
is basically formed by the internal-force couple of C and T that are respectively contributed by concrete in
compression zone and by longitudinal reinforcement located in the opposite side of the cross section with
the application of certain failure criteria (Fig. 1(b)). The theoretical developments of strains and stresses in
concrete and reinforcement as well as the calculation of Mu based on various national design codes for RC
structures mentioned in Section 1 will be presented hereafter.
2.1 TCVN 5574:2012
The Vietnamese code for design of RC structures TCVN 5574:2012 was established based on the
previous version of Russian code SNIP 2.03.01-84. The flexural behavior of RC beams is specified in the
associated materials of the code as shown in Fig. 2 [1,2,6].
Figure 2. Flexural behavior and strength calculation of RC beams to TCVN 5574:2012
JOURNAL OF SCIENCE AND TECHNOLOGY IN CIVIL ENGINEERING
Vol. 11 No. 6
11 - 2017
45
RESEARCH RESULTS AND APPLICATIONS
It can be seen in Fig. 2 that in Stage I, when bending moment is small (Me), concrete can be considered elastic and normal stress distributes linearly along the normal section A-A in Fig. 1. When moment is increased, plastic strain develops in concrete and the stress contribution becomes nonlinear. As tensile stress
σbt in the extreme fiber of concrete reaches tensile strength Rbt, crack occurs. In order to avoid cracking in
the beam, bending moment shall not be greater than Mc meaning that the normal tensile stress does not
reach Rbt in this Stage Ia. When moment is further increased, cracks occur in the tensile zone and develop
upward, all the tensile forces are sustained by longitudinal reinforcement with cross-sectional area of As with
tensile strength σs
much reinforcement (μs>μmax) that the tensile stress is still small whereas σb reaches Rb, the beam would
have failed in brittle mode, which is not the expected failure criteria (Stage IIIa). Hence, the longitudinal reinforcement shall be limited (μs≤μmax) so that σs reaches Rs at Stage IIa (with the associated yielding moment
My) before σb reaches Rb at Stage III, at which ductile failure occurs. Hence, the USoNS Mu is specified in
TCVN 5574:2012 following the path Stages I→Ia→II→IIa→III.
It is noteworthy that there is no material stress-strain relationship and plane strain assumption specified for strength calculation in TCVN 5574:2012. Hence, the code can be referred to be using stress-based
principle in the determination of USoNS.
2.2 ACI 318-11 and EN 1992-1-1:2004 (EC2)
Different from SNIP 2.03.01-84 and TCVN 5574:2012, the stress-strain relationships of concrete and
reinforcing steel are both explicitly provided in ACI 318-11 and EC2. Figs. 3 and 4 respectively depict the
EC2 material models for concrete and reinforcing steel as an example.
Figure 3. Compressive stress-strain relationship of concrete specified in EC2
Figure 4. Stress-strain relationship of reinforcing steel specified in EC2
The codes also adopt the following assumptions in flexural theory [7,8]: (i) Sections perpendicular
to the axis of bending that are plane before bending remain plane after bending (plane strain assumption);
(ii) The strain in reinforcement is equal to that in concrete at the same distance to the neutral axis; (iii) The
stresses in concrete and reinforcement can be computed from the strains using stress-strain relationships
for concrete and reinforcing steel (Figs. 3,4); (iv) The tensile strength of concrete is neglected in flexural
strength calculation; (v) Concrete is assumed to fail when a maximum compressive strain reaches a limiting
value; and (vi) The compressive stress-strain relationship of concrete may be based on stress-strain curves
46
Vol. 11 No. 6
11 - 2017
JOURNAL OF SCIENCE AND TECHNOLOGY IN CIVIL ENGINEERING
RESEARCH RESULTS AND APPLICATIONS
or may be assumed to be rectangular, trapezoidal, parabolic or any other shape that results in prediction of
strength in substantial agreement of the results of compressive tests.
The flexural behavior of RC beams is specified in ACI 318-11 and EC2 in the form of moment- curvature diagram as shown in Fig. 5. Flexural tension cracking occurs in the section when the stress in the
extreme tension fiber reaches the modulus of rupture with the associated cracking moment Mc. Up to this
cracking point (C), the moment-curvature relationship is linear and can be referred to as the uncracked-elastic range of behavior. The moment and curvature at cracking can be calculated directly from elasticity. The
yielding point (Y) represents the end of the elastic range of behavior. As the moment applied to the section
continues to increase after the cracking point, the tension stress in the reinforcement and the compression
stress in the concrete compression zone will steadily increase. Eventually, either the steel or the concrete will
reach its respective capacity and start to yield (steel) or crush (concrete). Because the section under consideration here is assumed to be under-reinforced, the steel will yield before the concrete reaches its maximum
useable strain. To calculate moment My and curvature values for the yield point, the strain at the level of the
tension steel is set equal to the yield strain. Beyond the yield point, additional points on the moment-curvature relationship can be determined by steadily increasing the maximum strain in the extreme compression
fiber until the ultimate point (U) is reached corresponding to a maximum value of compression strains. ACI
318-11 and EC2 respectively specify a maximum useable compression strain of 0.0030 and 0.0035 at which
the ultimate moment strength of the section is to be calculated [7,8].
Figure 5. Flexural behavior and strength calculation of RC beams to ACI 318-11 and EC2
The ultimate compression strain at extreme concrete fiber εcu, coefficient of the equivalent height of
concrete compressive stress block β1 (ACI 318-11) and λ (EC2), and the equivalent concrete ultimate stress
σcu (Fig. 5) specified in ACI 318-11 and EC2 are shown in Table 1 [7-9].
Table 1. Values for calculating Mu
ACI 318-11
εcu=0.0030;
β1=0.85-0.05(f’c-28MPa)/7MPa;
0.65≤β1≤0.85;
σcu=0.85f’c
EC2
εcu=0.0035;
λ=0.8-(fck-50)/400≤1.0;
σcu=η0.85fck/γc;
η=1.0-(fck-50)/200≤1.0
JOURNAL OF SCIENCE AND TECHNOLOGY IN CIVIL ENGINEERING
Vol. 11 No. 6
11 - 2017
47
RESEARCH RESULTS AND APPLICATIONS
2.3 SP 63.13330.2012
SP 63.13330.2012 [5] is a set of design principle rules for concrete and reinforced concrete structures
issued by Ministry of Regional Development of the Russian Federation in 2012. This is the current design
code in Russia. The code provides similar calculation procedure for ultimate strength Mu on normal sections
like that of TCVN 5574:2012 (Fig. 2). The only difference is that the limiting value ξR of the relative height of
the compression zone is now purely dependent on strain εs,el of tensile reinforcement at stress equal to Rs
and strain εb2 of compressive reinforcement at stress equal to Rb.
At the same time, SP63 also specifies that the design of RC members based on non-linear deformation model can be performed based on the stress-strain relationships of concrete and reinforcement using
flat cross-section hypothesis as a base. Reaching of ultimate strains in concrete and reinforcement is considered as strength condition of a normal section. Bilinear stress-strain diagrams of concrete and reinforcing
steel shown in Fig. 6 can be used for simplification [5].
Figure 6. Simplified stress-strain relationship of material specified in SP 63.13330.2012
In Fig. 6, the strain values are specified as follows: εb1=σb1/Eb, εb2=0.0035 for compressive strength
class of concrete В60 and lower, εs0=Rs/Es, and εs2=0.015.
It can be seen that SP63 approaches the ACI 318-11 and EC2 in some aspects so that it also allows
for more-flexible and explicit determination of ultimate strength Mu on normal sections. These theoretical
results will be validated by the experimental study presented in the next sections.
3.Experimental programme
3.1 Test specimens
The experimental study presented herein was conducted in the Laboratory of Construction Testing
and Inspection (National University of Civil Engineering - NUCE) in July, 2017. A total number of six RC
beam specimens were divided into three series and were cast with the details shown in Fig. 7.
Figure 7. Details of beam specimens
All the specimens had identical cross-section of 120 × 200mm and the same length of 2.2m.
There was 1Φ6 (No.2) on the top side for hanging purpose. The triangle stirrups No.3 were ϕ6@60 along
850mm-segments at two ends and ϕ6@150 along the mid-span segment. This was to avoid the shear failure
of the specimens. Steel plates No.4 were located at supports (R1 and R2) and at point loads (P1 and P2)
to avoid local failure. There were three steel strain gauges (S7, S8, S9) fixed on the longitudinal reinforcing
bars at mid-span. Another three concrete strain gauges (S10, S11, S12) were attached on the surface of the
beam within the compression zone as shown in Fig. 7(b).
The respective amount of 597, 1207, and 430kg of Red river sand, 1-2 size gravel and PC-30 cement
as well as 197 liter of clean water were used for the design mixture of 1m3 concrete.
48
Vol. 11 No. 6
11 - 2017
JOURNAL OF SCIENCE AND TECHNOLOGY IN CIVIL ENGINEERING
RESEARCH RESULTS AND APPLICATIONS
The only difference between the series was the two longitudinal reinforcing bars at bottom (No.1),
which were 2ϕ8, 2ϕ10 and 2ϕ12 for Series 1, 2 and 3, respectively. It is noted that both cube and cylinder
concrete samples were cast for each beam specimens so that the 28-day concrete strengths specified in
various codes could be determined individually. Table 2 shows the categorization and the material properties
obtained from material tests for each specimen.
Table 2. Categorization of test specimens
No
1
2
3
4
5
6
Test
series
Series 1
Series 2
Series 3
Specimen
Rebar
No.1
D1.1-2ϕ8
2 ϕ8
D1.2-2ϕ8
2 ϕ8
D2.1-2ϕ10
2ϕ10
D2.2-2ϕ10
2ϕ10
D3.1-2ϕ12
2ϕ12
D3.2-2ϕ12
2ϕ12
As
(mm2)
μs
(%)
100.5
0.42
157.1
0.65
226.2
0.94
fcube
(MPa)
fcylinder
(MPa)
fy
(MPa)
30.5
23.9
374.0
36.9
29.5
409.8
37.5
30.0
328.5
34.3
26.3
341.2
29.1
22.9
406.7
19.8
15.6
412.0
It should be noted in Table 2 that there was a significant reduction in concrete strength of specimen
D3.2-2ϕ12. This was due to the poor quality of the concrete casting of the last specimen in an individual
batch. Besides, the tensile strength of ϕ10 re-bars was also lower than those of ϕ8 and ϕ12.
3.2 Test set-up and apparatus
The elevation view and an image of the test set-up are shown in Fig. 8.
Figure 8. Test set-up
In the test, the 2.2m-length specimen was singly supported over a span of 2.0m and was subjected
to two symmetrical concentrated loads at points P1 and P2 which were both at a distance of 0.75m from the
supports R1 and R2. The loads were generated by means of a steel beam SB, which was in turn subjected
to a point load P at its mid-span. The load P was from the hydraulic jack HJ and a steel frame installed over
the specimen. A load cell LC was fixed between the hydraulic jack and the steel frame to measure the load
applied during the test.
A total number of five Linear Variable Deformation Transducers (LVDTs) were installed in the test. LVDTs
I1, I3, I2 were to measure the vertical displacements at supports R1, R2, and the beam mid- span, respectively.
LVDTs I4 and I5 were for the measurement of concrete strains at extreme tension and compression fibers on
the normal section at mid-span of the beam, with the measured lengths of 600 and 150mm, respectively.
All the apparatus were connected to a data logger TDS-530 and a computer to record the test data.
3.3 Test procedure
After the reinforcement tensile strength and the 28-day concrete strength were obtained (Table 2), the
theoretical ultimate strengths Mcode on normal section of the test specimens were theoretically predicted
based on ACI 318-11, EC2, TCVN 5574:2012 and SP63. It should be noted that all the partial safety factors
for material strengths were conventionally set to unity in the calculation of the test specimens. Results are
shown in Table 3.
JOURNAL OF SCIENCE AND TECHNOLOGY IN CIVIL ENGINEERING
Vol. 11 No. 6
11 - 2017
49
RESEARCH RESULTS AND APPLICATIONS
Table 3. Theoretical ultimate strength Mcode (kNm)
No
Test series
1
Series 1
2
3
Series 2
4
5
Series 3
6
Specimen
ACI 318-11
EC2
TCVN 5574:2012
SP63
D1.1-2ϕ8
6.882
6.842
6.934
6.930
D1.2-2ϕ8
6.942
6.898
6.995
6.975
D2.1-2ϕ10
9.122
9.047
10.885
10.172
D2.2-2ϕ10
9.060
8.992
10.067
9.137
D3.1-2ϕ12
15.097
14.790
15.353
15.222
D3.2-2ϕ12
14.403
13.964
14.772
14.522
All the tests were conducted at Laboratory of Construction Testing and Inspection (NUCE) after 30
days of the cast of the specimens. For each specimen, the corresponding maximum applied load at failure
in the test was predicted as Pmax=2(Mcode-0.125gL2)/L1 where g is the uniformly distributed self- weight of the
beam, L is the beam span L=2.0m, and L1 is the distance from the point loads to the supports L1=0.75m. In
the test, a pre-loading of 0.05Pmax was applied and released to eliminate all the gaps existed in the system
and to check whether all the apparatus work properly. Then, the load was again increased gradually in an
interval of 5%Pmax and all the data were recorded in every two seconds until the beam specimens failed.
4. Test results and discussions
4.1 Developments of strain and stress on normal section
The development of flexural strains along
the mid-span normal section can be observed by
apparatus including steel strain gauges S7, S8,
concrete strain gauges S9, S10, S11 (Fig. 7),
LVDTs I4 at extreme tensile concrete fiber and I5
at extreme compressive concrete fiber (Fig. 8).
Fig. 9 depicts the strain data obtained
from specimen D1.1-2ϕ8. The following observations can be made: (i) The strains distribute
accordingly with the distance from the measured points to the neutral axis; and (ii) Strains
at the points having the same distance to neutral axis are similar (S7 vs. S8 and S9 vs. S10).
Figure 9. The development of strain along the normal
Similar observations are also obtained
section of D1.1-2ϕ8
from the other specimens. It can be seen that
strains at both tensile reinforcing bars and extreme compressive concrete fibers develop more rapidly in the
specimens having lower ratios of longitudinal reinforcing bars.
The distributions of flexural strains along the mid-span normal section at certain load levels of specimen D1.1-2ϕ8 are shown in Fig. 10.
It can be observed from Fig. 10 that the linear strain distribution is more obvious in the initial and the
intermediate stages of the test. In the latter stage, although the plane strain assumption is not so accurate
due to concrete cracking but it is still within an acceptable tolerance.
The stress development is based on the stress-strain relationships given in the codes.
Figure 10. The distribution of strain along the normal section of D1.1-2ϕ8
50
Vol. 11 No. 6
11 - 2017
JOURNAL OF SCIENCE AND TECHNOLOGY IN CIVIL ENGINEERING
RESEARCH RESULTS AND APPLICATIONS
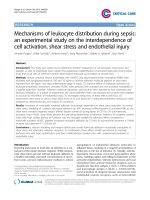
4.2 Moment-curvature diagrams
The experimental moment-curvature diagrams of the specimens can be constructed based
on the following parameters: (i) The applied moment M=0.5PL1+0.125gL2 where P is the record of
the load cell LC; the terms L1=0.75m, g=0.6kN/m
and L=2.0m as explained in Section 3.3; and (ii)
The curvature is determined from the linear distribution of strains along the normal section.
The theoretical moment-curvature diagrams of the specimens are determined based
on ACI 318-11, EC2 and SP63 as introduced in
Section 2. It is noted that TCVN 5574:2012 does
not produce specific moment-curvature diagram
due to the stress-based nature of the code in the
USoNS determination.
Figure 11. Experimental and theoretical momentcurvature diagrams of D1.1-2ϕ8
The experimental and theoretical moment-curvature diagrams of D1.1-2ϕ8 are shown
in Fig. 11, from which relative good agreement between the codes and the test result can be observed.
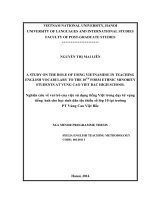
4.3 Failure mode
Fig. 12 shows the images of all the tested
specimens, which all failed with excessive midspan deflection.
Figure 12. Images of failed specimens
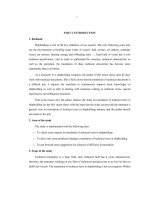
Fig. 13 shows the zoom-in images of the
front and the rear sides at mid-span area of a typical failed specimen. The ductile failure mode can
be clearly observed with excessive normal cracks
in tension zone occurred before the crushing at
extreme concrete fiber in compression zone.
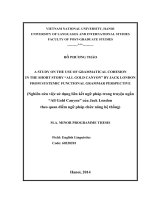
4.4 Ultimate strength on normal sections
The ACI 318-11, EC2 and SP63 experimental ultimate strengths Mtest of the test specimens can be determined based on the strain at
extreme compressive concrete fiber measured
by LVDT I5 (Figs. 8 and 11) when it reached the
respective limiting values of 0.0030, 0.0035 and
0.0035 by definition [3-5]. It is difficult to determine the Mtest of TCVN 5574:2012 since there is
no such criteria of limiting concrete compressive
strain specified in the code. Hence, the maximum bending moments obtained in the tests can
be referred to as the TCVN 5574:2012 experimental ultimate strength. The experimental relationships between the applied bending moment
and extreme concrete compressive strain of all
the specimens are shown in Fig. 14.
Figure 13. Failure at mid-span
Figure 14. Experimental relationship between moment
and extreme concrete compressive strain
All the test results of Mtest are shown in Table 4. The agreement ratios Mcode/Mtest between the theoretical value shown in Table 3 and the corresponding experimental value are shown in the brackets.
It can be seen from Table 4 that the mean values of the agreement ratios between the theoretical and
the test results of ACI 318-11, EC2, TCVN 5574:2012 and SP63 are 0.980, 0.937, 0.848, and 0.956 with the
coefficients of variable (COV) of 0.009, 0.011, 0.043, and 0.014, respectively. Hence, relatively good and
conservative agreement was obtained from the experimental programme.
JOURNAL OF SCIENCE AND TECHNOLOGY IN CIVIL ENGINEERING
Vol. 11 No. 6
11 - 2017
51
RESEARCH RESULTS AND APPLICATIONS
Table 4. Experimental validation of ultimate strength Mtest (kNm) and Mcode/Mtest
No
Test series
1
Series 1
2
3
Series 2
4
5
Series 3
6
ACI 318-11
Mtest (Mcode/Mtest)
EC2
Mtest (Mcode/Mtest)
TCVN 5574:2012
Mtest (Mcode/Mtest)
SP63
Mtest (Mcode/Mtest)
D1.1-2ϕ8
7.084 (0.971)
7.459 (0.917)
9.484 (0.731)
7.459 (0.929)
D1.2-2ϕ8
7.384 (0.940)
7.796 (0.885)
9.671 (0.723)
7.796 (0.895)
D2.1-2ϕ10
9.146 (0.997)
9.484 (0.954)
13.795 (0.789)
9.484 (0.967)
Specimen
D2.2-2ϕ10
9.221 (0.983)
9.334 (0.963)
10.346 (0.973)
9.334 (0.979)
D3.1-2ϕ12
15.409 (0.980)
15.371 (0.962)
16.984 (0.904)
15.371 (0.990)
D3.2-2ϕ12
14.246 (1.011)
14.846 (0.921)
15.296 (0.966)
14.846 (0.978)
Mean
(0.980)
(0.937)
(0.848)
(0.956)
COV
(0.009)
(0.011)
(0.043)
(0.014)
5. Conclusions
The following conclusions are available within the scope of the experimental study presented in this paper:
- It is sufficient to use the limiting value of compressive strain at extreme concrete fiber as a basis to
determine of the ultimate strength of normal sections (USoNS) in RC beams;
- The USoNS in RC beams determined by ACI 318-11, EN 1992-1-1:2004, TCVN 5574:2012 and SP
63.13330.2012 are validated in this experimental study with good and conservative agreement; and
- It is safe and reliable to incorporate the plane strain assumption and the calculation based on bilinear deformation model specified in SP 63.13330.2012 into the determination of the USoNS in RC beams
cast and tested in Vietnam condition.
This experimental study can also be used to validate the specifications of cracking and deformation
of RC beams provided by SP 63.13330.2012. Since the code is currently use as a basis for drafting the new
Vietnamese code for design of RC structures to replace TCVN 5574:2012, the studies mentioned will be of
importance in design practice.
Acknowledgement
The authors would like to thank all the staffs of the Laboratory of Construction Testing and Inspection
(NUCE) for professional support in technical issues as well as Mr. Nguyen Van Quang and Mr. Ta Duy Hung
for their close partnership. The authors’ special appreciation is also extended to Professor Ngo The Phong
and Dr. Nguyen Tuan Trung for giving essential discussions and guidance when the experimental study
presented herein was conducted.
References
1. SNIP 2.03.01-84 (1997), Concrete and reinforced concrete structures-Design standards, National Building Code of Russia.
2. TCVN 5574:2012 (2012), Concrete and reinforced concrete structures-Design standards.
3. ACI 318-11 (2011), Building code requirement for structural concrete, American Concrete Institute.
4. EN 1992-1-1:2004 (2004), Eurocode 2: Design of concrete structures, Part 1-1: General rules and rules
for buildings, European Committee for Standardization, Brussels.
5. SP 63.13330.2012 (2012), Concrete and reinforced concrete structures-Principal rules, Ministry of Regional Development of the Russian Federation, Moscow.
6. Minh P.Q., Phong N.T, Cong N.D (2013), Reinforced concrete structures-Basic elements, Publishing
house of Science and Technolofy (in Vietnamese).
7. James K.W., James G.M. (2012), Reinforced concrete - Mechanics and design, Sixth Edition, Pearson
Eduction Inc.
8. Bill M., John B., Ray H. (2007), Reinforced concrete design to Eurocode 2, Palgrave MacMillan, New York.
9. Minh P.Q., Phong N.T (2010), Reinforced concrete structures-Design to the Eurocode, Construction Publishing house (in Vietnamese).
52
Vol. 11 No. 6
11 - 2017
JOURNAL OF SCIENCE AND TECHNOLOGY IN CIVIL ENGINEERING