Study on seismic performance of new precast post-tensioned beam-column connection (Part 2)
Bạn đang xem bản rút gọn của tài liệu. Xem và tải ngay bản đầy đủ của tài liệu tại đây (986.73 KB, 9 trang )
KẾT CẤU – CÔNG NGHỆ XÂY DỰNG
STUDY ON SEISMIC PERFORMANCE OF NEW PRECAST
POST-TENSIONED BEAM-COLUMN CONNECTION (PART 2)
TS. ĐỖ TIẾN THỊNH
Viện KHCN Xây dựng
Assoc.Prof.Dr. KUSUNOKI KOICHI
Đại học Tokyo
Prof. TASAI AKIRA
Yokohama National University, Japan
Tóm tắt: Bài báo này trình bày kết quả nghiên
cứu của 3 mẫu thí nghiệm liên kết dầm – cột biên bê
tông cốt thép lắp ghép ứng lực trước được thí
nghiệm tại Phòng Thí nghiệm Kết cấu của Đại học
Quốc gia Yokohama, Nhật Bản. Mục đích của thí
nghiệm nhằm kiểm chứng khả năng chịu động đất
của loại liên kết này. Kết quả thí nghiệm cho thấy
liên kết dầm - cột không có khóa chống cắt có độ
trượt tương đối giữa dầm và cột và biến dạng dư lớn.
Các mô hình thí nghiệm có khóa chống cắt có ứng
xử rất tốt với biến dạng dư nhỏ, dầm gần như không
bị trượt so với cột, hư hỏng của các cấu kiện dầm và
cột rất ít, khả năng chịu lực tốt.
Từ khóa: Khóa chống cắt, ứng lực trước không
bám dính, bê tông lắp ghép, liên kết dầm – cột.
Abstract: This paper presents experimental
results of three precast prestressed concrete
beam-column connection specimens which were
tested at Structural Laboratory of Yokohama
National University, Japan. The aim of the
experiment is to prove seismic behavior of this type
of connection. The experimental results show that
the beam-column connection without shear key has
large slip and residual deformation. The
beam-column connections with shear key have good
seismic behavior with small residual deformation,
minor damage of beam and column, and nearly no
slip between beam and column.
Keywords: shear key, unbonded presstressed,
precast concrete, beam-column connection.
1.
Introduction
From the experimental results of the specimens
in the Phase 1(1, 2), it can be seen that the unbonded
Tạp chí KHCN Xây dựng – số 3/2017
post-tensioned precast concrete connection with
shear bracket has high possibility to apply for
long-span office buildings. However, there were still
some undesirable behaviour of the specimens such
as crush of concrete at the upper part of the beam,
damage of the top of the shear bracket and the
beam socket. The aim of this study, named Phase 2,
is to improve the design of the connection in the
Phase 1 to obtain enhanced performance and avoid
unexpected failure modes. Moreover, shear friction
at
the beam
to column interface was also
investigated. This type of structure has advantages
such as over large span, good seismic performance
with minimum damage for beam and column
elements, reusable like steel structure. This type of
structure has high ability to apply in high seismicity
like Japan as well as in low to moderate seismicity
area like Viet Nam.
.
2. Test program
2.1 Test specimens
There are three specimens named SB-A, SF-A,
and SB-LA. These specimens corresponded to the
(1)
specimens SB, SF, and SB-L in the Phase 1 . The
specimen with slab and spandrel beam was not
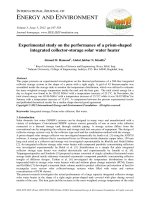
included in this study. Brief outline and specification
of the specimens is shown in Table 1, and
reinforcement detail is shown in Figure 1. Shear
strength of the bracket and the volume of PC bars
were determined in the same way as in the Phase
1(1). Consequently, the shear resistant area of the
bracket and volume of the PC bars of the specimens
in the Phase 2 were identical with those of
specimens in the Phase 1.
3
KẾT CẤU – CÔNG NGHỆ XÂY DỰNG
Table 1. Specimens outline
Specimens
SB-A
SF-A
2
Section (mm )
2
Fc (N/mm )
2
fy (N/mm )
2
Beam
fwy (N/mm )
300 x 500
69.9
60.4
68.6
339.1
339.1
339.1
313.1
313.1
313.1
2-15 Grade C
2- 26 Grade A
2- 15 Grade C
0 ( N/mm )
1.83
4.02
1.83
P0/Py
0.72
0.72
0.72
1500
1500
1500
PC bars
2
PC length (mm)
2
Section (mm )
2
Column
Fc (N/mm )
400 x 400
69.9
60.4
68.6
fy (N/mm )
534.4
534.4
534.4
2
2
fwy (N/mm )
Bracket
SB-LA
313.1
313.1
313.1
2
3036
-
4950
Length L (mm)
50
-
50
aw (mm )
Where: Fc : concrete compressive strength, fy : yield strength of
main reinforcement, fwy : yield strength of lateral reinforcement,
0 : initial beam compressive stress, P0 : initinal prestressed
load, Py : PC bar yield load, aw : shear resistant area.
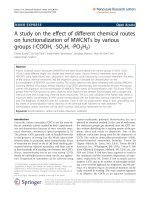
Figure 1. Reinforcement details of the specimens
As seen from the test result of the specimens in
the Phase 1, the top of the bracket was deformed
after the test, caused by large concentrated stress.
Therefore, in the Phase 2, the shear bracket was
designed so that the stress at its top face does not
exceed the yield strength of the steel:
u
where:
4
Qu
y
A
Qu:
y:
ultimate shear force at the beam end (N);
yield strength of the steel (N/mm2);
A: effective area of the top face of the bracket
(mm2), A = b.le, where b was the width of the
bracket (mm), and le was the effective length of the
bracket which contacted to the beam socket (mm).
(1)
The width and effective length of the bracket are
shown in Figure 2. Total length of the bracket was 50
Tạp chí KHCN Xây dựng – số 3/2017
KẾT CẤU – CÔNG NGHỆ XÂY DỰNG
mm from the column face. The gap between the
beam and the column filled with mortar was 20mm.
Hence the effective length le is 30mm.
50
A
Beam
b
Column
20
le
formulas used in Phase 1(1), the top horizontal plate
of the steel box should be designed for bending
moment, caused by the reaction force from the shear
bracket. In order to limit flexural deformation,
maximum tensile stress at the top face of the
horizontal plate should not exceed the yield strength
of the steel:
u y
Plan view
Figure 2. Effective area of the top face of the bracket
(2)
Where:
u:
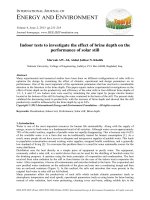
In order to satisfy Eq. (1), the shape of shear
bracket was redesigned as T-shaped with wide top
horizontal plate to enlarge the effective area. The
widths of top plates were 80mm and 110mm for
specimens SB-A and SB-LA, respectively.
For the U-shaped steel box, beside the design
SB-A
maximum tensile stress at the midpoint of
upper face of the top plate (N/mm2);
y:
2
yield strength of the material (N/mm ).
In order to satisfy Eq. (2), thicker plate (t=25mm)
and strengthen plates was used at the top of the
steel box. Photos of the shear bracket and U-shaped
steel box are shown in Figure 3.
SB-LA
Figure 3. Shear bracket and U-shaped steel box
Test results of the specimens in the Phase 1
showed that the upper part of the beam near the
lower end of the column was connected to the
reacting floor by the pin while the upper end was
column face was severely crushed. In order to
prevent this damage, two 6-D150 interlock steel
connected to the reaction wall by horizontal two-end
pin brace that is equivalent to a vertical roller. The
spirals were used at the top corner of the beam to
confine the concrete.
cyclic load was applied to the beam end by the 1000
kN hydraulic jack that attached to the beam end with
2.2 Test setup and loading history
The experimental setup is shown in Figure 4. The
Tạp chí KHCN Xây dựng – số 3/2017
the pin. The gravity load was applied to the beam as
a concentrated vertical load at the distance of 215
mm from the column face.
5
KẾT CẤU – CÔNG NGHỆ XÂY DỰNG
QL
SB
QL
SF
Figure 4. Test setup
QL
SB-L
a) Prototype model
b) Actual specimen
Figure 5. Illustration of the terms in the Equation (3)
The specimens were tested under simultaneous
action of cyclic and gravity load. First, the gravity
load was applied gradually to designated value, and
then the cyclic load was applied. As mentioned
before, the beams of the specimens were shortened
from 4.3m to 2.215m, hence, in order to generate the
same combination of moment and shear force at the
beam column interface as in original condition; the
gravity load was controlled according to the original
gravity load QL1 and the cyclic load QCY as:
L L1
QCY
QL QL 1 2
L1 L '
(3)
Where: QL1 was the original gravity load, L1 was
the original beam length, L1 = 4.3m, L2 was the new
beam length, L2 = 2.215m, the beam length was
considered up to column face, L’ was the distance
from the gravity load to the column face, L’ = 0.215 m,
QCY was the cyclic load. QCY has the same sign with
QL if they act on the same direction, and vice versa.
These terms are shown in Figure 5.
3. Test results and discussions
6
a) Phase 1 specimens(1)
QL
SB-A
QL
SF-A
QL
SB-LA
b) Phase 2 specimens
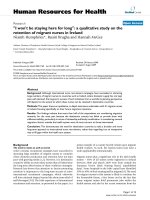
Figure 6. Crack patterns of specimens at 4% drift angle
3.1 Visual Observation
Figure 6 shows the crack patterns of the
specimens of Phase 1 (1) and Phase 2 at 4% drift
angle. Much fewer cracks were observed in all
specimens, compared to those of specimens in the
Phase 1. Crush of concrete at the top of the beam
near the column face was significantly diminished
compared to specimens in the Phase 1, proving the
effectiveness of the spiral steels.
The bracket and beam socket after the test were
shown in Figure 7. As seen in this figure, the shear
bracket and beam socket were not suffered from any
damage, although they experienced very large
vertical load and high drift level. Especially in
specimen SB-LA where the gravity load was 1.5
times larger than that in other specimens.
Furthermore, in case of specimens with shear
bracket, it was effortless to separate the beam out of
the column after the test, confirmed the disassemble
capability of this type of structure. Eq. 1 satisfied to
prevent the bracket from deformation.
Tạp chí KHCN Xây dựng – số 3/2017
KẾT CẤU – CÔNG NGHỆ XÂY DỰNG
SB-A
SB-LA
Figure 7. Shear bracket and beam socket after tested
3.2 Hysteresis behavior
L: beam length (mm);
The hysteresis characteristics of the specimens
are shown in Figure 8 as the relationship between
moment and drift angle. The superimposed dashed
lines on this figure illustrate the hysteresis behavior
and modeled as tri-linear skeleton curve. The
moment and rotation angle at the limit states were
(6)
determined as follow :
pe: initial PC strain ();
py: PC strain at yielding ();
pu: PC strain at ultimate state ().
Decompression occur state:
1
M s 1 e e BD 2 B
2 0.85
(4)
Ms
3 EIL
Yield limit state:
y
1
y BD 2 B
M y 1
2
0 .85
(5)
Rs
(6)
My
PC
LPC
, PC py pe
0. 5 D
3 EIL
Ultimate limit state, Mu = My.
My
PC
Ru
L PC
, PC pu pe
0 .5 D
3 EIL
where:
Ry
(7)
(8)
e: = Pe/BD B;
Pe: initial prestress force (N);
B, D: width and height of the beam (mm);
B: concrete compressive strength (N/mm2);
y: = Py/BD B;
Py: PC bars yield force (N);
LPC: PC length (mm);
E: Young modulus of the concrete (N/mm2);
Figure 8. Moment – drift angle relationship
4
I: second moment of the beam section (mm );
Tạp chí KHCN Xây dựng – số 3/2017
7
KẾT CẤU – CÔNG NGHỆ XÂY DỰNG
Table 2. Summarized test results
Specimens
Loading
Direction
Md
(kNm)
Rd
(%)
My (kNm)
Ry
(%)
Mmax (kNm)
Rmax (%)
My/Mycal
52.7
0.09
109.4
3.82
118.7
4.97
1.3
-50.3
-0.12
-94.2
-2.65
-95.4
-2.82
1.1
97.1
0.09
185.6
1.99
234.9
5.21
0.99
-84.7
-0.2
-152.5
-1.74
-178.7
-4
0.81
53.8
0.07
101.9
3.85
110.9
5.62
1.2
-43.1
-0.15
-132
-2.61
-144.3
-1.82
1.5
SB-A
SF-A
SB-LA
Where: Md, Rd : moment and story drift when opening occurred; My, Ry : moment and story drift at yielding;
Mmax , Rmax : maximum moment and corresponded story drift; Mycal: calculated yielded moment strength;
Figure 9. Illustration of moment strength
3.3 Beam Slip and Friction Coefficient
Figure 10 shows the relationship between the
gravity load and quantity of beam slip at the
8
beginning of the test (before applying of the cyclic
load). The gravity load was applied monolithically up
to 255 kN (SB-A and SF-A) and 382 kN (SB-LA). Up
to gravity load of 255 kN, the amount of slip was
mostly the same for all specimens, whether with or
without shear bracket. It can be said that shear
bracket did not contribute to the shear strength of the
connection at this stage. For specimen SB-LA, when
the gravity load exceeded 255 kN, the amount of
beam slip significantly increased, expressed that the
slip started to occur.
400
300
QL (kN)
All the specimens were successfully passed the
drift of 4% in negative directions and 6% in positive
direction. No fracture of PC bars was recorded. As
seen in Figure 8, while the self-centering
characteristics of the specimens SB-A and SB-LA
were very good, that of specimen SF-A was poor. In
the specimens with shear bracket, yield moment
strength well exceeded the modeled values.
Average experimental yield moments were 20% and
35% larger than the calculated ones for specimens
SB-A and SB-LA, respectively. In the specimen
without shear bracket (SF-A), while the strength in
the positive direction was almost the same with the
modeled one, it was 80% of the modeled value in the
negative direction. As illustrated in the Figure 9,
when the beam slip occurs, the moment lever arm in
negative direction was shorter than that in positive
direction, made the flexural strength in negative
direction smaller than that in the positive direction. It
can be said that in the connection without bracket,
under the effect of beam slip, it was difficult to predict
the flexural strength of the connection. This was one
of the disadvantage of the connection without shear
bracket.
SB-A
SF-A
SB-LA
200
100
0
0.0
0.1
0.2
Slip (mm)
0.3
0.4
Figure 10. Beam slip – gravity load relationship
The beam slip – drift angle relationships of three
specimens are shown in Figure 11. It can be seen
that the beam slip of specimen without shear bracket
(SF-A) was almost the same with that of specimen
SF in the Phase 1, excessive larger than that of the
specimens with shear bracket (SB-A and SB-LA).
From the test result, it concluded that the shear
bracket successfully prevented the slip of the beam.
Figure 12 shows the beam slip and the QB/PPC ratio
relationship of the specimen SF-A. The dashed line
expresses the upper bound of the ratio of each
loading cycle and illustrates the friction coefficient .
It can be seen that, beam slip occurred when the
value of was around 0.45.
Tạp chí KHCN Xây dựng – số 3/2017
KẾT CẤU – CÔNG NGHỆ XÂY DỰNG
25
25
SB-A
20
SF
15
SB-L
Beam slip (mm)
Beam slip (mm)
SB
SB-S
10
5
SF-A
20
SB-LA
15
10
5
0
0
1
2
3
Drift Angle (%)
4
5
6
0
0
Phase 1 specimens
1
2
3
Drift Angle (%)
4
5
Phase 2 specimens
Figure 11. Beam slip – drift angle relationship of all specimens
1.0
SF-A
=QB/N
0.8
0.6
0.5
0.4
0.2
0.0
0
5
10
15 18 20
Beam Slip (mm)
25
30
QB : Beam shear force; N : PC force
Figure 12. Beam slip – friction coefficient relationship, SF-A
3.4 Contribution of shear bracket and shear
friction to the shear strength of the connection
The tensile force in vertical plates of the steel box
was calculated as follow: T E ・ ・ a
(10)
0.3
S B -A
Strain (%)
y
(T1+T3)/2
(T2+T4)/2
T5
0.2
0.1
0.0
-6
-4
-2
0
2
Drift angle (%)
4
0.3
6
SB-LA
y
Strain (%)
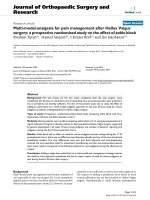
Figure 13 shows the locations of strain gages
pasted on the U-shaped steel box and the observed
strains of the specimens SB-A and SB-LA. Strain
gages were attached at the top horizontal plate and
vertical plates of the steel box. For the specimen
SB-A, strain gages were attached at middle and
upper part of the vertical plates to confirm whether
the strain varied along the plate or not. It can be
seen from the Figure 13 that the strains did not vary
along the height of the vertical plates. From 2% drift
angle, strains in these plates became stable.
Maximum strains of the top horizontal plate in both
specimens were 0.12%, about 50% of the yield
strain. This improved that Eq. 2 was safe to design
the steel box.
0.2
(T1+T3)/2
T5
0.1
where:
2
E: Young modulus of the steel (N/mm );
: strain ();
0.0
-6
-4
-2
0
Drift angle (%)
2
4
6
a: total sectional area of vertical plates (mm 2).
In Figure 14, Qb was the shear force resisted by
the shear bracket. It can be seen that the reaction
force from the bracket was resisted by vertical plates
and transferred to bottom part of the beam.
Therefore, it can be considered that the tensile force
T in vertical plates of the steel box corresponded to
the actual shear force transfer by the bracket.
Tạp chí KHCN Xây dựng – số 3/2017
Figure 13. Strain of the U-shaped steel box
9
KẾT CẤU – CÔNG NGHỆ XÂY DỰNG
Specimen
SB-LA
Figure 14. Transfer of shear force from bracket to beam
end
As proposed in reference (3), shear strength of
the bracket was designed by the equation:
Qs 0.9
Fy
1.5 3
aw QL
(9)
where: Qs is the shear strength of the bracket, Fy
is the yield strength of the steel plate, aw is the
vertical shear resistance area, and QL is the shear
force at the beam end induced by the gravity load.
In this study, SN490C steel was used, Fy = 325
N/mm2. Shear resistance area aw were 3036 and
4950 mm2, for specimens SB-A and SB-LA,
respectively. The value of shear strength Qs were
342 kN and 557.3 kN for specimens for specimens
SB-A and SB-LA, respectively.
Drift
angle
(%)
-4%
0.5%
1%
Tensile
force T
(kN)
173.3
70.5
131.5
Shear strength
of bracket Qs
(kN)
342.0
557.3
557.3
0.51
0.13
0.24
2%
190.8
557.3
0.34
3%
4%
-0.5%
226.7
236.8
109.0
557.3
557.3
557.3
0.41
0.42
0.20
-1%
146.9
557.3
0.26
-2%
181.2
557.3
0.33
-3%
179.2
557.3
0.32
-4%
192.2
557.3
0.34
T/Qs
It can be seen from Figure 14 that, the beam
contacted the column through entire beam section at
neutral position. At peak drift angle position,
contacted area limited only on small areas at the top
or bottom of the beam. After several cycles, the
concrete and grout at these areas was crush and
softened, causing the deterioration of friction
coefficient. Similar results were found in the study by
Okamoto(8). It can be concluded that the contribution
of shear friction mechanism to the shear strength of
the connection decreased when the drift angle
increased, especially at peak drift angle position.
4. Conclusions
Table 2 shows the ratio of tensile force T and
gravity load QL. It can be seen that at small drift
angle, most of the shear force was resisted by shear
friction (77% and 78% at 0.5% drift angle, for
specimen SB-A and SB-LA, respectively). When drift
angle increased, contribution of shear bracket
increased (62% and 65% at 4% drift angle and
neutral position). Moreover, at peak drift position,
this contribution was less than that at neutral
position.
Table 3. Shear resistance of the bracket
Specimen
SB-A
10
Drift
angle
(%)
0.5%
Tensile
force T
(kN)
74.5
Shear strength
of bracket Qs
(kN)
342.0
0.22
1%
121.5
342.0
0.36
2%
158.6
342.0
0.46
3%
201.3
342.0
0.59
4%
231.4
342.0
0.68
-0.5%
117.9
342.0
0.34
-1%
148.3
342.0
0.43
-2%
163.9
342.0
0.48
-3%
171.0
342.0
0.50
T/Qs
From results of this study, following conclusions
can be drawn.
1) Modified shear bracket and beam socket worked
well to transfer the shear force from the beam to the
column, as well as satisfy the deformability of the
beam at high level of drift.
2) The specimens with shear bracket expressed very
good seismic performance, with small residual
deformation, fully developed and column element,
even in very long span frame. It is high possibility to
apply this type of connection in real precast building
structures.
3) The specimens without shear bracket
experienced large beam slip and residual
deformation. The slip occurred at the friction
coefficient of 0.45. Performance of the system
without bracket was inferior compares to the system
with shear bracket.
4) The slip of the beam was the cause of the
Tạp chí KHCN Xây dựng – số 3/2017
KẾT CẤU – CÔNG NGHỆ XÂY DỰNG
difference of flexural strength between positive and
negative direction.
5) At small drift angle, most of shear strength of the
connection was contributed by shear friction
mechanism. When the drift angle increased,
contribution of shear friction decreased and that of
the shear bracket increased.
th
Handbook”, 6 Edition, 2004.
[6] S. Pampanin (2005), “Emerging Solution for High
Seismic Performance of Precast/Prestressed Concrete
Buildings”, Journal of Advanced Concrete Technology,
Vol. 03, No. 02, June, pp 207-223.
[7] I. Kawakubo, T. Ishioka, T. Nishimura, Y. Hosoi, N.
Aragane,
M.
Kanagawa,
S.
Takeda
(2008),
"Development of a Large-Span Precast Concrete
REFERENCES
Structural System with Ease of Construction Using
[1] Đỗ Tiến Thịnh (2009), Luận án Tiến sĩ kỹ thuật, Đại học
Quốc gia Yohohama.
Dynamic Response Analysis (1)", Proceedings of
[2] Đỗ Tiến Thịnh, Koichi Kusunoki, Akira Tasai (2008),
Study
on
A
New
Precast
Post-Tensioned
Beam-Column Joint System”, Tạp chí Khoa học Công
nghệ Xây dựng, số 4, trang 25-31.
Design
and
Construction
of
Precast
Concrete Structures”, in Japanese.
Design and Construction of Prestressed Concrete
Structures”, 1998, in Japanese.
Concrete
Institute,
September, pp 669-670.
[8] H. Okamoto, and T. Hirade (1997), “Shear transfer on
loads: Relation between the maximum experienced
deformation and the loss of prestressing force/the
deterioration of the shear strength”, Proceedings of
[4] Architecture Institute of Japan, “Standard for Structural
[5] Prestressed
Architecture Institute of Japan Annual Convention,
the beam-column prestressed joint under earthquake
[3] Architecture Institute of Japan (2003), “Standard for
Structural
Prestressed Connections, Part 10 Verification by
Architecture Institute of Japan Annual Convention,
September, pp 901-902.
Ngày nhận bài:23/8/2017.
“PCI
Tạp chí KHCN Xây dựng – số 3/2017
Design
Ngày nhận bài sửa lần cuối: 06/9/2017.
11