Examination of the fractal model for streaming potential coefficient in porous media
Bạn đang xem bản rút gọn của tài liệu. Xem và tải ngay bản đầy đủ của tài liệu tại đây (799.25 KB, 12 trang )
VNU Journal of Science: Mathematics – Physics, Vol. 35, No. 1 (2019) 29-40
Original article
Examination of the Fractal Model for Streaming Potential
Coefficient in Porous Media
Luong Duy Thanh*
Thuy Loi University, 175 Tay Son, Dong Da, Hanoi, Vietnam
Received 26 September 2018
Revised 26 October 2018; Accepted 17 December 2018
Abstract: In this work, the fractal model for the streaming potential coefficient in porous media
recently published has been examined by calculating the zeta potential from the measured streaming
potential coefficient. Obtained values of the zeta potential are then compared with experimental
data. Additionally, the variation of the streaming potential coefficient with fluid electrical
conductivity is predicted from the model. The results show that the model predictions are in good
agreement with the experimental data available in literature. The comparison between the proposed
model and the Helmholtz-Smoluchowski (HS) equation is also carried out. It is seen that the
prediction from the proposed model is quite close to what is expected from the HS equation, in
particularly at the high fluid conductivity or large grain diameters. Therefore, the model can be an
alternative approach to obtain the zeta potential from the streaming potential measurements.
Keywords: Streaming potential, zeta potential, fractal, porous media.
1. Introduction
Streaming potential measurements play an important role in geophysical applications. For example,
the streaming potential coefficient for various rock samples is one of the important factors in the
evaluation of seismoelectric well logging [e.g., 1, 2]. The streaming potential coefficient is also an
important parameter in numerical simulations of seismoelectric exploration [e.g., 3, 4] and
seismoelectric well logging [e.g., 5]. Streaming potential could be used to map subsurface flow and
detect subsurface flow patterns in oil reservoirs [e.g., 6, 7], geothermal areas and volcanoes [e.g., 8, 9],
detection of contaminant plumes [e.g., 10, 11]. It has also been proposed to use the streaming potential
________
Corresponding author.
E-mail address:
https//doi.org/ 10.25073/2588-1124/vnumap.4306
29
30
L.D. Thanh / VNU Journal of Science: Mathematics – Physics, Vol. 35, No. 1 (2019) 29-40
monitoring to detect at distance the propagation of a water front in a reservoir [e.g., 12]. Monitoring of
streaming potential anomalies has been proposed as a means of predicting earthquakes [e.g., 13, 14].
Fractal models on porous media have attracted increasing interests from many different disciplines
[e.g., 15-22]. Recently, Luong et al. [23] have presented a fractal model for the streaming potential
coefficient in porous media based on the fractal theory of porous media and on the streaming potential
in a capillary. The proposed model has been applied to explain the dependence of the streaming
potential coefficient on the grain size. The prediction is then compared with experimental data
available in the literature and good agreement is found between them. However, the model is not yet
examined more extensively.
In this work, the fractal model for the streaming potential coefficient in porous media presented in
[23] is examined by calculating the zeta potential that is normally determined by a conventional
Helmholtz- Smoluchowski (HS) equation. Obtained values are then compared with experimental data
available in literature. The result shows that the predicted zeta potential is in good agreement with the
experimental data. The comparison between the proposed model and the HS equation is also carried
out by plotting the ratio of the SPC as a function of particle diameter. It is shown that that the proposed
model is able to reproduce the similar result to the HS equation, in particularly at the high fluid
conductivity or large grain diameters.
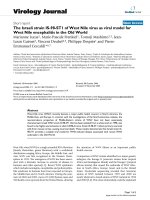
Figure 1. Development of streaming potential when an electrolyte is pumped through a capillary
(a porous medium is made of an array of capillaries).
2. Theoretical background
When a porous medium is saturated with an electrolyte, an electric double layer is formed on the
interface between the solid and the fluid. Some ions are absorbed into the solid surface and other ions
remain movable in the fluid. When a pressure difference is applied across a fluid saturated porous
medium, the relative motion happens between the pore fluid and solid grain surface. Then the net ions
of the diffuse layers move along with the flowing fluid at the same time. This movement of the net ions
generates a convection current (called streaming current) in the capillaries (a porous medium can be
approximated as an array of capillaries). The movement of the ions in the diffuse layer also makes the
separation of the positive and negative ions. Thus, an electric potential (streaming potential) is created
and that induces a conduction current in opposite direction to the streaming current as shown in Fig.
1). The streaming potential coefficient (SPC) is a key parameter that relates the pressure difference
(∆P) and the streaming potential difference (∆V) when the total current density (j) is zero as [24]
L.D. Thanh / VNU Journal of Science: Mathematics – Physics, Vol. 35, No. 1 (2019) 29-40
CS
V
P
31
(1)
j 0
The streaming potential coefficient in porous media is given by [e.g., 25, 26]
CS
r o
,
eff
(2)
where εr is the relative permittivity of the fluid, εo is the dielectric permittivity in vacuum, η is the
dynamic viscosity of the fluid, σeff is the effective conductivity, and ζ is the zeta potential which is the
electrical potential associated with the counter charge in the electrical double layer at the mineral-fluid
interface. The effective conductivity including the bulk fluid conductivity and the surface conductivity
is given by [e.g., 25, 27, 28 ]
2K s
(3)
eff K b
,
where Kb is the bulk fluid conductivity, Ks the specific surface conductance, Λ is a characteristic
length scale that describes the size of the pore network. There have been several models that relate
the characteristic length scale to grain diameter. One is given by [29]
d
,
2m( F 1)
(4)
where d is the mean grain diameter, F is the formation factor (no units), m is the cementation
exponent of porous media (no units).
Consequently, Eq. (2)
can
be rewritten as
r o
r o
CS
.
2K s
2mK s ( F 1)
( Kb
) ( Kb
)
(5)
d
Eq. (2) and therefore, Eq. (5) are known as the modified HS equation as mentioned above.
Figure 2. A porous medium composed of a large number of tortuous capillaries with random radius.
32
L.D. Thanh / VNU Journal of Science: Mathematics – Physics, Vol. 35, No. 1 (2019) 29-40
3. Fractal theory for porous media
It has been shown that many natural porous media usually have extremely complicated and
disordered pore structure with pore sizes extending over several orders of magnitude and their pore
spaces have the statistical self-similarity and fractal characters [e.g., 15, 18]. Fractal models provide an
alternative and useful means for studying the transport phenomenon and analyzing the macroscopic
transport properties of porous media. To derive the streaming potential coefficient in porous media, a
representative elementary volume (REV) of a cylinder of radius rrev and length Lrev is considered [30].
The pores are assumed to be circular capillary tubes with radii varying from a minimum pore radius
rmin to a maximum pore radius rmax (0< rmin < rmax < rrev). A porous medium is assumed to be
made up of an array of tortuous capillaries with different sizes (see Fig. 2). The cumulative sizedistribution of pores is assumed to obey the following fractal law [18, 21, 22, 30]:
r
N ( r ) max
r
Df
(6)
where N is the number of capillaries (whose radius ≥ r) in a fractal porous media, Df is the fractal
di- mension for pore space (0 < Df < 2 in two-dimensional space and 0 < Df < 3 in three dimensional
space [18, 21, 22]). Eq. (6) implies the property of self-similarity of porous media, which means that
the value of Df from Eq. (6) remains constant across a range of length scales. As there are numerous
capillaries in porous media, Eq. (6) can be considered as a continuous function of the radius.
Differentiating Eq. (6) with respect to r yields
dN Drmaxf r
D
D f 1
dr ,
(7)
where -dN represents the number of pores from the radius r to the radius r + dr. The minus (-) in
Eq. (7) implied that the number of pores decreases with the increase of pore size.
The fractal dimension for pore space is expressed as [e.g., 18, 21, 22]
Df 2
ln
,
ln
(8)
where ϕ is the porosity of porous media and α is the ratio of the minimum pore radius to the
maximum pore radius (α = rmin/rmax). For most porous media, it is stated that α ≈ 10−2 or < 10−2 [e.g.,
18, 21, 22].
Cai et al. [19] proposed an expression to calculate maximum radius as
rmax
d 2
1 ,
8 1
1
4(1 )
(9)
where d is the mean grain diameter in porous media.
Streaming current in porous media
The streaming current in a capillary of radius r under a fluid pressure difference (∆Prev) across the
REV is given by [31, 32]
is ( r )
r 2 . o Prev
.
L
2I1 (r / )
1
rI 0 (r / )
(10)
L.D. Thanh / VNU Journal of Science: Mathematics – Physics, Vol. 35, No. 1 (2019) 29-40
33
where ∆P is the pressure difference across the capillary; Lτ is the real length of the tortuous
capillaries; I0 and I1 are the zero-order and the first-order modified Bessel functions of the first kind,
respectively and λ is the Debye length that depends solely on the properties of the fluid and not on the
properties of the solid surface [e.g., 33, 34].
For electrolytes with concentrations in the range of 1 mM to 0.1 M (typical concentrations for
aqueous solutions saturating rocks or soils), the Debye length varies between 10 nm and 1 nm at 25◦C
[e.g., 34]. In general, the pore radius of rocks is around tens of micrometer [e.g., 35]. The Debye length
is typically much smaller than pore sizes of a majority of rocks and soils. In this case,
I1(r/λ)/I0(r/λ) can be neglected. Under that condition, Eq. (10) is simplified as
r 2 . o Prev r 2 . o Prev
,
i s (r )
.
.
L
Lrev .
(11)
where Lτ is related to the length of the representative elementary volume Lrev as Lτ =τ Lrev [e.g., 36]
(τ is the tortuosity of the capillary).
The streaming current through the representative elementary volume of the porous medium is the
sum of the streaming currents over all individual capillaries and is given by
Is
rmax
i (r )(dN ) .
(12)
s
rmin
Substituting Eq. (7) and Eq. (11) into Eq. (12), the following is obtained
Is
rmax
rmin
Df
. o Prev
. o Prev
D
1 D
2 D
2
.
D f rmax r
dr
.
.
rmax
(1
).
.Lrev
.Lrev 2 D f
f
f
f
(13)
3.2. Conduction current in porous media
The streaming current is responsible for the streaming potential. As a consequence of the
streaming current, a potential difference called streaming potential (∆V) will be set up between the
ends of the capillary. This streaming potential in turn will cause an electric conduction current
opposite in direction with the streaming current (see Fig. 1). The conduction current when taking into
account both bulk conduction and surface conduction of the capillary is given by [37, 38]
ic (r )
V
K b r 2 2K s r
Lrev
(14)
The conduction current through the representative elementary volume is given by
Ic
rmax
rmin
ic (r )(dN )
D f V K b
2K s
2 D
1 D
2
rmax
(1 f )
rmax (1 f )
Lrev 2 D f
1 Df
(15)
3.3. Streaming potential coefficient in porous media
At steady state, the following is obtained
Is = I c
Combining Eq. (12), Eq. (15) and Eq. (16) yields
(16)
L.D. Thanh / VNU Journal of Science: Mathematics – Physics, Vol. 35, No. 1 (2019) 29-40
34
V
. oP
.
1 D f
2
D
2K s
f 1
K b
.
.
rmax 1 D f 1 2 D f
The streaming potential coefficient in the fractal model is obtained as
. o
V
CS
1 D
P
2K s 2 D f 1 f
K b
.
.
rmax 1 D f 1 2 D f
Eq. (18) is the fractal model for the SPC already presented in [23].
(17)
(18)
Table 1. The parameters of sandstone samples reported in [39].
Sample ID
Porosity (percent) Formation factor (-)
Permeability (mD)
D1
D2
D3
D4
D5
D6
D7
D8
D9
D10
30.6
30.2
30.9
32.1
29.8
31.0
29.4
31.0
29.3
31.5
1028
1435
1307
1152
456
978
594
2785
1491
3241
9.131
7.873
8.415
8.644
8.319
8.497
8.156
11.792
9.308
8.793
4. Discussion
To examine the fractal model for the SPC, experimental data reported in [39] for ten cylindrical
sandstone samples (25 mm in diameter and around 20 mm in length) saturated by six different
salinities (0.02, 0.05, 0.1, 0.2, 0.4 and 0.6 mol/l NaCl solutions) are used. Parameters of the sandstone
samples are reported in [39] and re-shown in Table 1. The measured SPC at the different salinities
presented in [39] is also re-shown in Table 2.
Table 2. The magnitude of the SPC (in nV/Pa) at different electrolyte concentrations (Cf in mol/l)
reported in [39].
Sample ID
D1
D2
D3
D4
D5
D6
D7
D8
D9
D10
0.02
54.01
83.74
80.85
48.69
39.87
59.24
40.33
212.92
97.59
224.81
0.05
20.40
23.18
22.05
21.71
19.33
22.54
16.51
42.46
35.77
57.88
0.1
14.73
18.91
16.31
18.85
13.95
15.32
12.35
27.50
22.15
30.03
0.2
10.05
11.03
10.05
12.05
8.95
10.26
9.76
18.48
10.51
15.66
0.4
7.02
8.35
6.27
8.15
7.75
7.91
7.65
10.87
6.92
9.61
0.6
3.11
3.47
3.26
3.81
3.61
3.62
4.41
4.26
3.59
3.76
L.D. Thanh / VNU Journal of Science: Mathematics – Physics, Vol. 35, No. 1 (2019) 29-40
35
To obtain the zeta potential from the model - Eq. (18), one needs to know the SPC (see Table 2),
the electrical conductivity, the surface conductivity and the fractal parameters of the porous rocks (α,
Df and rmax). In the model, εr is taken as 80 (no units) [40]; εo is taken as 8.854×10⁻¹² F/m [40]; η is
taken as 0.001 Pa.s [40]; α is taken as 0.00001 (no units) because of the best fit to the experimental
data (this value is also comparable to that used in [21] for rocks of Fontainebleau sandstone). Electrical
conductivity of the NaCl solutions (the original stock solutions) is not mentioned in [39] but it can
be obtained from the electrolyte concentration using Kb = 10Cf (that is valid in the range 10−6M
< Cf < 1 M and 15oC < temperature < 25oC) [41]. However, when the stock solutions are passed
through the rock samples and become equilibrated with it. Geochemical interactions occur between
solid grains and the pore fluid that are associated with dissolution and precipitation.
These change the salinity, composition, and pH of the pore fluid [42, 43]. It is found that there is a
significant increase of around 30% in the salinity of low salinity stock solutions (Cf < 0.2 mol/l) after
equilibration with silica-based rocks [42]. While a reduction in pore fluid salinity could also occur at
high salinity stock solutions (Cf > 0.2 mol/l) due to precipitation. Therefore, the actual electrical
conductivity for Cf < 0.2 mol/l (0.02 mol/l, 0.05 mol/l and 0.1 mol/l) is approximately obtained by the
relation Kb = 10Cf /0.7; for Cf = 0.2 mol/l by Kb = 10Cf and for Cf > 0.2 mol/l (0.4 mol/l and 0.6
mol/l) by Kb = 10Cf /1.3 [42]. The specific surface conductance almost does not vary with salinity at
salinity higher than 10−3 mol/l [44]. Therefore, the surface conductance is assumed to be constant over
the range of electrolyte concentration used in this work and taken as 8.9 × 10⁻⁹ S for the silica-based
samples [44]. This value is comparable to those reported in literature (e.g., Ks = 4.0×10⁻⁹ S [27] or
5×10⁻⁹ S [45]). The fractal dimension Df is determined from Eq. (8) with porosity reported in Table
1. The maximum radius rmax is determined from Eq. (9) in which the mean diameter of particles in
porous media is calculated from Eq. (4)
d 2m( F 1) ,
(19)
where m is taken as 1.9 for consolidated sandstones [46] and the Λ is linked to the permeability of the
porous medium (ko) as follows [47]
8 Fk o .
(20)
Table 3. The magnitude of the zeta potential (in mV) obtained from Eq. (18) at different electrolyte
concentrations (Cf in mol/l).
Sample ID
D1
D2
D3
D4
D5
D6
D7
D8
D9
D10
Eq. (19) is now rewritten as
0.02
76.97
126.04
116.41
71.28
87.63
93.93
81.59
171.28
118.89
226.96
0.05
40.85
48.27
44.47
44.31
53.64
48.75
42.93
58.66
64.22
91.84
0.1
43.66
57.57
48.59
56.61
52.13
47.87
43.99
64.45
61.08
76.54
0.2
42.68
47.73
42.83
51.64
44.92
45.22
47.28
67.01
42.46
60.00
0.4
39.72
47.91
35.56
46.43
49.84
46.02
47.86
54.75
37.72
50.38
0.6
24.77
27.92
26.02
30.50
31.55
29.42
37.77
31.29
27.85
28.39
36
L.D. Thanh / VNU Journal of Science: Mathematics – Physics, Vol. 35, No. 1 (2019) 29-40
d 2m( F 1) 8 Fk o .
(21)
Therefore, the mean diameter of particles in porous media is determined with the knowledge of the
cementation exponent m, the formation factor F and permeability ko (see Table 1).
Figure 3. The zeta potential at different electrolyte concentrations for all samples:
(a) is obtained from the fractal model and (b) is obtained from Table 4 in [39].
Table 3 shows the magnitude of the zeta potential obtained from the fractal model at different
electrolyte concentrations. The comparison between the zeta potential predicted from the model (Table
3) and experimental data reported in [39] is shown in Fig. 3. It is seen that the the model can reproduce
the main trend of experimental data reported in [39] (Table 4 in their paper). For more details, the
variation of zeta potential with electrolyte concentration predicted from the model and from [39] is
shown in Fig. 4 for the representative sample D9. By fitting experimental data, the relation between
the zeta potential and the electrolyte concentration is found to be ζ= -10+55log10(Cf ) for the sample
D9 (ζ is in mV and Cf is in mol/l). Fig. 5 shows the variation of the SPC with the fluid electrical
conductivity for the sample D9 in which the symbols are from [39] and the solid line is predicted
from the model. It is seen that the model can quantitatively explain the experimental data well.
Figure 4. The variation of the zeta potential with the fluid electrical conductivity for the representative sample
D9 deduced from the model and from [39].
L.D. Thanh / VNU Journal of Science: Mathematics – Physics, Vol. 35, No. 1 (2019) 29-40
37
Figure 5. The variation of the SPC with the fluid electrical conductivity for the representative sample D9
deduced from the model and from [39].
Additionally, Fig. 6 shows the dependence of the SPC on the fluid electrical conductivity for three
glass bead packs with different particle diameters (d = 56 µm denoted by S1a, d = 72 µm denoted
by S1b and d = 512 µm denoted by S5) obtained from [48] (see the symbols) and the model (the
solid lines). In the model, φ = 0.4 [48]; Ks = 4.0×10⁻⁹ S [48]; the relation between the zeta potential
and the fluid electrical conductivity ζ=14.6+29.1×log10(Kb) [48]; and α = 0.01 for unconsolidated
porous samples such as sand packs [e.g., 19, 21, 22] are used. The fractal dimension Df is determined
via Eq. (8). The maximum radius rmax is determined from Eq. (9) with the knowledge of particle
diameter d and porosity φ. The result shows that the model is able to reproduce the main trend as
the experimental data.
The ratio of the SPC presented in Eq. (5) and that presented in Eq. (18) is obtained as below
.K b
R
1 D
2K s 2 D f 1 f
.
.
rmax 1 D f 1 2 D f
4mK s ( F 1)
Kb
d
(22)
Figure 6. The variation of the SPC with the fluid electrical conductivity for three different sand packs obtained
from [48] (symbols) and from the model (solid lines).
To predict the variation of R with particle diameter for unconsolidated porous samples, ϕ is taken
as 0.4, α is taken as 0.01, Ks is taken as 4×10⁻³ S for silica particle and m is taken as 1.5 [49]. Fig. 7
shows the ratio of the SPC as a function of diameter d at three different electrical conductivities (Kb =
L.D. Thanh / VNU Journal of Science: Mathematics – Physics, Vol. 35, No. 1 (2019) 29-40
38
2.0×10⁻³ S/m, 2.0×10⁻² S/m and 2.0×10⁻¹ S/m). The result shows that the prediction from the
proposed model is quite close to what is predicted from the HS equation, in particularly at the high
fluid conductivity or large grain diameters. The reason is that the surface conductivity can be
negligible for those cases.
Figure 7. The ratio of the streaming potential coefficient as a function of particle diameter at three different
electrical conductivities.
5. Conclusions
We examine the fractal model for the streaming potential coefficient in porous media recently
published by deducing the zeta potential from the SPC. Obtained values of the zeta potential are then
compared with measured data for ten rock samples saturated by six different salinities. Additionally,
the variation of the SPC with fluid electrical conductivity is predicted from the model and compared
with experimental data. The results show that the model predictions are in good agreement with the
experimental data available in literature. The comparison between the proposed model and the HS
equation is also carried out by plotting the ratio of the SPC as a function of particle diameter. It is seen
that that the prediction from the proposed model is quite close to what is predicted from the HS
equation, in particularly at the high fluid conductivity or large grain diameters. It is suggested that
the model can be an alternative approach to obtain the zeta potential without empirical constants (the
formation factor F and the cementation exponent m) besides the conventional HS equation.
Acknowledgments
This research is funded by Vietnam National Foundation for Science and Technology
Development (NAFOSTED) under grant number 103.99-2016.29
References
[1] Z. Zhu, M. W. Haartsen, M. N. Toksz, Experimental studies of electrokinetic conversions in fluid‐saturated
borehole models, Geophysics 64 (1999) 1349–1356.
[2] Z. Zhu, M. N. Toksz, D. R. Burns, Electroseismic and seismoelectric measurements of rock samples in a water
tank, Geophysics 73 (2008) E153–E164.
L.D. Thanh / VNU Journal of Science: Mathematics – Physics, Vol. 35, No. 1 (2019) 29-40
39
[3] M. Haartsen, S. R. Pride, Electroseismic waves from point sources in layered media, Journal of Geophysical
Research 102 (1997) 24745–24769.
[4] S. Garambois, M. Dietrich, Full waveform numerical simulations of seismoelectromagnetic wave conversions in
fluid-saturated stratified porous media, Journal of Geophysical Research: Solid Earth 107 (2002).
[5] W. Guan, H. Hu, Finite-difference modeling of the electroseismic logging in a fluid-saturated porous formation,
Journal of Computational Physics 227 (2008) 5633–5648.
[6] B. Wurmstich, F. D. Morgan, Modeling of streaming potential responses caused by oil well pumping, Geophysics
59 (1994) 46–56.
[7] K. Titov, A. Revil, P. Konosavsky, S. Straface, S. Troisi, Numerical modelling of self-potential signals associated
with a pumping test experiment, Geophysical Journal International 162 (2005) 641–650.
[8] R. F. Corwin, D. B. Hoover, The self-potential method in geothermal exploration, Geophysics 44 (1979) 226–
245.
[9] G. Mauri, G. Williams-Jones, G. Saracco, Depth determinations of shallow hydrothermal systems by selfpotential and multi-scale wavelet tomography, Journal of Volcanology and Geothermal Research 191 (2010)
233–244.
[10] P. Martinez-Pagan, A. Jardani, A. Revil, A. Haas, Self-potential monitoring of a salt plume, geophysics 75 (2010)
WA17–WA25.
[11] V. Naudet, A. Revil, J.-Y. Bottero, P. Bgassat, Relationship between self-potential (SP) signals and redox
conditions in contaminated groundwater, Geophysical Research Letters 30 (2003).
[12] J. H. Saunders, M. D. Jackson, C. C. Pain, Fluid flow monitoring in oil fields using downhole measurements of
electrokinetic potential, Geophysics 73(5) (2008) E165–E180.
[13] H. Mizutani, T. Ishido, T. Yokokura, S. Ohnishi, Electrokinetic phenomena associated with earthquakes,
Geophys. Res. Lett. 3 (1976).
[14] M. Trique, P. Richon, F. Perrier, J. Avouac, J.C.Sabroux, Radon emanation and electric potential variations
associated with transient deformation near reservoir lakes, Nature (1999) 137–141.
[15] B. B. Mandelbrot, The Fractal Geometry of Nature, W.H. Freeman, New York, 1982.
[16] J. Feder, A. Aharony, Fractals in Physics, North Holland, Amsterdam, 1989.
[17] P. Xu, A discussion on fractal models for transport physics of porous media, Fractals 23 (2015).
[18] B. Yu, P. Cheng, A fractal permeability model for bi-dispersed porous media, International Journal of Heat and
Mass Transfer 45 (2002) 2983–2993.
[19] J. C. Cai, X. Y. Hu, D. C. Standnes, L. J. You, An analytical model for spontaneous imbibition in fractal porous
media including gravity, Colloids and Surfaces, A: Physicocemical and Engineering Aspects 414 (2012) 228-233.
[20] J. C. Cai, L. J. You, X. Y. Hu, J. Wang, R. H. Peng, Prediction of effective permeability in porous media based
on spontaneous imbibition effect, International Journal of Modern Physics C 23 (2012).
[21] M. Liang, S. Yang, B. Yu, A fractal streaming current model for charged microscale porous media, Journal of
Electrostatics 72 (2014).
[22] M. Liang, S. Yang, T. Miao, B. Yu, Analysis of electroosmotic characters in fractal porous media, Chemical
Engineering Science 127 (2015).
[23] L. D. Thanh, P. V. Do, N. V. Nghia, N. X. Ca, A fractal model for streaming potential coefficient in porous
mediaGeophysical Prospecting 66 (2018) 753–766.
[24] W. R. Sill, Self-potential modeling from primary flows, Geophysics 48 (1983) 76–86.
[25] F. D. Morgan, E. R. Williams, T. R. Madden, Streaming potential properties of westerly granite with
applications, Journal of Geophysical Research 94 (1989) 12.449–12.461.
[26] L. Jouniaux, T. Ishido, Electrokinetics in Earth Sciences: A Tutorial, International Journal of Geophysics, Article
ID 286107 (2012) 16 pages, doi:10.1155/2012/286107.
[27] P. W. J. Glover, N. Dery, Streaming potential coupling coefficient of quartz glass bead packs: Dependence on
grain diameter, pore size, and pore throat radius, Geophysics 75 (2010) F225–F241.
[28] T. Ishido, H. Mizutani, Experimental and Theoretical Basis of Electrokinetic Phenomena in Rock-Water Systems
and Its Applications to Geophysics, Journal of Geophysical Research 86 (1981) 1763–1775.
40
L.D. Thanh / VNU Journal of Science: Mathematics – Physics, Vol. 35, No. 1 (2019) 29-40
[29] A. Revil, L. M. Cathles III, P. D. Manhardt, Permeability of shaly sands, Water Resources Research 3 (1999)
651–662.
[30] L. Guarracino, D. Jougnot, A Physically Based Analytical Model to Describe Effective Excess Charge for
Streaming Potential Generation in Water Saturated Porous Media, Journal of Geophysical Research: Solid Earth
123 (2018) 52–65.
[31] C. Rice, R. Whitehead, Electrokinetic flow in a narrow cylindrical capillary, J. Phys. Chem. 69 (1965) 40174024.
[32] T. Paillat, E. Moreau, P.O.Grimaud, G. Touchard, Electrokinetic phenomena in porous media applied to soil
decontamination, IEEE Transactions on Dielectrics and Electrical Insulation 7 (2000) 693–704.
[33] R. J. Hunter, Zeta Potential in Colloid Science, Academic, New York, 1981.
[34] J. Israelachvili, Intermolecular and Surface Forces, Academic Press, 1992.
[35] X. Hu, S. Hu, F. Jin, S. Huang, Physics of Petroleum Reservoirs, Springer-Verlag Berlin Heidelberg, 2017.
[36] Z. Bassiouni, Theory, Measurement, and Interpretation of Well Logs, Henry L. Doherty Memorial Fund of
AIME, Society of Petroleum Engineers, 1994.
[37] M. M. I. Abaza, Streaming Current and Streaming Potential Induced by Water Flow Through Porous Media,
Ph.D. thesis, Utah State University, 1996.
[38] K. S. Birdi, Handbook of Surface and Colloid Chemistry, Third Edition, CRC Press, 2008.
[39] J. Wang, H. Hu, W. Guan, H. Li, Electrokinetic experimental study on saturated rock samples: zeta potential and
surface conductance, Geophysical Journal International 201 (2015) 869–877.
[40] D. R. Lide, CRC Handbook of Chemistry and Physics, CRC Press, 2004.
[41] P. N. Sen, P. A. Goode, Influence of temperature on electrical conductivity on shaly sands, Geophysics 57 (1992)
89–96.
[42] E. Walker, P. W. J. Glover, J. Ruel, A transient method for measuring the DC streaming potential coefficient of
porous and fractured rocks, Journal of Geophysical Research. Solid Earth 119 (2014) 957–970.
[43] P. Glover, in: G. Schubert (Ed.), Treatise on Geophysics (Second Edition), Elsevier, Oxford, second edition
edition, 2015, pp. 89 – 137.
[44] A. Revil, P. W. J. Glover, Nature of surface electrical conductivity in natural sands, sandstones, and clays,
Geophysical Research Letters 25 (1998) 691–694.
[45] L. Jouniaux, J. Pozzi, Permeability dependence of streaming potential in rocks for various fluid conductivities,
Geophysical Research Letters 22 (1995) 485–488.
[46] K. Bjorlykke, Petroleum Geoscience From Sedimentary Environments to Rock Physics, Springer, Berlin,
Heidelberg, 2010.
[47] D. L. Johnson, J. Koplik, L. M. Schwartz, New Pore-Size Parameter Characterizing Transport in Porous Media,
Phys. Rev. Lett. 57 (1986) 2564–2567.
[48] A. Boleve, A. Crespy, A. Revil, F. Janod, J. L. Mattiuzzo, Streaming potentials of granular media: Influence of
the Dukhin and Reynolds numbers , Journal of Geophysical Research B08204 (2007).
[49] P. Sen, C. Scala, M. H. Cohen, A self-similar model for sedimentary rocks with application to the dielectric
constant of fused glass beads, Journal of the Soil Mechanics and foundations Division 46 (1981) 781–795.