Testing the feasibility of eliciting preferences for health states from adolescents using direct methods
Bạn đang xem bản rút gọn của tài liệu. Xem và tải ngay bản đầy đủ của tài liệu tại đây (856.96 KB, 9 trang )
Crump et al. BMC Pediatrics (2018) 18:199
/>
RESEARCH ARTICLE
Open Access
Testing the feasibility of eliciting
preferences for health states from
adolescents using direct methods
R. Trafford Crump1* , Ryan Lau2, Elizabeth Cox3, Gillian Currie4 and Julie Panepinto2
Abstract
Background: Measuring adolescents’ preferences for health states can play an important role in evaluating the
delivery of pediatric healthcare. However, formal evaluation of the common direct preference elicitation methods
for health states has not been done with adolescents. Therefore, the purpose of this study is to test how these
methods perform in terms of their feasibility, reliability, and validity for measuring health state preferences in
adolescents.
Methods: This study used a web-based survey of adolescents, 18 years of age or younger, living in the United
States. The survey included four health states, each comprised of six attributes. Preferences for these health states
were elicited using the visual analogue scale, time trade-off, and standard gamble. The feasibility, test-retest
reliability, and construct validity of each of these preference elicitation methods were tested and compared.
Results: A total of 144 participants were included in this study. Using a web-based survey format to elicit
preferences for health states from adolescents was feasible. A majority of participants completed all three elicitation
methods, ranked those methods as being easy, with very few requiring assistance from someone else. However, all
three elicitation methods demonstrated weak test-retest reliability, with Kendall’s tau-a values ranging from 0.204 to
0.402. Similarly, all three methods demonstrated poor construct validity, with 9–50% of all rankings aligning with
our expectations. There were no significant differences across age groups.
Conclusions: Using a web-based survey format to elicit preferences for health states from adolescents is feasible.
However, the reliability and construct validity of the methods used to elicit these preferences when using this
survey format are poor. Further research into the effects of a web-based survey approach to eliciting preferences
for health states from adolescents is needed before health services researchers or pediatric clinicians widely employ
these methods.
Keywords: Adolescents, Survey, Health states, Preferences, Psychometrics
Background
Measuring adolescents’ preferences for health states can
play an important role in evaluating the delivery of
pediatric healthcare. Health states describe a scenario
that an individual may experience at a particular point
in time [1]. The scenario is comprised of attributes that
define physical and mental functional abilities, and the severity of symptoms. These attributes may be real – that is,
* Correspondence:
1
Department of Surgery, University of Calgary, 6601 7007 14 St SW, Calgary,
AB T2V 1P9, Canada
Full list of author information is available at the end of the article
those currently being experienced by the individual. Alternatively, these attributes may be hypothetical, where the
individual is asked to imagine what it would be like to experience the scenario. The choice between using real or
hypothetical attributes depends on the research objectives
[1]. For example, when screening or monitoring an individual patient’s health, real attributes are used and
assessed. When developing a population health status
index, hypothetical attributes may be used. Each attribute
used in a health state is described using levels that lie on a
continuum between perfect health and death (e.g., “no
© The Author(s). 2018 Open Access This article is distributed under the terms of the Creative Commons Attribution 4.0
International License ( which permits unrestricted use, distribution, and
reproduction in any medium, provided you give appropriate credit to the original author(s) and the source, provide a link to
the Creative Commons license, and indicate if changes were made. The Creative Commons Public Domain Dedication waiver
( applies to the data made available in this article, unless otherwise stated.
Crump et al. BMC Pediatrics (2018) 18:199
pain”, “moderate pain”, “severe pain”). One level per attribute is used to describe a health state [2].
By systematically altering the levels used to describe
the attributes, different health states can be formed. The
extent to which an individual desires one health state over
another – referred to as a preference in this study – can
then be measured. It is common practice to measure preferences for health states in adults [3]. A systematic review
identified 344 studies eliciting health and health care preferences from adults using direct methods [4]. The visual
analogue scale, time trade-off and standard gamble are all
common direct methods used to measure preferences [5].
Discrete choice experiments are also commonly used to
elicit preferences for health and health states [6].
Despite its prevalence in adults, measuring preferences
for health states from adolescents is far less common. In
part, this rarity is due to two challenges. The first challenge
is logistical. Previous studies have observed difficulty in
identifying, recruiting, and retaining adolescents in clinical
studies [7, 8]. These studies have reported several reasons
for this: 1) receiving approval from institutional review
boards, 2) protective parents not wanting to burden their
adolescents, and 3) keeping adolescents sufficiently engaged
to maintain their motivation in study participation [7, 9].
Consequently, the cost of including adolescents participants
can be prohibitive. Some researchers have reported success
by using the internet (e.g., world wide web, email, social
networks) to overcome these logistical challenges [7, 8, 10].
The second challenge to measuring preference for health
states from adolescents is conceptual [11, 12]. It can be difficult to develop health states that reflect the changing
physical, social, and psychological factors that adolescents
experience as they mature [11]. Adolescents also have
limited frames of reference – that is, experiences living
in different states of health – which can threaten the
validity and reliability of eliciting their preferences [13].
When asked about their preferences for health states
that they have not experienced, such as hypothetical or
future health states, adolescents of all ages have demonstrated seemingly illogical risk taking [12].
As a result of the logistical and conceptual challenges
identified above, adolescents’ preferences for health
states are often elicited from adults or proxies, such as
parents or care givers [13, 14]. Using proxy preferences,
however, is not without its own shortcomings. Some
argue that proxies fail to accurately assess the importance of certain unobservable health domains for adolescents, such as social or emotional impairments [13, 15].
For example, health problems that impact body image or
ability to socialize with peers can be of far greater importance to adolescents than adults [11]. As a result, significant differences in preferences for health states
elicited from adolescents and their parents have been
observed [16, 17].
Page 2 of 9
Given the challenges associated with proxies, measuring preferences directly from adolescents is of critical
importance, particularly in defining the value of specific
interventions in pediatric healthcare [18]. Before doing so,
however, we need to establish the feasibility of recruiting
adolescent participants and the appropriate elicitation
methods for measuring health state preferences from this
population. A recent systematic review of studies that directly measured preferences in adolescents observed that
only 26 out of 74 studies in the past 25 years have reported some form of feasibility, reliability, or validity for
commonly used elicitation methods [19]. To move the
field forward, there is a need to better understand how
these elicitation methods work with adolescents.
Therefore, the primary aim of this study was to test
the feasibility of eliciting adolescents’ preferences for
health states using a web-based survey approach. If this
was feasible, it’s secondary aims were to 1) test the reliability and validity of different commonly used direct
elicitation methods, and 2) assess whether there were
differences across age groups in the reliability and validity of using these methods. This was an exploratory
study, with no hypotheses a priori.
Methods
Developing the web-based survey
The research team first conceptualized and designed the
survey on paper, which went through several reviews and iterations (Additional file 1). Based on this initial design, the
survey was converted to a web application using Qualtrics
software (Qualtrics LLC. Provo, UT) by the University of
Wisconsin Survey Center (Madison, WI, USA). The Qualtrics software enabled the survey to be compatible on any
web-enabled device (e.g., computer, tablet, mobile phone).
Developing the health states
The health states constructed for the survey used in this
study were based on the Patient-Reported Outcomes
Measurement Information System’s (PROMIS) Pediatric
Profile [20]. The PROMIS Pediatric Profile measures seven
domains of child health: anxiety, depression, fatigue, pain
intensity, pain interference, physical function, and peer relationships. For each domain, the respondent is asked to rank
how commonly a symptom or functional limitation impacted their life over the last seven days. These are ranked
using a five-point Likert scale, ranging from “Never” to
“Almost Always”.
Several modifications were made to the PROMIS
Pediatric Profile in order to reduce the number of health
states used in this study. First, only one item per domain
was used to describe the health state. Second, the middle
ranking, “Sometimes”, was not used to describe any items.
Third, the pain intensity domain was dropped because of
its descriptive overlap with the pain interference domain.
Crump et al. BMC Pediatrics (2018) 18:199
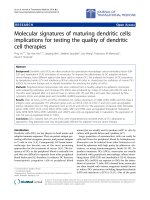
After these modifications, four hypothetical health
states were established, each comprised of six attributes
(Fig. 1). The health states were generically labeled A
through D. Two of the health states represented the
most extreme descriptions: Health State A described
“perfect health”, and Health State D described “worst
health”. The other two, Health States B and C, described
relatively less extreme states. This provided a rational
order, which we could later exploit to test validity. A
graphic icon was used to help respondents more easily
identify the health states in the web-based survey, similar to what has been done previously [21].
Fig. 1 The four health states used in the survey
Page 3 of 9
Measuring preferences for the health states
The survey was divided into three main sections, each
related to one of the three direct elicitation methods
under study: 1) visual analogue scale, 2) time trade-off,
and 3) standard gamble. The selection of these direct
elicitation methods was based on a review of those that
have demonstrated feasibility, reliability, and validity with
adolescents [19]. An example of how each method was presented to the respondent is provided as a supplemental
appendix. After each of these sections, respondents were
asked to rate the difficulty of the method they had just completed using a four-point Likert scale (ranging from 1 = “no
Crump et al. BMC Pediatrics (2018) 18:199
difficulty completing” to 4 = “completed with a lot of
trouble”) and whether they required assistance to complete
the method.
Section one involved the visual analogue scale. Participants were presented with the four health states (i.e.,
Health States A-D) in random order and asked to place
them along a vertical scale ranked from “best”) to “worst”.
Participants were first instructed to place the health state
they favored the most at the top of a scale, and the one
they favored the least at the bottom of the scale. They
were then instructed to place the remaining health states
in-between the best and worst health states, based on how
much they favored each relative to the best/worst anchors.
Section two involved a modified version of the time
trade-off. Participants were presented with two health
states. The first health state was always perfect health
(i.e., Health State A). The second was one of the relatively less healthy states (i.e., Health State B, C, or D).
Participants were told that they could live for 60 years in
the relatively less healthy state, or live in Health State A
for fewer than 60 years. Participants were presented with
a sliding scale ranging between 0 and 59 and instructed
to slide the scale to indicate the fewest number of years
they would be willing to live in Health State A. They could
slide the scale around and see the number of years change,
as though it were an iterative process. This task was completed for all three of the relatively less healthy states. This
modified version of the time trade-off was based on similar work used with adolescents by Moodie et al. [21] and
was necessary for ease of use in a web application.
Section three involved a modified version of the standard
gamble. Participants were presented with three health states.
The first was always perfect health (i.e., Health State A) and
the second was always worst health (i.e., Health State D).
The third health state was either one of the relatively moderate health states (i.e., Health State C or D). Participants were
first instructed that they had the choice between:
1) a 100% chance of living in Health State A and a 0%
chance of living in Health State D, or
2) a 100% chance of living in one of the relatively
moderate health states.
This choice was intentionally set-up with a dominant
decision (i.e., option #1). Provided the participants chose
this option, the chance of living in Health State A was
systematically reduced (and, by corollary, the chance of
living in Health State D was systematically increased).
This process continued until the participants switched
their preference to option #2. This task was completed
for both the relatively moderate health states. This
modified version of the standard gamble was based on
similar work used with adolescents by Juniper et al. [14]
and was necessary for ease of use in a web application.
Page 4 of 9
Piloting the survey
This survey format was piloted with high school students
from Dodgeville High School (Dodgeville, WI, USA). It
took the students between 12 to 18 min to complete the
survey, which was within an acceptable range. Based on
the quantitative and qualitative feedback received from
the pilot, the survey format and some of the instructions
were revised for the development of the final version used
in this study. For example, wording around the instructions for the time trade-off changed based on feedback
from the students.
Study sample
Adolescents from the general population in the United
States were sampled by the University of Wisconsin Survey Center. The sample was derived from a standing
panel of households across the United States that had
previously self-identified as having adolescents and willing
to participate in web surveys. A sample of 100 adolescents
was desired to test the feasibility of conducting this kind
of survey. A response rate of 30% was expected. Consequently, a convenience sample of 300 parents from the
University of Wisconsin Survey Center’s panel of households were sent emails soliciting their adolescents’ interest
in participating in this study.
To be eligible for this study, adolescents had to be
under the age of 18, attending school, able to read and
understand English, and have access to a web-enabled
device. Adolescents were excluded if they did not meet
the inclusion criteria. Participants were given an incentive
of $1 to complete the initial survey and an additional $1 if
they completed the repeat survey. As this was a feasibility
study – primarily aimed at testing the viability of conducting a survey of this nature via the internet – no attempt
was made to have this sample be representative of any
particular population.
At the end of the survey (i.e., the initial survey), participants were asked if they would be willing to re-take the
survey at a later time. Those that agreed were contacted
a week later via email and asked to complete the identical
survey (i.e., the repeat survey). The data were linked by
the University of Wisconsin Survey Center in order for
the research team to perform the comparative analysis between the two surveys.
The survey was anonymous and no data personally
identifying the participants were provided to the investigators. This study was approved by the Institutional
Review Board of the Adolescents’ Hospital of Wisconsin
which waived the need for written consent.
Data analysis
Descriptive statistics were used to characterize the sample for both the initial and repeat surveys. Differences
between samples were tested using the student t-test or
Crump et al. BMC Pediatrics (2018) 18:199
Pearson’s Chi-square, as appropriate. All tests were
two-tailed, and the findings were considered statistically
significant if the p-value was < 0.05.
In order to address this study’s primary aim, the feasibility
of each elicitation method was conceptually defined as participants’ willingness and ability to complete it [22]. “Willingness” was operationalized by measuring the number of
participants who skipped or did not complete the elicitation
method. “Ability” was operationalized by eliciting participants’ feedback as to the difficulty of the method and their
need for assistance. Methods with higher completion rates,
with greater number of participants characterizing it as
being “easy”, and requiring less help from others were considered relatively more feasible.
Two analytic approaches were taken to measure the
reliability and validity of the elicitation methods – the
first of this study’s secondary aims. Reliability was conceptually defined as the method’s ability to reproduce
similarly ranked results over multiple points of administration [22]. For those participants who completed the
initial and repeat surveys, a test-retest comparison was possible. Therefore, reliability was measured separately for each
elicitation method using the Kendall tau-a correlation [23].
Values from the Kendall tau-a can be interpreted as:
1 = complete agreement, − 1 = complete disagreement,
0 = random. Methods with higher Kendall tau-a values
were considered relatively more reliable.
The health states used in this survey were intentionally
constructed to have an expected order: from most to least
preferable (i.e., Health State A through D). Construct validity was conceptually defined by how frequently participants’
respective ordering matched with this expected order. This
definition is similar to how it has been defined in the health
state valuation literature [22]. Operationally, it was measured by the frequency with which the orders matched, for
each elicitation method. Methods with higher rates of expected ordering were considered more valid.
Previous studies eliciting preference for health states
from adolescents have observed differences in the feasibility and reliability of responses across age groups [14, 24].
Preference elicitation methods tend to have higher completion rates and more consistent responses in relatively
older adolescents. Given these observations, then, we
tested whether there were significant differences in terms
of feasibility, reliability, and validity across age groups. To
create relatively equal sub-groups, we categorized participants based on their age into one of six sub-groups:
12 years and under, 13, 14, 15, 16, and 17–18 years of age.
Results
A total of 293 solicitation emails were sent out and delivered (7 emails were undeliverable). From those, 168 adolescents started and completed the initial survey (response
rate = 57%). Of these participants, 23 were dropped
Page 5 of 9
because they were older than 18 and one was dropped because they had already graduated from high school. Thus,
there were a total of 144 participants in this study (participation rate = 49%). Details regarding the non-participants
were not available for comparison. As detailed in Table 1,
the age of participants in the initial survey ranged from 10
to 17 years, with a mean of 14.5 years. The school grade
of participants in the initial survey ranged from 4 to 12,
with the mode being the 9th grade. A total of 103 (72%)
participants repeated the survey one week after the initial
survey. There were no statistically significant differences
in terms of age or grade between those who completed
the initial and repeat surveys.
Feasibility
We assessed the feasibility of the preference elicitation
methods based on the number of elicitation methods
that were completed. As detailed in Table 2, all participants (n = 144; 100%) completed the visual analogue
scale, followed by the standard gamble (n = 139; 97%),
and the time trade-off (n = 109; 76%). A similar pattern
was observed for those methods characterized as being
“very easy”: 82% (n = 118) for the visual analogue scale,
76% (n = 110) for the standard gamble, and 66% (n = 95)
for the time trade-off. A similar number of participants,
Table 1 Sample characteristics for the initial and repeat surveys
Initial survey
n (%)
Repeat survey
n (%)
144
103
10
3 (2)
2 (2)
11
2 (1)
0 (0)
12
13 (9)
10 (10)
13
26 (18)
20 (19)
14
27 (19)
23 (22)
15
28 (19)
18 (17)
16
18 (12)
9 (9)
17
27 (19)
19 (18)
18
0 (0)
2 (2)
4
1 (1)
0 (0)
5
5 (3)
3 (3)
6
5 (3)
6 (6)
7
15 (10)
10 (10)
8
23 (16)
13 (13)
9
34 (24)
24 (23)
10
19 (13)
18 (17)
11
22 (15)
14 (14)
12
20 (14)
15 (15)
Total sample
Test for differences
Age
t = 0.027
p = 0.978
School grade
Chi2 = 2.886
p = 0.941
Crump et al. BMC Pediatrics (2018) 18:199
Page 6 of 9
Table 2 Feasibility assessment includes competition rankings, reported difficulty of each preference elicitation method
n = 144
Visual analogue scale
n (%)
Time trade-off
n (%)
Standard gamble
n (%)
Participants who completed all rankings
144 (100)
109 (76)
139 (97)
118 (82)
95 (66)
110 (76)
Difficulty of method
Very easy
Not too easy / Not too difficult
25 (17)
31 (22)
30 (21)
Very difficult
1 (1)
6 (4)
3 (2)
Missing
0 (0)
12 (8)
1 (1)
Yes
24 (17)
23 (16)
23 (16)
No
119 (83)
109 (76)
120 (83)
Missing
1 (1)
12 (8)
1 (1)
Parent
13 (54)
9 (39)
7 (30)
Sibling
1 (4)
5 (22)
5 (22)
Friend
8 (33)
7 (30)
8 (35)
Other
1 (4)
2 (9)
3 (13)
Missing
1 (4)
0 (0)
0 (0)
Needed help completing the method
Who provided help
16–17%, needed assistance with completing the methods.
Of those that needed assistance, many sought help from a
parent or friend.
For the visual analogue scale completion rates ranged
from 74% (for the 17–18 age group) to 96% (for the
13-year-old age group), however the differences were not
statistically significant (Chi2 = 6.15; p = 0.292). For the
time trade-off, completion rates ranged from 67% (for
both the 12-and-under age group and the 14-year-old age
group) to 85% (for the 17–18 age group), but again these
differences were not significant (Chi2 = 4.53; p = 0.476). Finally, for the standard gamble, completion rates ranged
from 88% (for the 13-year-old age group) to 100% (for all
other age groups, except the 14-year-old age group),
and these differences were not significant (Chi2 = 9.57;
p = 0.088).
scale (ranging from 0.242–0.528), but those in the
16-year-old age category had the lowest (ranging from
− 0.133-0.267). For the time trade-off and the standard gamble, the 14-year-old age category had the
highest Kendall’s tau-a values with the narrowest
range (range from 0.319–0.727 for the time trade-off;
0.506–0.524 for the standard gamble).
Reliability
Visual analogue scale (n = 79)
The results of test-retest analysis are provided in Table 3.
None of the methods demonstrated particularly strong
or weak agreement between the initial and repeat surveys. Kendall’s tau-a values varied within each method,
ranging from 0.204 to 0.402, indicating weak agreements
between the initial and repeat survey.
The proportion of participants who repeated the survey ranged from 47% in the 16-year-old age category to
80% in the 12-and-under age category. Some differences
were observed when comparing the Kendall’s tau-a
across age categories, but in no significant or discernable
pattern. For example, those in the 17–18 age category
had higher Kendall’s tau-a values for the visual analogue
Construct validity
Construct validity was measured by the frequency with
which health states were ranked in accordance with what
was expected (i.e., A ranked higher than B, B ranked
higher than C, etc.), and fully detailed in Table 4. For the
Table 3 Test-retest reliability as assessed by Kendall’s tau-a
scores
Kendall’s tau-a
Health State A
0.20
Health State B
0.40
Health State C
0.29
Health State D
0.30
Time trade-off (n = 68)
Using Health State B
0.38
Using Health State C
0.22
Using Health State D
0.22
Standard gamble (n = 83)
Using Health State B
0.37
Using Health State C
0.25
Crump et al. BMC Pediatrics (2018) 18:199
Page 7 of 9
Table 4 The frequency that health states were ranked as
expected
Frequency (%)
Visual analogue scale
Health State A highest ranking
n = 144
93 (65)
Health State B second highest ranking
57 (40)
Health State C second lowest ranking
60 (42)
Health State D lowest ranking
65 (45)
All ranked as expected
55 (38)
Time trade-off
Health State B highest ranking
n = 109
23 (21)
Health State C middle ranking
10 (9)
Health State D lowest ranking
24 (22)
All ranked as expected
10 (9)
Standard gamble
n = 139
Health State B highest ranking
105 (76)
Health State C lowest ranking
89 (64)
All ranked as expected
70 (50)
visual analogue scale, 65% (n = 93) participants gave
Health State A the highest ranking. However, only 45%
(n = 65) gave Health State D the lowest ranking. A minority (38%) of participants ranked all the health states
as expected.
Because Health State A was used as the reference state
in the time trade-off exercise, only the rankings for Health
States B, C and D could be measured. Compared to the
other methods, the time trade-off had the worst concordance with the expected ranking. No more than 22% of participants ranked any of the health states as expected, and
only 9% ranked all of them as expected.
The standard gamble used Health States A and D as the
reference states, thus only the rankings of B and C could
be measured. The majority of participants ranked Health
States B and C as expected. Half of the participants ranked
the two health states as expected.
When comparing across age groups, there were no statistically significant differences in terms of the number of
health states that were ranking according to expectations.
The visual analogue scale (Chi2 = 4.03; p = 0.545), time
trade-off (Chi2 = 9.03; p = 0.108), and standard gamble
(Chi2 = 3.22; p = 0.666) all performed similarly across the
age groups.
Discussion
The primary purpose of this exploratory study was to assess
whether it was feasible to elicit adolescents’ preferences for
health states using a web-based survey approach. Of the
144 adolescents who initiated the survey, all or nearly all of
them completed the visual analogue scale and standard
gamble, three-quarters of them completed the time
trade-off. A majority of these participants said that they
found the elicitation methods easy, with approximately
16% seeking assistance from someone else. Based on these
results, we believe that a web-based approach for preference elicitation is feasible. Participants were successfully
recruited, engaged, and completed in the survey.
One of the secondary purposes of this study was to
test the reliability and validity of the visual analogue scale,
time trade-off, and standard gamble. In terms of reliability,
none of the methods performed particularly well. The
range of Kendall tau-a values all indicated weak agreement
between the initial and repeat surveys. In terms of construct validity, the number of participants ranking health
states per our expectations for all three elicitation
methods was also poor. The performance of the methods
(i.e., the standard gamble being the relatively-best performing method and the visual analogue scale the
relatively-worst) was opposite of our assumptions. However, the standard gamble also had the fewest comparisons
(two) and, thus, the fewest opportunities for rankings to
be discordant from our expectations.
Results of the reliability and construct validity have us
questioning whether the participants fully understood
the methods and what was being asked of them. This is
even more concerning when taken with the observation
that so many participants ranked these methods as being
very easy. This may be an issue with the preference
elicitation methods. Previously studies employing these
methods and publishing their psychometric properties
have reported mixed results [19]. Or, it may have more to
do with the web-based survey format. While web-based
health studies have been previously used with adolescents
samples [25, 26], we cannot find sufficient evidence as to
the possible effect of this survey format on responses. The
use of web-based surveys for adolescent health studies is
an area that has gone largely un-studied and will require
more research if this mode of administration is to become
more prevalent with this demographic.
The other secondary purpose of this study was to test
for differences across age groups in the reliability and
construct validity of the elicitation methods. None of the
methods demonstrated any significant differences across
age groups in any of the measured outcomes, though
this could be a bi-product of our small age sub-groups.
These observations are supported by previous studies
that have compared differences in preference elicitation
exercises for health states across age groups. In a study
by Juniper et al., participants ranging from 7 to 17 years
old were asked to use a feeling thermometer (a form of
the visual analogue scale) and the standard gamble,
amongst other preference measurement methods. The
authors observed that all but the very youngest participants could comprehend and use the feeling thermometer,
and those with a sixth-grade reading level (i.e., approximately
Crump et al. BMC Pediatrics (2018) 18:199
11–12 years of age) and above could comprehend and use
the standard gamble [14]. Similarly, in using the standard
gamble with participants between 10 and 18 years of age,
Brunner et al. reported that all participants had a good understanding of the methods, but cautioned in their conclusion that results from younger participants should be
carefully examined [24].
This study has several shortcomings that may limit its
generalizability. First, we cannot verify the age of the participant. The initial solicitation was sent to households that were
known to have adolescents under the age of 18. However,
there was no way to verify (other than the question regarding
age and school grade) that it was, in fact, the child who
completed the survey. This is a risk for all internet-based
surveys, which are becoming increasingly more popular to
cost-effectively collect data from large segments of the
populations [27]. Second, we had technical limitations to
construct fully interactive time trade-off and standard
gamble methods. While our modified versions of these
methods have been used in peer-reviewed studies previously, we cannot say definitively how those modification
altered our results regarding the reliability and construct
validity. Third, stratifying our sample into age sub-groups
resulted in small sub-sample sizes (~ 25 participants per
sub-group), which may influence the results. Hence why
this sub-group analysis was left as secondary aim. Larger,
more representative studies would be needed to test differences in the performance of these elicitation methods
across age groups with more confidence.
Despite these limitations, the results from this feasibility
study demonstrate that administering a survey eliciting preferences for health states from adolescents via the web is feasible. These results will be relevant to those health services
researchers trying to develop preference weights for
patient-reported outcome instruments so that they may elicit
preferences using indirect methods [28]. They may also be
relevant to clinicians wanting to incorporate their younger
patients’ perspectives into their clinical decision making [15].
Conclusion
To conclude, using a web-based survey format to elicit preferences for health states from adolescents is feasible. However, the reliability and construct validity of the methods
used to elicit these preferences when using this survey format
are poor. Further research into the effects of a web-based
survey approach to eliciting preferences for health states
from adolescents is needed before health services researchers
or pediatric clinicians widely employ these methods.
Additional file
Additional file 1: Survey instrument. Survey instrument used for this
study. (DOCX 17 kb)
Page 8 of 9
Abbreviations
PROMIS: Patient-Reported Outcomes Measurement Information System
Acknowledgements
The authors would like to acknowledge Dr. Nathan Jones and Ms. Nadia
Assad with the University of Wisconsin Survey Centre for their assistance in
developing the web-based survey used in this study. Also acknowledged is
Ms. Becky Kliebenstein and her senior high class at Dodgeville High School
in Dodgeville, WI for piloting an early version of the survey.
Funding
Financial support for this study was provided entirely by a grant from the
Advancing a Healthier Wisconsin Endowment at the Medical College of
Wisconsin. The funding agreement ensured the authors’ independence in
designing the study, interpreting the data, writing, and publishing the report.
Availability of data and materials
The datasets used and/or analysed during the current study are available
from the corresponding author on reasonable request.
Authors’ contributions
TC – Was responsible for all aspects of the study, analysis, and manuscript
development. RL - Was involved in drafting the manuscript. EC - Made
substantial contributions to conception and design, or acquisition of data,
or analysis and interpretation of data. GC - Was involved in revising the
manuscript critically for important intellectual content. JP - Made substantial
contributions to conception and design, or acquisition of data, or analysis
and interpretation of data. All authors read and approved the final
manuscript.
Ethics approval and consent to participate
This study was approved by the Institutional Review Board of the
Adolescents’ Hospital of Wisconsin, which formally waived the need for
written consent.
Consent for publication
Not applicable.
Competing interests
The authors declare that they have no competing interests.
Publisher’s Note
Springer Nature remains neutral with regard to jurisdictional claims in
published maps and institutional affiliations.
Author details
1
Department of Surgery, University of Calgary, 6601 7007 14 St SW, Calgary,
AB T2V 1P9, Canada. 2Department of Pediatrics, Medical College of
Wisconsin, Milwaukee, WI, USA. 3Department of Pediatrics, University of
Wisconsin, Madison, WI, USA. 4Departments of Paediatrics and Community
Health Sciences, University of Calgary, Calgary, AB, Canada.
Received: 13 December 2017 Accepted: 14 June 2018
References
1. Llewellyn-Thomas H. Health state descriptions: purposes, issues, a proposal.
Med Care. 1996;34:DS109–18.
2. Froberg DG, Kane RL. Methodology for measuring health-state preference-I:
measurement strategies. J Clin Epidemiol. 1989;42:345–54.
3. Drummond M, O’Brien B, Stoddart GL, Torrance GW. Methods for the
economic evaluation of health care programmes. New York: Oxford
University Press; 2000.
4. Janus S, Weernink M, van Til J, Raisch D, van Manen, JG IJzerman M. A
systematic review to identify the use of preference elicitation methods in
health care decision making. ISPOR 17th Annu Eur Congr. Amsterdam, The
Netherlands: International Society for Pharmacoeconomics and Outcomes
Research (ISPOR); 2014. p. PIH66.
5. Froberg DG, Kane RL. Methodology for measuring health-state preferencesII: scaling methods. J Clin Epidemiol. 1989;42:459–71.
Crump et al. BMC Pediatrics (2018) 18:199
6.
7.
8.
9.
10.
11.
12.
13.
14.
15.
16.
17.
18.
19.
20.
21.
22.
23.
24.
25.
26.
27.
28.
de Bekker-Grob EW, Ryan M, Gerard K. Discrete choice experiments in
health economics: a review of the literature. Health Econ. 2012;21:145–72.
Fenner Y, Garland SM, Moore EE, Jayasinghe Y, Fletcher A, Tabrizi SN, et al.
Web-based recruiting for health research using a social networking site: an
exploratory study. J Med Internet Res. 2012;14:1–14.
Ramo DE, Prochaska JJ. Broad reach and targeted recruitment using
Facebook for an online survey of young adult substance use. J Med Internet
Res. 2012;14:1–10.
Close S, Smaldone A, Fennoy I, Reame N, Grey M. Using information
technology and social networking for recruitment of research participants:
experience from an exploratory study of pediatric klinefelter syndrome.
J Med Internet Res. 2013;15:1–11.
Chu JL, Snider CE. Use of a social networking web site for recruiting
Canadian youth for medical research. J Adolesc Health. 2013;52:792–4.
Petrou S. Methodological issues raised by preference-based approaches to
measuring the health status of children. Health Econ. 2003;12:697–702.
Tarride J-E, Burke N, Bischof M, Hopkins RB, Goeree L, Campbell K, et al. A
review of health utilities across conditions common in paediatric and adult
populations. Health Qual Life Outcomes. 2010;8:12.
Prosser LA, Hammitt JK, Keren R. Measuring health preferences for use in
cost-utility and cost-benefit analyses of interventions in children: theoretical
and methodological considerations. PharmacoEconomics. 2007;25:713–26.
Juniper EFF, Guyatt GHH, Feeny DHH, Griffith LEE, Ferrie PJJ. Minimum skills
required by children to complete health-related quality of life instruments for
asthma: comparison of measurement properties. Eur Respir J. 1997;10:2285–94.
Arbuckle R, Abetz-Webb L. “Not just little adults”: qualitative methods to
support the development of pediatric patient-reported outcomes. Patient.
2013;6:143–59.
Sung L, Young NL, Greenberg ML, McLimont M, Samanta T, Wong J, et al.
Health-related quality of life (HRQL) scores reported from parents and their
children with chronic illness differed depending on utility elicitation
method. J Clin Epidemiol. 2004;57:1161–6.
Kwon J, Kim SW, Ungar WJ, Tsiplova K, Madan J, Petrou S. A systematic
review and meta-analysis of childhood health utilities. Med Decis Mak. 2017;
38:277–305.
Forrest CB, Silber JH. Concept and measurement of pediatric value. Acad
Pediatr. 2014;14:S33–8.
Crump R, Beverung L, Lau R, Sieracki R, Nicholson M. Reliability, validity, and
feasibility of direct elicitation of children’s preferences for health states: a
systematic review. Med Decis Mak. 2017;37:314–26.
PROMIS Health Organization and PROMIS Cooperative Group. PROMIS v1.1
Pediatric Profile 25. 2013.
Moodie M, Richardson J, Rankin B, Iezzi A, Sinha K. Predicting time trade-off
health state valuations of adolescents in four Pacific countries using the
assessment of quality-of-life (AQoL-6D) instrument. Value Heal. 2010;13:1014–27.
Dolan P, Gudex C, Kind P, Williams A. Valuing health states: a comparison of
methods. J Health Econ. 1996;15:209–31.
Abdi H. The Kendall rank correlation coefficient. In: Salkind N, editor. Encycl
Meas Stat. Richardson, TX. Thousand Oaks: Sage Publications; 2007.
Brunner HI, Maker D, Grundland B, Young NL, Blanchette V, Stain a M, et al.
Preference-based measurement of health-related quality of life (HRQL) in
children with chronic musculoskeletal disorders (MSKDs). Med Decis Mak.
2003;23:314–22.
Stevens K, Ratcliffe J. Measuring and valuing health benefits for economic
evaluation in adolescence: an assessment of the practicality and validity of
the child health utility 9d in the australian adolescent population. Value
Heal. 2012;15:1092–9.
Ratcliffe J, Huynh E, Chen G, Stevens K, Swait J, Brazier J, et al. Valuing the
child health utility 9D: using profile case best worst scaling methods to
develop a new adolescent specific scoring algorithm. Soc Sci Med. 2016;
157:48–59.
Hays RD, Liu H, Kapteyn A. Use of internet panels to conduct surveys. Behav
Res Methods. 2015;47:685–90.
Chen G, Ratcliffe J. A review of the development and application of
generic multi-attribute utility instruments for Paediatric populations.
PharmacoEconomics. 2015;33:1013–28.
Page 9 of 9