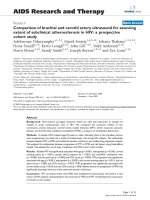
Newborn weight change and childhood cardio-metabolic traits – a prospective cohort study
Bạn đang xem bản rút gọn của tài liệu. Xem và tải ngay bản đầy đủ của tài liệu tại đây (949.17 KB, 8 trang )
Fonseca et al. BMC Pediatrics (2018) 18:211
/>
RESEARCH ARTICLE
Open Access
Newborn weight change and childhood
cardio-metabolic traits – a prospective
cohort study
Maria João Fonseca1* , Milton Severo1,2, Debbie A. Lawlor3,4, Henrique Barros1,2 and Ana Cristina Santos1,2
Abstract
Background: Newborn weight change (NWC) in the first 4 days represents short-term adaptations to external
environment. It may be a key developmental period for future cardio-metabolic health, but this has not been
explored. We aimed to determine the associations of NWC with childhood cardio-metabolic traits.
Methods: As part of Generation XXI birth cohort, children were recruited in 2005/2006 at all public units providing
obstetrical and neonatal care in Porto. Birthweight was abstracted from clinical records and postnatal anthropometry
was obtained by trained examiners during hospital stay. NWC was calculated as ((minimum weight - birthweight)/
birthweight) × 100. At age 4 and 7, children were measured and had a fasting blood sample collected. Fasting glucose,
LDL-cholesterol, triglycerides, waist circumference, systolic and diastolic blood pressure were evaluated. This study
included 312 children with detailed information on growth in very early life and subsequent cardio-metabolic
measures. Path analysis was used to compute adjusted regression coefficients and 95% confidence intervals.
Results: NWC was not associated with any cardio-metabolic traits at ages 4 or 7. Strong associations were observed
between each cardio-metabolic trait at 4 with the same trait at 7 years. The strongest associations were found for waist
circumference [0.725 (0.657; 0.793)] and LDL-cholesterol [0.655 (0.575; 0.735)].
Conclusions: No evidence that NWC is related to childhood cardio-metabolic traits was found, suggesting that NWC
should be faced in clinical practice as a short-term phenomenon, with no medium/long term consequences, at least
in cardio-metabolic health. Our results show strong tracking correlations in cardio-metabolic traits during childhood.
Keywords: Cardio-metabolic risk, Metabolic syndrome, Newborn weight loss
Background
Hypertension, central adiposity, high glucose levels and
adverse lipid profile are damaging cardio-metabolic traits
that co-occur in adults and children and are associated with
future type 2 diabetes and coronary heart disease [1, 2].
There is evidence that exposures during early development
play an important role in the future risk of this adverse
cardio-metabolic health. Barker’s [3] initial description of
an association between low birthweight and higher
cardio-metabolic risk has been confirmed by other authors
[4–7]. More recently, an association between higher birthweight and adverse cardio-metabolic health has also been
* Correspondence: ;
1
EPIUnit - Instituto de Saúde Pública, Universidade do Porto, Rua das Taipas
n° 135, 4050-600 Porto, Portugal
Full list of author information is available at the end of the article
reported, including in children [5, 8, 9]. Different patterns
of postnatal weight change have also been found to
associate with future cardio-metabolic health, and recent
evidence suggests that body mass index (BMI) in childhood
is more strongly related to adverse cardio-metabolic health
than birthweight [10, 11].
These studies have not examined the association of
weight change in the immediate postnatal period with
later health outcomes, largely because few studies have
such data. In the immediate postnatal period, newborns
lose around 6% of their birthweight [12, 13]. Although this
is considered a normal physiological process, there is
considerable variation between newborns in the amount
of weight lost during this period [12, 13]. Extreme values
of newborn weight change (NWC) in the immediate
postnatal period, which is mainly related to inadequate or
© The Author(s). 2018 Open Access This article is distributed under the terms of the Creative Commons Attribution 4.0
International License ( which permits unrestricted use, distribution, and
reproduction in any medium, provided you give appropriate credit to the original author(s) and the source, provide a link to
the Creative Commons license, and indicate if changes were made. The Creative Commons Public Domain Dedication waiver
( applies to the data made available in this article, unless otherwise stated.
Fonseca et al. BMC Pediatrics (2018) 18:211
excess hydration, are associated with adverse neonatal
health [14, 15], but its association with subsequent
cardio-metabolic health is unknown.
We hypothesized that NWC during the first 96 h is
associated with cardio-metabolic traits in later childhood,
through developmental adaptations occurring during this
period, when newborns have to rapidly adapt their energy
intake and expenditure to external conditions [6]. Accordingly, our primary aim was to evaluate the association of NWC with cardio-metabolic traits assessed at
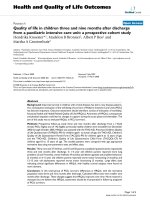
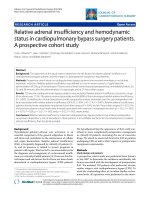
age 4 and 7 years. We also explored whether the associations of NWC with these traits at age 7 were direct
or mediated by the same traits at age 4 as represented
in Fig. 1, and estimated all the paths represented in
the figure. To our knowledge this is the first study to
examine the associations of NWC with later
cardio-metabolic traits.
Methods
Participants
The participants of this study are part of the Generation
XXI birth cohort [16], assembled between April 2005 and
August 2006, after delivery, during the hospital stay, at the
five public units providing obstetrical and neonatal care in
the metropolitan area of Porto, Portugal. Follow-up
assessments of the cohort have been undertaken when the
children were aged 4 years (April 2009 – July 2011), and 7
(April 2012 – January 2014).
All newborns were routinely weighed at birth and, since
November 2005, whenever possible, newborns additionally
had a second weight measurement performed by a trained
examiner during their hospital stay. Since November 2005,
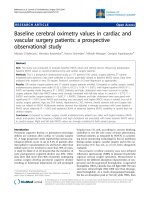
5034 newborns were recruited to Generation XXI, of which
4449 were full-term singletons without known congenital
anomalies. Of those 4449 children, a random sub-sample of
1806 newborns had the second neonatal weight measurement. This group of 1806 children were eligible for this
study and of that 1806, 471 had missing information on
exact time of measurement during hospital stay, 28 were
measured after 96 h of life (the period of interest was the
first 96 h of life) and 19 were considered outliers [1st/3rd
quartile ±3 times the interquartile range corresponding to
those with weight loss higher than 0.50% of birthweight per
hour (n = 15) and those with weigh gain higher than 0.19%
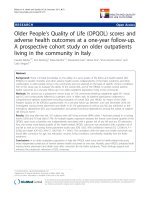
of birthweight per hour (n = 4)]. Of the remaining 1288,
312 children had complete data on all key variables and are
the participants included in this study. Figure 2 shows the
Page 2 of 8
study flow chart of participants. Similar characteristics were
found between participants and eligible non-participants
(Additional file 1).
Baseline evaluation
The second weight measurement of the newborn was
performed by trained examiners, during the hospital
stay, but independently of routine procedures. Newborns
were weighted after the questionnaire to the mother,
without clothes or diaper. The same digital scales were
used (seca®) to weight all newborns to the nearest 1 g,
after waiting for the scale to stabilize. The date and time
of measurement were registered. The measurement time
varied from 6.3 to 96.0 h of life, mean of 45.3 (SD 19.4)
hours. We calculated NWC using the formula:
NWC(%) = ((estimated minimum weight – birthweight) / birthweight) × 100.
where estimated minimum weight was the predicted
weight at 52.3 h of life - the mean nadir time of lowest
weight in the first 96 h in European infants [13]. This
was estimated for each child using a cubic regression
model as described in the statistical analysis section.
Information on family and personal history of disease,
socio-demographic characteristics, maternal pre-pregnancy
anthropometric parameters, and intra-uterine exposures
were collected during a face-to-face interview conducted
during the hospital stay by trained interviewers. These interviews took place 24 to 72 h after delivery. Data on delivery and newborn characteristics, including birthweight and
gestational age, were abstracted from clinical records by the
same interviewers.
Follow-up evaluations
At 4 and 7 years of age, trained researchers performed
anthropometric and blood pressure measurements and
obtained a fasting blood sample, according to standard
procedures. Waist circumference measurements were taken
with an inextensible tape measure to the nearest 0.1 cm, at
the umbilicus level, with the child in a standing position,
the abdomen relaxed, arms at the sides and feet positioned
together [17]. Blood pressure was measured with an
electronic sphygmomanometer (Omron®), with the child
conformably sitting in a chair, with the cuff on the
non-dominant arm, 2–3 cm above the elbow (without
clothes compressing the arm). Two measurements of
systolic (SBP) and diastolic (DPB) blood pressure, separated
by at least 5 min, were taken after 10-min rest. If the
Fig. 1 Hypothesized mechanism linking newborn weight change with cardio-metabolic risk at ages 4 and 7 years: an overall effect with direct
and indirect components
Fonseca et al. BMC Pediatrics (2018) 18:211
Page 3 of 8
Fig. 2 Study flow chart of participants
difference between them was less than 5 mmHg for
SBP or DBP, the mean was calculated. If the difference
was larger than 5 mmHg a third measurement was
taken and the mean of the 2 closest values was used
[18]. After an overnight fast, a venous blood sample
was collected before 11 a.m., according to standard
procedures, after applying a topical analgesic cream
(EMLA cream). This blood sample was centrifuged at
3500 rpm for 10 min and then the supernatant (serum)
was stored at − 80 °C. Glucose was measured using UV
enzymatic assay (hexokinase method), total and high
density lipoprotein-cholesterol (for posterior calculation of LDL-C using Friedewald equation) [19], and
triglycerides (TG) using an enzymatic colorimetric
assay, in the Clinical Pathology Department of Centro
Hospitalar São João, Porto, Portugal.
Our outcomes were: glucose, LDL-C, TG, waist circumference, SBP and DBP. In order to be able to compare magnitudes of association between different cardio-metabolic
traits, we generated age- and sex-specific z-scores. For
fasting glucose, LDL-C, TG and waist circumference this
was done using the age- (in 6-months categories) and
sex-specific means and standard deviations (SD) from
the whole Generation XXI cohort. For SBP and DBP,
we generated age-, sex- and height-specific z-scores
using the means and standard deviations recommended
by the American Academy of Pediatrics, in order to
generate measures of BP that are independent of height
(a major contribution to BP variation in children) [18].
High levels of the outcomes were considered when
above the 90th percentile.
All the phases of the study complied with the Ethical
Principles for Medical Research Involving Human Subjects
expressed in the Declaration of Helsinki. The study was
approved by the University of Porto Medical School/ Centro Hospitalar São João ethics committee and all parents
or legal representative signed an informed consent according Helsinki.
STROBE checklist for the present manuscript can be
found in Additional file 2.
Fonseca et al. BMC Pediatrics (2018) 18:211
Page 4 of 8
Statistical analysis
The estimated nadir time was 52.3 h of life, thus, weights
used to calculate NWC were birthweight and the weight
estimated at 52.3 h of life. A cubic model with random
intercept and slope by subject [weight(t)~3241.442
+ (−9.378) × t + 0.119 × t2 + (−0.0004) × t3 + b0i + b1i × t]
was used to estimate the weight according to the newborn’s age represented as t in the formula (this analysis
was performed using R version 2.14.1) [13].
Proportions were compared using the chi-square test,
and means were compared using student’s t-test or
ANOVA (analysis performed using SPSS version 21.0).
Pearson correlations were also computed. Crude and adjusted linear regression coefficients (β) and 95% confidence
intervals (95% CI) were computed using path analysis. Full
information maximum likelihood estimation was used to
handle missing values, assuming missing at random [20].
We conducted path analysis based on the theoretical model
depicted in Fig. 1 and tested the fit of the model with
potential confounders. The final model included NWC,
maternal education, maternal pre-pregnancy BMI, gestational age, and birthweight as explanatory variables. Path
analysis was performed with Mplus software (version 7);
95% confidence intervals were calculated by bootstrapping.
The fit of the models was assessed using different indexes:
the Comparative Fit Index (CFI) [21], the Tucker–Lewis
Index (TLI) [22], and the Root Mean Square Error of
Approximation (RMSEA) [23]. A good model fit is indicated by a CFI and TLI values ≥0.90 and values of RMSEA
close to 0.
Results
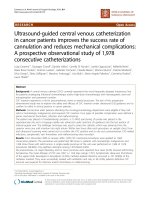
Table 1 shows the mean and standard deviation (or median
and interquartile range for TG due to non-normal distribution) of NWC and all cardio-metabolic traits (glucose,
LDL-C, TG, waist circumference, SBP and DBP) and also
the number of children above the 90th percentile of the
outcomes. Mean NWC was − 6.86% (ranging from − 15.03
and 5.30%). Mean values of all cardio-metabolic traits increased between 4 and 7 years, with the exception of
LDL-C and TG which decreased.
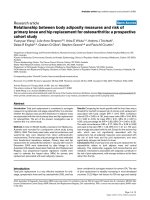
Table 2 presents unadjusted correlations of NWC and
cardio-metabolic trait z-scores in childhood. There was no
strong evidence of association of NWC with any of the
cardio-metabolic traits at age 4 or 7. There were correlations between some cardio-metabolic traits at each age
and traits at age 4 were positively associated with the same
trait at age 7.
Table 3 presents linear regression coefficients and 95%
confidence intervals showing the adjusted total association
of NWC with cardio-metabolic traits at ages 4 (model 1)
and 7 (model 1) and the adjusted direct association of
NWC with cardio-metabolic traits at age 7 (model 2),
from the path analysis. These were consistent with the
unadjusted association, with no strong evidence that
NWC was associated with cardio-metabolic traits at age 4
or 7. Cardio-metabolic traits at age 4 were associated with
the same trait at age 7, with the strongest associations
observed for waist circumference [adjusted regression
coefficient: 0.725 (0.657; 0.793)] and LDL-C [adjusted
regression coefficient: 0.655 (0.575; 0.735)].
Discussion
We evaluated the association of NWC during the first
96 h of life with childhood cardio-metabolic outcomes. To
our knowledge, no previous studies have longitudinally
examined these associations. Similar to previous reports,
we found that newborns lost on average 7% of their birthweight in the first 96 h of life. No robust evidence that
NWC influenced childhood cardio-metabolic traits was
Table 1 Characteristics of the study sample at baseline, 4 and 7 years follow-up
Baseline
4 years follow-up
7 years follow-up
Newborn weight change (%), mean (SD)
−6.86 (2.32)
–
–
Glucose (mg/dL), mean (SD)
–
77.9 (7.9)
83.0 (5.7)
–
22 (7.1)
27 (8.7)
–
107.0 (23.5)
99.8 (22.2)
–
30 (9.6)
31 (9.9)
–
61.0 (25.0)
55.0 (28.0)
–
30 (9.6)
28 (9.0)
Waist circumference (cm), mean (SD)
–
52.0 (4.2)
58.3 (6.2)
High waist circumference, n (%)
–
20 (6.4)
25 (8.0)
–
97.3 (7.6)
105.0 (8.7)
–
23 (7.4)
66 (21.2)
–
56.1 (7.8)
69.2 (7.4)
–
21 (6.7)
102 (32.7)
High glucose, n (%)
LDL-C (mg/dL), mean (SD)
High LDL-C, n (%)
Triglycerides (mg/dL), median (IQR)
High triglycerides, n (%)
Systolic blood pressure (mmHg), mean (SD)
High systolic blood pressure, n (%)
Diastolic blood pressure (mmHg), mean (SD)
High diastolic blood pressure, n (%)
Abbreviations: LDL-C low density lipoprotein cholesterol, SD standard deviation
Fonseca et al. BMC Pediatrics (2018) 18:211
Page 5 of 8
Table 2 Correlations of newborn weight change (in first 96 h) and cardio-metabolic risk factors z-scores in childhood
4 years
7 years
Glucose LDLC
NWC
4 years Glucose
TG
Waist
circumf.
SBP
DBP
Glucose
LDL-C
TG
Waist
circumf.
SBP
DBP
−0.020
0.015
0.041 0.014 −0.015
0.071
0.057
0.025
0.007
0.046
0.044
0.108
0.049
0.090
0.096
0.062
−0.032
− 0.044
− 0.007
1
0.039 0.036 0.151**
0.039
0.019
0.266*** 0.081
LDL-C
–
1
0.053 0.031
0.041
−0.027
0.015
0.667*** 0.042
TG
–
–
1
0.053
0.047
0.086
−0.119*
0.064
0.295*** 0.047
−0.043
−0.002
Waist
circumf.
–
–
–
1
0.226*** 0.344*** 0.091
−0.007
0.133*
0.776***
0.160**
0.097
SBP
–
–
–
–
1
0.369*** 0.033
−0.007
0.000
0.207***
0.367*** 0.307***
DBP
–
–
–
–
–
1
0.033
−0.028
−0.013
0.242***
0.164**
0.175**
–
–
–
–
–
–
1
0.098
0.089
0.090
0.154**
0.116*
7 years Glucose
LDL-C
–
–
–
–
–
–
–
1
0.120*
−0.020
0.047
0.078
TG
–
–
–
–
–
–
–
–
1
0.135*
0.024
0.015
Waist
circumf.
–
–
–
–
–
–
–
–
–
1
0.262***
0.172**
SBP
–
–
–
–
–
–
–
–
–
–
1
0.554***
DBP
–
–
–
–
–
–
–
–
–
–
–
1
Abbreviations: DBP diastolic blood pressure, LDL-C low density lipoprotein cholesterol, NWC newborn weight change, SBP systolic blood pressure, TG triglycerides
*p < 0.05
**p < 0.01.
***p < 0.001.
found. Tracking correlation coefficients between ages 4
and 7 years were found for all cardio-metabolic traits, with
the strongest being for waist circumference and LDL-C.
The prevalence of adverse levels of cardio-metabolic
traits, such as central obesity, impaired glucose tolerance,
dyslipidemia, and hypertension, has been increasing
among children [1, 8]. Also, the co-occurrence of adverse
levels of these cardio-metabolic traits, known as metabolic
syndrome, has recently been identified in children, and its
prevalence is around 3% but tending to increase [1, 24].
The tracking found in regards to all cardio-metabolic
traits indicates that prevention should start as early as
possible, because, according to our results, a 4-year-old
child with adverse levels of cardio-metabolic traits will
probably be a 7-year-old child also with adverse levels,
and, according to previous studies, will probably have
adverse levels across life [25]. Bearing in mind this remark,
early screening of the levels of cardio-metabolic traits in
children may indeed be justified from the point of view of
cardio-metabolic chronic disease prevention. So, studies
showing the normal cardio-metabolic traits distribution
during childhood are of importance [26–28].
The biological mechanisms by which weight change
during critical periods could lead to chronic diseases remain unclear. Theories of early programming hypothesize
that under- or over- nutrition and other insults, when
occurring during critical periods of development, may lead
to permanent alterations in tissues’ structure and functions, and in the neuroendocrine systems [6, 29].
Nevertheless, the exact timing of programming that contributes to the medium/long-term risk continues to be debated. There is some evidence that different early growth
patterns may precede the development of adverse levels of
cardio-metabolic traits later in life [5, 30–33], with a
recent genetic study in 22,769 Europeans finding genetic
evidence for a causal link between age and BMI at adiposity rebound and subsequent cardio-metabolic ill-health.
However, the medium/long-term consequences of weight
changes during the very first days of life had not been
studied until now because very few studies have a second
weight measure after birth within the first 96 h.
The nearest studies we could find to this very early
period of rapid weight loss and major adaptation, were
two recent studies, one of which examined weight change
in the first week of life [34] and the second the first two
weeks [35]; both found higher weight gain in these periods
was associated with greater odds of overweight in adulthood and childhood, respectively. However, these studies
considered a period when the NWC nadir had already
occurred, so all newborns evaluated in those studies were
already gaining weight. On the other hand, in our time
frame, almost all newborns lost weight, because it focused
in the first 96 h of life. Additionally, none of the studies
examine NWC in relation to the cardio-metabolic traits
analyzed in the present study.
Extreme values of NWC in the immediate postnatal
period are associated with adverse health outcomes in the
neonatal period, such as hypernatremic dehydration, which
Fonseca et al. BMC Pediatrics (2018) 18:211
Page 6 of 8
Table 3 Adjusted associations between newborn weight change, cardio-metabolic indicators at age 4 and cardio-metabolic
indicators at age 7 from path analysis
NWC (%)
Cardio-metabolic indicators at age 4 (z-score)
β1 (95%CI)
β5 (95%CI)
Glucose z-score
0.004 (−0.043; 0.051)
–
LDL-cholesterol z-score
0.017 (−0.031; 0.065)
–
Triglycerides z-score
0.004 (−0.040; 0.049)
–
Waist circumference z-score
−0.003 (− 0.046; 0.039)
–
Systolic blood pressure z-score
0.017 (−0.016; 0.049)
–
Diastolic blood pressure z-score
0.015 (−0.018; 0.048)
–
Glucose z-score
0.008 (−0.035; 0.051)
–
LDL-cholesterol z-score
0.001 (−0.045; 0.047)
–
Triglycerides z-score
0.017 (−0.025; 0.060)
–
Waist circumference z-score
0.019 (−0.022; 0.060)
–
Systolic blood pressure z-score
0.031 (−0.006; 0.067)
–
Diastolic blood pressure z-score
−0.010 (− 0.040; 0.020)
–
Glucose z-score
0.007 (−0.035; 0.048)
0.235 (0.136; 0.334)*
LDL-cholesterol z-score
−0.012 (− 0.045; 0.022)
0.655 (0.575; 0.735)*
Triglycerides z-score
0.016 (−0.024; 0.057)
0.281 (0.180; 0.383)*
Cardio-metabolic indicators at age 4
Model 1
Cardio-metabolic indicators at age 7
Model 1
Model 2
Waist circumference z-score
0.021 (−0.008; 0.025)
0.725 (0.657; 0.793)*
Systolic blood pressure z-score
0.025 (−0.009; 0.058)
0.369 (0.251; 0.488)*
Diastolic blood pressure z-score
−0.013 (− 0.042; 0.016)
0.153 (0.050; 0.256)*
Abbreviations: NWC newborn weight change, LDL low density lipoprotein, β regression coefficient, CI confidence interval
Cardio-metabolic indicator at age 4 (Model 1) ≈ β0 + β1 (NWC) + β2 (maternal education) + β3 (maternal pre-pregnancy BMI) + β4 (gestational age) + β5 (birth weight)
Cardio-metabolic indicator at age 7 (Model 1) ≈ β0 + β1 (NWC) + β2 (maternal education) + β3 (maternal pre-pregnancy BMI) + β4 (birth weight)
Cardio-metabolic indicator at age 7 (Model 2) ≈ β0 + β1 (NWC) + β2 (maternal education) + β3 (maternal pre-pregnancy BMI) + β4 (birth weight) + β5 (same
cardio-metabolic indicator at 4)
*p < 0.05.
can cause serious medical complications, such as disseminated intravascular coagulation, cerebrovascular accidents
and even death, or, on the other hand, over hydration and
related morbidities such as bronchopulmonary dysplasia,
intraventricular–periventricular hemorrhage, necrotizing
enterocolitis and patent ductus arteriosus [14, 15]. Even
though extreme values of NWC has adverse effects in the
neonatal period, it does not appear to have long term
adverse cardio-metabolic effects.
Limitations and strengths
A large proportion of the main cohort participants were
not included in our analyses. However, distributions of
maternal and neonatal characteristics between participants and eligible non-participants were similar. Our finding that NWC during the first 96 h was not associated
with childhood cardio-metabolic traits might be due to
lack of statistical power, but the point estimates were all
close to the null and the 95%CI were narrow, suggesting
that we had adequate power to obtain precise estimates
and rule out an important association.
As weight measurements were not taken at regular
periods for each newborn, it is possible that the precise
nadir of NWC was not detected. Nevertheless, a systematic review [12] found a mean NWC ranged from − 5.7%
to − 6.6% and a nadir around the 2nd and 3rd days following birth. These results support our methodology as we
found a mean NWC of − 6.7% occurring at 52.3 h of life
[13], suggesting that we correctly estimate the actual nadir
in our sample.
We used path analysis to explore associations. This is
an extension of regression analysis, which allows for
simultaneous estimation of the interrelations between
variables. We used it here because it is a useful method
Fonseca et al. BMC Pediatrics (2018) 18:211
for comparing the magnitudes of effects between variables with complex interrelations or to test the plausibility of mediation effects [36].
Our exposure – NWC – measures the growth occurring
within 96 h, which is a very narrow period. It is known that
the measurement error on weight change is higher and the
capacity to identify associations between growth periods
and outcomes reduced, when the measurements are closer
in time and the weight change is smaller [37]. Since measurement error in NWC is unlikely to be related to later
child cardio-metabolic outcomes (the midwives and trained
researchers who measured birth and later weight would
have no way of knowing the future cardio-metabolic traits
of the newborns they were assessing), the expectation
would be for this random error to attenuate the observed
associations, however the bias would also depend on
relationships of the error to other explanatory variables in
the model. We doubt it would fully explain the consistent
null results we find across all traits.
Although cardio-metabolic traits in early childhood
track throughout childhood (as we showed) and into
adulthood, clinically abnormal values of cardio-metabolic
risk factors, such as fasting glucose or SBP, are unusual in
childhood [38], and it is possible that the medium/long-term effects of NWC on cardio-metabolic health are not
yet fully evident at the ages we have assessed. Future
research conducted as this population ages will enable this
possibility to be explored.
Conclusions
We found no strong evidence that NWC is related to
cardio-metabolic traits at age 4 or 7, suggesting that
NWC does not influence the development of adverse
cardio-metabolic outcomes at least up to age 7. Thus,
NWC should be faced in clinical practice as a short-term
phenomenon, with no medium/long term consequences,
at least in cardio-metabolic health.
Additional files
Additional file 1: Comparison between participants and eligible non
participants regarding maternal, pregnancy, delivery and newborn
characteristics. Table with the comparison between participants and
eligible non participants. (DOCX 35 kb)
Additional file 2: STROBE Statement—Checklist of items that should be
included in reports of cohort studies. A STROBE checklist for the present
manuscript. (DOC 85 kb)
Abbreviations
BMI: Body mass index; DBP: Diastolic blood pressure; LDL-C: Low density
lipoprotein cholesterol; NWC: Newborn weight change; SBP: Systolic blood
pressure; TG: Triglycerides
Acknowledgements
The authors gratefully acknowledge the families enrolled in Generation XXI
for their kindness, all members of the research team for their enthusiasm
Page 7 of 8
and perseverance and the participating hospitals and their staff for their help
and support.
Funding
This work was supported by Programa Operacional de Saúde – Saúde XXI,
Quadro Comunitário de Apoio III and Administração Regional de Saúde Norte
(Regional Department of Ministry of Health); FEDER through the Operational
Programme Competitiveness and Internationalization and national funding
from the Foundation for Science and Technology – FCT (Portuguese Ministry
of Science, Technology and Higher Education) [POCI-01- 0145-FEDER-016837],
under the project “PathMOB.: Risco cardiometabólico na infância: desde o início
da vida ao fim da infância” [Ref. FCT PTDC/DTP-EPI/3306/2014], and FCT
Investigator contract [IF/01060/2015] - ACS; Unidade de Investigação em
Epidemiologia - Instituto de Saúde Pública da Universidade do Porto (EPIUnit)
[POCI-01-0145-FEDER-006862; Ref. UID/DTP/04750/2013]; Norte Portugal
Regional Operational Programme (NORTE 2020), under the PORTUGAL 2020
Partnership Agreement, through the European Regional Development Fund
(ERDF) - DOCnet (NORTE-01-0145-FEDER-000003); UK Medical Research Council
[MC_UU_12013/5] and UK National
Institute of Health Research Senior Investigator [NF-SI-0611-10196] – DAL.
Availability of data and materials
The datasets used and/or analysed during the current study are available
from the corresponding author on reasonable request.
Authors’ contributions
MJF conceptualized the study, carried out statistical analyses, drafted the initial
manuscript, and approved the final manuscript as submitted. MS carried out
statistical analyses, reviewed the manuscript, and approved the final manuscript
as submitted. DAL critically reviewed and revised the manuscript, and approved
the final manuscript as submitted. HB designed the data collection instruments,
and coordinated and supervised data collection, critically reviewed the
manuscript, and approved the final manuscript as submitted. ACS designed the
data collection instruments, and coordinated and supervised data collection,
conceptualized the study, reviewed and revised the manuscript, and approved
the final manuscript as submitted.
Ethics approval and consent to participate
All the phases of the study complied with the Ethical Principles for Medical
Research Involving Human Subjects expressed in the Declaration of Helsinki.
The study was approved by the University of Porto Medical School/ Centro
Hospitalar São João ethics committee and all parents or legal representative
signed an informed consent according Helsinki.
Consent for publication
Not applicable.
Competing interests
The authors declare that they have no competing interests.
Publisher’s Note
Springer Nature remains neutral with regard to jurisdictional claims in
published maps and institutional affiliations.
Author details
1
EPIUnit - Instituto de Saúde Pública, Universidade do Porto, Rua das Taipas
n° 135, 4050-600 Porto, Portugal. 2Departamento de Ciências da Saúde
Pública e Forenses e Educação Médica, Faculdade de Medicina, Universidade
do Porto, Porto, Portugal. 3Medical Research Council Integrative
Epidemiology Unit at the University of Bristol, Bristol, UK. 4School of Social
and Community Medicine, University of Bristol, Bristol, UK.
Received: 13 December 2017 Accepted: 20 June 2018
References
1. Weiss R, Dziura J, Burgert TS, Tamborlane WV, Taksali SE, Yeckel CW, Allen K,
Lopes M, Savoye M, Morrison J, et al. Obesity and the metabolic syndrome
in children and adolescents. N Engl J Med. 2004;350(23):2362–74.
2. Lassale C, Tzoulaki I, Moons KGM, Sweeting M, Boer J, Johnson L, Huerta JM,
Agnoli C, Freisling H, Weiderpass E, et al. Separate and combined
Fonseca et al. BMC Pediatrics (2018) 18:211
3.
4.
5.
6.
7.
8.
9.
10.
11.
12.
13.
14.
15.
16.
17.
18.
19.
20.
21.
22.
23.
24.
25.
26.
27.
associations of obesity and metabolic health with coronary heart disease:
a pan-European case-cohort analysis. Eur Heart J. 2018;39(5):397–406.
Barker DJ, Hales CN, Fall CH, Osmond C, Phipps K, Clark PM. Type 2 (noninsulin-dependent) diabetes mellitus, hypertension and hyperlipidaemia
(syndrome X): relation to reduced fetal growth. Diabetologia. 1993;36(1):62–7.
Lakshmy R. Metabolic syndrome: role of maternal undernutrition and fetal
programming. Rev Endocr Metab Disord. 2013;14(3):229–40.
Chiavaroli V, Marcovecchio ML, de Giorgis T, Diesse L, Chiarelli F, Mohn A.
Progression of cardio-metabolic risk factors in subjects born small and large
for gestational age. PLoS One. 2014;9(8):e104278.
Hales CN, Barker DJ. The thrifty phenotype hypothesis. Br Med Bull. 2001;60:5–20.
Wells JC. The programming effects of early growth. Early Hum Dev.
2007;83(12):743–8.
Beilin L, Huang RC. Childhood obesity, hypertension, the metabolic
syndrome and adult cardiovascular disease. Clin Exp Pharmacol Physiol.
2008;35(4):409–11.
Boney CM, Verma A, Tucker R, Vohr BR. Metabolic syndrome in childhood:
association with birth weight, maternal obesity, and gestational diabetes
mellitus. Pediatrics. 2005;115(3):e290–6.
Hardy R, Lawlor DA, Kuh D. A life course approach to cardiovascular aging.
Futur Cardiol. 2014;11(1):101–13.
Howe LD, Tilling K, Benfield L, Logue J, Sattar N, Ness AR, Smith GD, Lawlor
DA. Changes in ponderal index and body mass index across childhood and
their associations with fat mass and cardiovascular risk factors at age 15.
PLoS One. 2011;5(12):e15186.
Noel-Weiss J, Courant G, Woodend AK. Physiological weight loss in the
breastfed neonate: a systematic review. Open Med. 2008;2(4):e99–e110.
Fonseca MJ, Severo M, Santos AC. A new approach to estimating weight
change and its reference intervals during the first 96 hours of life. Acta
Paediatr. 2015;104(10):1028–34.
Bell EF, Warburton D, Stonestreet BS, Oh W. Effect of fluid administration on
the development of symptomatic patent ductus arteriosus and congestive
heart failure in premature infants. N Engl J Med. 1980;302(11):598–604.
van Dommelen P, van Wouwe JP, Breuning-Boers JM, van Buuren S, Verkerk
PH. Reference chart for relative weight change to detect hypernatraemic
dehydration. Arch Dis Child. 2007;92(6):490–4.
Larsen PS, Kamper-Jorgensen M, Adamson A, Barros H, Bonde JP, Brescianini
S, Brophy S, Casas M, Charles MA, Devereux G, et al. Pregnancy and birth
cohort resources in europe: a large opportunity for aetiological child health
research. Paediatr Perinat Epidemiol. 2013;27(4):393–414.
Gibson RS. Principles of nutritional assessment, 2nd edn. New York, NY, USA:
Oxford University Press; 2005.
National High Blood Pressure Education Program Working Group on High
Blood Pressure in C, Adolescents. The fourth report on the diagnosis,
evaluation, and treatment of high blood pressure in children and
adolescents. Pediatrics. 2004;114(2 Suppl 4th Report):555–76.
Friedewald WT, Levy RI, Fredrickson DS. Estimation of the concentration of
low-density lipoprotein cholesterol in plasma, without use of the
preparative ultracentrifuge. Clin Chem. 1972;18(6):499–502.
Yuan KH, Bentler PM. Three likelihood-based methods for mean and
covariance structure analysis with nonnormal missing data. In: Sobel, Becker,
editors. Sociological Methodology; 2000. p. 165–200.
Bentler PM. Comparative fit indexes in structural models. Psychol Bull.
1990;107(2):238–46.
Tucker L, Lewis C. A reliability coefficient for maximum likelihood factor
analysis. Psychometrika. 1973;38:1–10.
Steiger JH. Structural model evaluation and modification. An interval
estimation approach. Multivar Behav Res. 1990;25:173–80.
Friend A, Craig L, Turner S. The prevalence of metabolic syndrome in
children: a systematic review of the literature. Metab Syndr Relat
Disord. 2013;11(2):71–80.
Camhi SM, Katzmarzyk PT. Tracking of cardiometabolic risk factor clustering
from childhood to adulthood. Int J Pediatr Obes : IJPO : an official journal of
the International Association for the Study of Obesity. 2010;5(2):122–9.
De Henauw S, Michels N, Vyncke K, Hebestreit A, Russo P, Intemann T,
Peplies J, Fraterman A, Eiben G, de Lorgeril M, et al. Blood lipids among
young children in Europe: results from the European IDEFICS study. Int J
Obes. 2014;38(Suppl 2):S67–75.
Jolliffe CJ, Janssen I. Distribution of lipoproteins by age and gender in
adolescents. Circulation. 2006;114(10):1056–62.
Page 8 of 8
28. Mascarenhas LP, Leite N, Titski AC, Brito LM, Boguszewski MC. Variability of
lipid and lipoprotein concentrations during puberty in Brazilian boys. J
Pediatr Endocrino Metab : JPEM. 2015;28(1–2):125–31.
29. Lawlor DA. The Society for Social Medicine John Pemberton Lecture 2011.
Developmental overnutrition–an old hypothesis with new importance? Int J
Epidemiol. 2013;42(1):7–29.
30. Ekelund U, Ong KK, Linne Y, Neovius M, Brage S, Dunger DB, Wareham NJ,
Rossner S. Association of weight gain in infancy and early childhood with
metabolic risk in young adults. J Clin Endocrinol Metab. 2007;92(1):98–103.
31. Eriksson JG, Forsen T, Tuomilehto J, Osmond C, Barker DJ. Early growth
and coronary heart disease in later life: longitudinal study. BMJ. 2001;
322(7292):949–53.
32. Eriksson JG, Forsen T, Tuomilehto J, Osmond C, Barker DJ. Early adiposity
rebound in childhood and risk of type 2 diabetes in adult life. Diabetol.
2003;46(2):190–4.
33. Ong KK, Ahmed ML, Emmett PM, Preece MA, Dunger DB. Association
between postnatal catch-up growth and obesity in childhood: prospective
cohort study. BMJ. 2000;320(7240):967–71.
34. Stettler N, Stallings VA, Troxel AB, Zhao J, Schinnar R, Nelson SE, Ziegler EE,
Strom BL. Weight gain in the first week of life and overweight in adulthood:
a cohort study of European American subjects fed infant formula.
Circulation. 2005;111(15):1897–903.
35. Andersen LG, Holst C, Michaelsen KF, Baker JL, Sorensen TI. Weight and
weight gain during early infancy predict childhood obesity: a case-cohort
study. Int J Obes. 2012;36(10):1306–11.
36. Gamborg M, Andersen PK, Baker JL, Budtz-Jorgensen E, Jorgensen T, Jensen
G, Sorensen TI. Life course path analysis of birth weight, childhood growth,
and adult systolic blood pressure. Am J Epidemiol. 2009;169(10):1167–78.
37. Wells JC, Hallal PC, Wright A, Singhal A, Victora CG. Fetal, infant and
childhood growth: relationships with body composition in Brazilian boys
aged 9 years. Int J Obes. 2005;29(10):1192–8.
38. Expert panel on integrated guidelines for cardiovascular health and risk
reduction in children and adolescents: summary report. Pediatrics. 2012;
128(Suppl 5):S213–56.