Thực trạng thừa cân, béo phì và hiệu quả của một số giải pháp can thiệp ở học sinh tiểu học tại thành phố Bắc Ninh (TT ANH)
Bạn đang xem bản rút gọn của tài liệu. Xem và tải ngay bản đầy đủ của tài liệu tại đây (269.18 KB, 30 trang )
MINISTRY OF TRAINING AND
MINISTRY OF HELATH
EDUCATION
HA NOI MEDICAL UNIVERSITY
NGO THI XUAN
THE SITUATION OF OVERWEIGHT, OBESITY
AND EFFECTIVENESS OF INTERVENTIONS IN
TREATMENT AMONG PRIMARY SCHOOL
PUPILS IN BAC NINH CITY
Sector: pediatrics
Code : 62720135
SUMMARY OF DOCTORALTHESIS
Hanoi - 2019
1
INTRODUCTION
Overweight and obesity continue to increase not only in children but also
adults, in both developing and developed countries; has become a global
health problem. In Vietnam, the rate of TCBP children is also increasing
rapidly. The underlying cause of overweight and obesity is an energy
imbalance between calories consumed and calories expended. Increased
intake of high-fat energy-dense foods, reduced physical activity, irrational
eating/living habits, and urbanization... are risk factors for overweight and
obesity. Overweight and obesity in children have long-lasting effects on
health, longevity, psychology and economics, While the treatment of
overweight and obesity is difficult, costly and almost ineffective, this
pathology is preventable, so the prevention of overweight and obesity in
children will contribute to reducing the rate of being overweight and obese in
adults, reducing the risk of non-communicable chronic diseases related to
overweight and obesity and reducing medical costs. To provide further
scientific evidences on proposing solutions to reduce the burden on the health
and society, we conducted research on the topic: “The situation of
overweight, obesity and effectiveness of interventions in treatment among
primary school pupils in Bac Ninh city” with the following objectives:
1. Determining the rate of overweight and obesity in primary schools
pupils in Bac Ninh city.
2. Analysis of risk factors related to overweight, obesity and
accompanying diseases in primary school pupils in Bac Ninh city only.
3. Evaluating the effectiveness of interventions to overweight and
obesity in primary school pupils in Bac Ninh city.
GENERAL INFORMATION
1. The structure of thesis:
This thesis consists of 140 pages, include:
- Introduction: 02 pages
- Chapter 1: overview, 38 pages
- Chapter 2: objects and method, 26 pages
- Chapter 3: results, 33 pages
- Chapter 4: discussion, 38 pages
- Conclusions: 02 pages
- Recommendations: 01 page.
The thesis includes 31 tables, 11 charts, 03 diagram and 299 references
(including in Vietnamese and in English).
2. The new scientific and practical values contributions of the research:
This is the first study conducted in Bac Ninh to determine the rate of
overweight, obesity and risk factors, associated diseases of overweight and
2
obesity among primary school pupils in 2016. Besides, this is the first study
on implementing intervention in Bac Ninh on the combination of
communication and counseling interventions to change knowledge, behavior,
lifestyle and guide daily practice of diet, physical activity for children in
order to improve the status of the children with overweight and obesity.
Moreover, this is the first study conducted in Vietnam on the assessment of
the quality of life of children with overweight and obesity through AUQUEI
image.
This thesis had new conclusions to contribute to overweight and obesity
among primary school pupils, and pointed to the difference of Bac Ninh city,
where is different from other cities in socio-economic growth, leaded to
increase in the proportion of overweight and obesity rapidly (that proportion
was 23.7% in 2015, after 2 years increased to 27.2%); more clarification of
risk factors related to overweight and obesity at this age (in which the most
prominent risk factor was lack of physical inactivity and snacking frequently
OR = 95.9; p <0.001); point out the associated diseases such as dyslipidemia,
hyperglycemia, hypertension (THA), fatty liver, oral disease, respiratory
disease, myopia; the quality of life (CLCS) of children with overweight and
obesity was assessed; combination of daily interventions for schools, families
and pupils, especially the physical activity with specific quantitative
assessments, pre- and post-intervention comparisons, post-intervention results
revealed improvement in the situation of dyslipidemia, hyperglycemia, BMI
decreased, the interventional effective for the children with overweight and
obesity was 7.3% (for obese group only was 19.2%), the research results of the
thesis are very valuable for community interventions and treatment of pediatric
patients with severe overweight and obesity thereafter.
Chapter 1
OVERVIEW
1.1. The concept of overweight and obesity
According to the World Health Organization in 2016, overweight and
obesity are defined as abnormal or excessive fat accumulation in the body
that presents arisk to health.
Overweight and obesity occur when there is an energy imbalance (energy
supply is higher than energy consumption creating a positive balance and
excess energy is converted into fat stored in the organization of the body) for
a long time.
3
1.2. Epidemiology of overweight, obesity in children
1.2.1. Prevalence of overweight and obesity in children in the world
Over the years, the prevalance of overweight and obesity in children has
increased rapidly, the epidemiological trend of overweight and obesity is
changing all over the world, especially high in developed countries. It is not
only common in developed countries, but it is also increasing in developing
countries rapidly, including countries where malnutrition is still common:
More than 40% of North American and Mediterranean children, 38% of
European children, 27% of Western Pacific children, and 22% of Asian
children were overweight or obese. In countries in Asia: The rate of
overweight and obesity increased from 13 million children in 1990 to 18
million in 2010, the highest among 3 continents. Currently, overweight and
obesity in children has become the second priority health problem in
preventing diseases in Asian countries and is considered as one of the
challenges for the nutrition and health sector.
1.2.2. Prevalence of overweight and obesity among children in Vietnam
In our country, along with the socio-economic development, the rate of
overweight and obesity in children is increasing rapidly throughout the
country and become a public health problem. The prevalence and speed of
increase in overweight and obesity varies from region to region, especially in
big cities and central cities: National census in 2010, the rate of overweight
and obesity among children from 5 to 19 years old in the Red River Delta
region was 9.0%, the Central region was 13.4%, the Southeast was 23.3 %;
after 6 years (2002-2008), the proportion of overweight and obesity in
primary school students in Ho Chi Minh city has more than tripled (9.4% and
28.5%), in 2014 it increased to 41.4%; in Hanoi, Hai Phong, and other major
cities, the proportion of children with overweight and obesity increases
rapidly at all ages, the rate of children suffering from overweight and obesity
in Hanoi was 41.7% (2017) and 44,7% (2018); in Hai Phong, the rate was
10.4% (2000), 31.3% (2012) and 50.4% (2014).
Overweight and obesity in children are not only different in urban and
rural areas, but also between men and women, according to the survey of
Institute of Nutrition in 2010, the rate of overweight and obesity in children 5
- 19 years old are different between men and women in all age groups.
In Bac Ninh, up to the time of our study, no author has published research
data on overweight and obesity.
4
1.3. Related factors and accompanying disease with overweight and
obesity
1.3.1. Factors associated with overweight and obesity
1.3.1.1. Rations and eating habits
TCBP is not only related to the high calorie content of a child's diet, but
the imbalance in the composition of nutrients in the diet also had a direct
effect on overweight and obesity. In particular, switching to a diet with high
sugar and low in fiber could have a strong impact on the increase in
overweight, obesity in children and related diseases. The rich energy diet
exceeded the energy consumption which made a positive balance and the
excess is converted into fat stored in the body's organs.
Eating habits are considered as one of the factors that directly affect diets
and affect overweight and obesity of children. In fact, there are many factors
affecting the food intake process such as economic conditions of each family,
children's eating habits, eating habits of each locality and especially the views
on feeding children of grandmother, father and mother. Fast-absorbing foods,
especially high-carb foods, drinking lots of soft drinks, soda leaded to
increase the risk of overweight and obesity in children. The habit of not
eating breakfast is also a risk factor for increasing visceral fat mass and
increasing BMI in children. Previous research by Tran Thi Xuan Ngoc
showed the relationship between overweight, obesity and eating habits
(voracious and junk food).
1.3.1.2. Physical activity
Physical activity is important during adolescence, as it can prevent
overweight and obesity, and reduce the risk of chronic diseases like
cardiovascular disease and type 2 diabetes. Physical activity can reduce
breast cancer risk by up to 40%, especially full exercise during childbearing
years. Besides, physical activity can also improve mental health and
happiness among young people. Sedentary lifestyles, less physical activity
that reduce energy consumption lead to an increase in overweight and
obesity, interventions to increase physical activity and reduce sedentary
behavior are necessary to reduce the risk of excess of weight and obesity in
children.
1.3.1.3. Environment, economy - society and the family
The level of physical activity of a child can depend on environmental
conditions that encourage or discourage from physical activity, such as access
to recreational facilities, and whether the environment encourages walking,
the environment safe for people to exercise... Some changes in the social
environment that are considered to be the cause of sleep deprivation of
5
children are also related to overweight and obesity, such as using computers,
phones, and TVs at night, as well as increasing Stress and anxiety, children
whose family had a TV or computer in the bedroom leaded to go to bed later,
wake up later and sleep time is shorter.
The relationship between socioeconomic status (SES) and overweight and
obesity is especially important when it compared globally. According to a
recent review of 45 studies conducted between 1989 and 2008, 27% of it
found that there was no association between SES and BMI, while 45% of
studies concluded that there was an inverse relationship between SES and
BMI, and 31% of the studies concluded that SES and BMI were not
associated or had an inverse relationship depending on the studied population
group. Thus, high socio-economic conditions in developed countries are no
longer a risk factor for overweight and obesity, instead, the availability of
resources and reasonable diet, sport and adequate medical care lead to lower
rates of overweight and obesity in developed countries.
Families also have a profound effect on behaviors related to overweight
and obesity. A recent review of 58 articles found a consistent relationship
between the diet of parents and the diet of children. Studies also found that
eating habits of parents and siblings also affected children. Family plays an
important role in regulating obesity (BP). Understanding the relationship
between parental status and risk factors for overweight and obesity will help
implement intervention strategies to reduce the prevalence of overweight and
obesity among children in households.
1.3.2. Diseases associated with overweight, obesity
1.3.2.1. Overweight, obesity and non-communicable diseases
Hypertension, stroke and cardiovascular disease increase in obese people (BP). A
number of mechanisms are involved in the development of hypertension, stroke and
cardiovascular disease; pro-inflammatory and thrombotic adipokines may contribute
to an increase in the risk of cardiovascular disease, increasing blood vessel volume,
and larger arterial obstruction and releasing of angiotensinogen from enlarged fat
cells may contribute to hypertension.
1.3.2.2. Overweight, obesity and metabolic endocrine disorders
a. Diabetes: There is a close relationship between BP and diabetes independent of
insulin. The risk of non-insulin dependent diabetes increases continuously as BMI
increases and decreases as weight decreases.
b. Lipid disorders: Obesity is associated with lipid disorders in term of increased
triglyceride, hypercholesterolemia and LDL. When fatty acids are not used, they will
gather in adipose tissue. In these fatty tissues, the fatty acids is conected to form
triglycerides, when too much triglyceride spills into the blood, it will cause blood
cholesterol.
6
c. Metabolic syndrome: BP increases the risk of metabolic syndrome because BP
increases the risk of hypertension, hypertriglyceridemia and increases the risk of
reduced glucose tolerance. BP in children increases the risk of developing
accompanying disease with overweight and obesity and non-communicable
chronic diseases leading to metabolic syndrome in adults.
3.2.3. Overweight, obesity and quality of life
Children with overweight and obesity are often teased by friends, leading to low
self-esteem and loneliness. If these psychological traits are not detected, and treated
in time, it will continue to adulthood and make it difficult for children to integrate
into the community, have rebellious thought and even intend to commit suicide
1.4. The interventions to prevent overweight and obesity in children
Overweight and obesity are the public health problems of many countries
around the world, so the prevention measures should be based on public
health care. There are many causes of overweight and obesity, of which the
inevitable causes require different measures of management and treatment,
such as genetic disorders, diseases related to metabolic disorders. In addition,
the group of preventable causes is the target of the current interventions to
prevent overweight and obesity, such as energy imbalance, lifestyle and
environmental factors..
1.4.1. Interventions that change diet and eating habits
1.4.1.1. Change rations
Previous dietary change interventions were primarily aimed at changing
the proportion of macronutrients (sugars, proteins, fats) in the diets of
overweight and obesity children. One study concluded that calorie reduction
diets are effective for weight loss regardless of the proportion of
macronutrients in that diet. Moreover, low-calorie diets do not help children
feel full, children tend to want to find more food, which makes difficult to
maintain that diet. With similar results coming from a number of other trials,
health policy recommendations for dietary interventions have shifted from
low calorie diets with focus on changing the proportion of macronutrients to
a dietary change method that emphasizes portion size control and energy
density.
1.4.1.2. Change eating habits
Dietary interventions and increased physical activity can only be
effective in maintaining weight or losing weight when combined with
psychological interventions to change behavior. Psychological interventions
are used with the aim of maintaining the behavioral changes achieved by
dietary change interventions and increasing physical activity.
7
Parental involvement is an important part of interventions that change a
child's eating behavior in a positive way, a meta-analysis of 42 studies on
overweight and obesity intervention in children has been demonstrated that
parental involvement in interventions would make management of
overweight and obesity in children more effective.
1.4.2. Interventions to enhance physical activity
Physical activity is considered a protective factor for human health,
performing physical activities is to improve physical, psychological and
mental health for participants. Physical activity can help enhance the
cardiovascular system, promote the perfection and development of brain
functions. Physical activity in children is related to overweight and obesity,
so physical activity is an important measure in weight loss intervention
because it both helps with weight loss and maintains a long-term effective
weight loss, and positively affect the risk of diseases associated with
overweight and obesity.
Chapter 2
OBJECT AND METHODOLOGY
2.1. Objects
- Primary school pupils 6 - 11 years old (grades 1 to 5), living in the Bac
Ninh city.
- Parents or directly nurturing person of pupils in the study area.
For case-control and intervention studies:
- Case-control study
For case group: pupils were identified as overweight and obesity.
For control group: pupils got BMI in normal limits, same age, same
gender, same living area.
- Intervention study:
For the intervention group: pupils who are overweight and obesity in
school where was the highest rate of overweight and obesity.
For the non-intervention group: Overweight and obesity pupils at the
school where got the same rate of overweight and obesity as the school
selected in the intervention group.
Diagnostic criteria:
Overweight and obesity were assessed according to Z - scores of BMI by
age (Z - scores of BMI/A) based on the World Health Organization's growth
standards (WHO 2007).
Weight (kg)
BMI =
(Height)2 (m)
8
Overweight : 1SD
is calculated by the number of years and months).
Exclusion criteria: Children with congenital malformations that affect
the anthropometric index such as deformities of legs, arms, spine, after taking
some drugs such as Corticoid, Deparkin..., precocious puberty, nephrotic
syndrome..., the pupils and pupil's parent disagree with the study.
2.2. Period of study: From 01/2016 to 5/2018.
2.3. Study places: Bac Ninh city.
2.4. Methods
2.4.1. The design of the study
The study was designed into 3 stages:
- Stage 1: Descriptive study (cross-sectional survey)
Cross-sectional survey on the population of primary schools in Bac Ninh city to
determine the merely proportion of overweight and obesity.
- Stage 2: Case-control study
In order to analyze the risk factors and some accompanying diseases of primary
school pupils with.
-Stage 3: Intervention study
The intervention study was conducted according to the pretest posttest design.
2.4.2. Sample size and sample selection
- Sample for descriptive research: The sample size formula for estimating
a population proportion is given by
p(1- p)
n = Z(1-α/2)2
(p.ε)2
where; n: sample size. Z: Reliability (with 95% confidence, Z1-α/2=
1,96). p: The proportion in the previous study (Proportion of overweight,
obesity in primary pupils in Thai Nguyen City in 2012 of Phan Thanh Ngoc
is 18.2%. ε: expected deviation, chose ε = 0,1.
According to the above formula, in order to avoid sampling errors in
community study we took a design effect of 2, we calculated the necessary
sample of 4,316 pupils, taking about 15% to give up, the sample size was
4,968 pupils.
Sampling method: Using method of cluster sampling.
According to regulation of Bac Ninh Department of Education and
9
Training, there are 40 pupils in everage. We needed to sample on 120 classes
for enrollment of 4968 pupils. There were 5 class grades in each school, 4
classes in each grades so that we need to conduct in 6 schools.
We randomized 6 schools (3 schools in the Central, 3 schools at suburban)
including Suoi Hoa; Tien An; Kinh Bac; Vo Cuong 2; Nam Son 2; Van Duong
in the total of 23 primary schools in Bac Ninh City. All pupils in all classes
and class grades of those schools were enrolled.
Sample size for case-controlled study: using sampling method for casecontrol study:
l/{[p1( 1 – p1)] + 1/[p2( 1 – p2)]}
n = Z2α/2
[ln (1– ε )]2
with p1: exposed proportion of risk factors in group of overweight,
obesity pupils. p2: exposed proportion of risk factors in group of non
overweight/ obesity. The study results of Tran Thi Xuan Ngoc showed that
43% of children in control group who exposed with voracious risk factors,
OR= 3.6; p<0,0001; p<0,0001; ε: expected deviation (odd ratio of OR
between population and samples).
According to above formula, the sample size for case group is 101 pupils,
10% of withrawal was added plus.
Sampling method:
+ Case group: Enrolled pupils who was diagnosis of overweight, obesity.
+ Chọn nhóm chứng: Enrolled pupils who had weight/height or BMI in
the normal ranges with the same class grades (age groups), schools, living
areas with that in case group. The rate of case group and control group was
1:2.
With the result of screening examination, investigational team randomized
representative100 children who were overweight, obesity; and 220 children
who were not overweight, obesity by class and gender, living in the same
areas to eveluate risk factors which associated with overweight and obesity.
- Sample size for intervention study: Using formula to identify the
difference in proportion of overweight, obesity between intervention and
control groups
p1(1-p1)+ p2(1-p2)
n = (Z1-α/2 + Z1-β)2
(p1 – p2)2
N: estimated sample size
Chose Z(1-α/2) = 1.96, Z(1-β) = 0.84
p1: Proportion of overweight pre-intervention (38,6)
10
p2: Proportion of overweight post-intervention (13,8)
Estimated sample size for intervention was 45 pupils based on above
formula, adding 20% of withdrawal and round up leading to the sample size
was 55 children for each intervention group and control group.
Sampling method: in two schools with highest proportion of overweight
and obesity, we randomized 55 children who were overweight, obesity for
intervention group in one school (Suoi Hoa primary school) while 55
children who were not overweight, obesity were enrolled in the control group
in the other shool (Kinh Bac primary school).
The post-intervention evaluation was performed with Efficiency index
(CSHQ) as following formula:
P1 - P2
CSHQ (%) = 100 x
P1
With P1: Proportion of overweight pre-intervention,
P2: Proportion of overweight post-intervention
Intervention efectiveness was subtraction between pre-intervention and
post-intervention effetive indicators or operated solutions, real CSHQ of
intervention = CSHQ in case group - CSHQ in control group.
2.5. Indicators, variables in the study
- Research indicators:
Rate of overweight, obesity by age, sex, school, region.
Rate of hypertension, cholesterol, tryglyceride, glucose.
Incidence of metabolic syndrome/fatty liver/dental disease/myopia/
respiratory infection.
- Variables in the study: 168 variables.
2.6. The method of data collection
Data were collected by questionnaire (the questionnaire was developed
with the support of experts from the National Institute of Nutrition and
determined by statistical testing).
Data collected: Age, weight, height, waistline, blood pressure, 24-hour
ration of subjects, physical activity, quality of life, blood biochemistry, liver
ultrasound... concomitant diseases (dental disease/ myopia/ respiratory
infection).
2.7. Intervention model
The research team developed an intervention model for overweight and
obesity students with the support of experts from the National Institute of
11
Nutrition, an intervention model was developed after data collection and
analysis of risk factors for being overweight and obesity, focusing on
prominent risks, the menu used at school, the physical activity program of the
school to develop the menu and the program of physical activity for the
subject intervention. The intervention model is a combination of
communication and counseling interventions to change knowledge,
behaviors, lifestyles and guide daily dietary practices and physical activity
for children improve overweight and obesity situation of children.
Assessing the effectiveness after intervention: a controlled before-andafter comparison
Evaluation over 110 overweight and obese children (55 overweight, obese
pupils were intervened group and 55 uninterventioned group) to compare
between 2 groups during 30 weeks of intervention, intervention groups
maintained monitoring after the next 30 weeks (60 weeks after the
intervention).
Evaluation indicators: Changes in parents 'and pupil's eating practices and
eating habits before and after the intervention; change of diets before and
after the intervention; change level of physical activity before and after the
intervention; change anthropometric index, subclinical criteria before and
after the intervention; the percentage of children with overweight and obesity
back to normal after the intervention; effectiveness of intervention.
2.8. Organization of implementation
Establishing management groups and implementing the project: Including
10 main members, 12 collaborators, assigning tasks to the participants to
implement the project in a scientific, specific, detailed and suitable for
manner, qualifications and competence of each person, according to the
progress and content of the research topic.
Selection of coordinating agencies and advisory agencies: National
Institute of Nutrition, City People's Committee, Department of Education and
Training, Primary schools in Bac Ninh City …
Coordinate with organizations and individuals to make explanations of
science and technology topics at provincial-level, submit them to council of
all levels for approval, and grant funding for implementation.
After Bac Ninh Provincial People's Committee approved the
implementation of the topic, the lead agency set up a team to implement the
topic, including the project leader, secretary, members and officials of the
National Institute of Nutrition to implement the project according to the
registered plan.
12
Based on the work's contents, the project manager has assigned specific
members to perform the contents of each job. Members implement the
regime of inspection, supervision, progress report, contents of work for the
general thesis secretary and report to the topic manager as prescribed.
2.9. Processing and analyzing data
Measures to control errors: Select random samples, the sample size is
large enough to prevent random errors; training thoroughly and accurately for
enumerators, then conduct pilot surveys before official surveys; precision
weighing techniques, information collection tools are tested and had high
accuracy; definitions, standards and criteria to properly classify nutritional
status and clear, choose the right in case group and control group; clear
questionnaire, easy-to-understand language; using the comparative method
before and after the intervention, the method of pairing by age, gender,
location, selecting control groups for comparison to control noise; closely
monitor the entire research process; data are cleaned before inputting data.
Processing and analyzing data: Data is cleaned before being entered into
data; Data were entered using WHO Enthro Plus software (nutritional status),
Nutrervey (diet), Epidata 3.1 (remaining data) and analyzed by SPSS 22.0
with medical statistical methods.
2.10. Ethical aspects: The study was approved for implementation according
to Decision No. 229/QD-DHYHN (January 10, 2014) of Hanoi Medical
University and Decision No. 507/QD-UBND (May 5, 2016) of People's
Committee of Bac Ninh Province.
Chapter 3
RESEARCH RESULTS
3.1. The prevalence of merely overweight and obesity among primary
shool pupils in Bac Ninh City
Table 3.2. Distribution of overweight and obesity of study subjects
Status
n
Tỉ lệ (%)
overweight and obesity
1.349
27.2
overweight
813
16.4
obesity
536
10.8
Non overweight and obesity
3.619
72.8
Total
4.968
100.0
13
The total number of chosen students are 4968, in which 1349 were
overweight and obese (27.2%), 813 students were overweight (16.4%) and
536 students were obese (10.8%)
35
30
25
20
15
10
5
0
32.8
18.4
Suburbs
Ce ntral
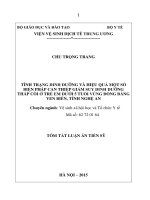
Figure 3.3. Distribution of overweight and obesity by local
The percentage of overweight and obesity in the central area was higher than
the suburbs (32.8% compared to 18.4%), the difference was statistically
significant with p <0.001.
40
33
30
20
10
33.1 32.2 32.5
27.5 27.5
23 21.6
22.4 22.4
21.8
19
Bo
y
0
6 years
7 years
8 years
9 years 10 years 11 years
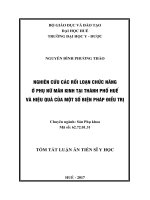
Figure 3.4. Overweight and obesity by age and gender
The percentage of overweight & obese in male student was higher than in
female student (36.4% compared to 18.0%) in all age groups, the difference
was statistically significant with p<0,05.
3.2. Factors realted to overweight and obesity and accompanying
diseases in primary school pupils in Bac Ninh city
Bảng 3.3. The relationship between nutrition value and meal balance and
overweight and obesity
Index
Non overweight
overweight and
NCĐN/VDD
and obesity
obesity (n=110)
(2016)
(n=220)
value
The level value The level
of
of
demand
demand
response
response
14
(%)
Calories (Kcal)**
105
92
1460-2150
17.3
17
13-20%
30.7
26.4
20-30%
52.1
56.6
55-67%
17:31:52
17:26:57
*p<0,01, **p<0,001 T test
The average meal energy in overweight and obesity group was 1657.3
Kcal, higher than the control group 1345.6 Kcal, the difference was
statistically significant with p<0,001.
Table 3.4, 3.5, 3.6: The frequency of using foods that provide high energy
(spring rolls, fatty meat, fried foods, sweet candies ...) in a month in the
group overweight and obesity was higher than in normal group (p <0.05);
children who had a habit of fast eating, overeating, having snacks... had a
higher incidence of overweight and obesity in compared to children without
these habits (the difference was statistically significant p <0.01); children
who had a habit of eating fatty meat, butter, oil / fat... had a higher incidence
of overweight and obesity than children who did not like to eat these foods
(the difference is statistically significant with p <0.001) .
Table 3.7: In the past weeks, the pupils who performed athletics activities
such as jogging, cycling, rope shipping, swimming, playing hide & seek,
gymnastics showed lower percentage of having overweight and obesity in
compared to the pupils who didn’t performed any activity. (the difference was
statistically significant with p <0.01).
Table 38. The relationship between the level of physical activity at
school in the past week and overweight and obesity
Non
overweigh
overweigh
t and
OR
χ2,
t and
obesity
(95%CI)
p
Activity
obesity
(n=110)
(n=220)
n
%
n
%
86 78.2 24 10.9
Hour No/little activity
29.3
146.3
Fitness Well activity
[15.7-54.4] <0.001
24 21.8 196 89.1
Sit
86 78.2 33 15.0
Rest
20.3
124.2
18
time
[11.3-36.4] < 0.001
Running/ playing 24 21.8
85.0
7
Break Sit
78 70.9 26
11.8
20.3
115.9
time
[11.3-36.4] <0.001
Running/ playing 32 29.1 19 88.2
Total protein (gr)**
Total Lipids (gr)**
Glucid (gr)*
Balance P:L:G
1657.3
71.6
56.5
215.9
(%)
1345.
6
57.3
39.6
190.8
15
Activity
overweigh
t and
obesity
(n=110)
n
%
Non
overweigh
t and
obesity
(n=220)
n
%
4
OR
(95%CI)
χ2,
p
Active Little/light
88 80.0 61 27.7
10.4
78.8
activity
in 7
[6.0-18.1] <0.001
days
Regular activity
22 20.0 159 72.3
During the week and activity time, the pupils who participated in little
activity or not participate had 29.3 times higher risk of overweight and
obesity compared to active pupils (p<0.001); during 7 days the pupils who
participated in little activity or not participate had 10.4 times higher risk of
having overweight and obesity compared to pupils who participate in
activities frequently (p<0,001).
Table 3.9: Static activities over the past 7 days that took place ≥ 60
minutes/day, such as time spent using computers/using the web, playing
video games, watching TV, etc. had a higher rate of overweight and obesity
than normal children, this difference was statistically significant with p
<0.001.
Table 3.10: Children that have family members (siblings, parents,
grandparents) with overweight and obesity has 9.2 times higher risk of
having overweight and obesity than those who doesn’t have family members
with overweight and obesity. The difference was statistically significant with
p<0,001.
Table 3.12: In family whose mother has average income higher than
4.000.000 VND, are more likely to have overweight and obesity children
compared to mother with income lower than 4.000.000 VND (87.3%
compared to 57.7%), the difference was statistical significal with p<0.001;
Similarly, family with average spending for food for each person/month
higher than 1.000.000 VND are more likely to have children suffer from
overweight and obesity, compared to parents who has average spending for
food for each person/month lower than 1.000.000 VND, the difference was
statistical significal with p<0.001.
Table 3.16. Multivariate analysis of logistics model on risk factors for
overweight and obesity
95% C.I.
Index
OR Upper Lower
p
limit
limit
16
No/little activity
1.9
6.9
2.1
22.3
<0.01
Letting child to have
<0.01
sweets as prefer
1.7
5.5
1.8
16.5
Having snacks
2.0
7.1
2.2
23.3
<0.01
Using web for more than
<0.05
60 minute/day
1.5
4.3
1.1
16.9
Constant
-10.7
0.0001
When applying univariate factors related to TCBP into the multivariate
logistics model, using the Forward method: Wald shows that the child who
have no/little physical activity; or eatting snacks; using Web from 60
minutes/day; eatting sweets as prefer were the risk factors for TCBP (p
<0.05). In particular, no/less physical activity and eating snacks were risk
factors that have a strong impact on overweight of children.
Figure 3.5: Students in the overweight and Obesity group had a 3.6 times
higher risk of fasting hyperglycemia; Cholesterol 2.9 times higher;
Triglyceride increase 1.9 times higher; increase LDL - C higher than 7.4
times; reduction of HDL - C was 2 times higher than that of the group
without overweight and obesity and the difference was statistically significant
with p <0.05.
Figure 3.6: Students in overweight and obesity group were 12 times more
likely to have hypertension. Fatty liver 64.4 times higher than in those who
doesn’t have overweight and obesity. Statistical significance with p <0.05.
Students in the group overweight and obesity were 1.4 times more likely to
have metabolic syndrome than those who doesn’t have overweight and
obesity. But this difference was not statistically significant with p> 0.05.
Figure 3.7: Students in overweight and obesity group had a higher risk of
myopia 8.5 times; dental diseases is 3.4 times higher; respiratory
inflammation was 5.3 times higher than the group doesn’t have overweight
and obesity, this difference was statistically significant with p <0.001.
2.1
2.04
2.05
2
1.95
1.9
1.9
1.85
1.8
TCBP
Non TCBP
17
O v e r a ll a v e r a g e q u a lity o f life
Figure 3.8: The average quality of life score of group has overweight and
obesity (1.9 ± 0.33) was lower than the group of non TCBP (1.9 ± 0.33), this
difference was statistically significant with p <0.001.
4.000
3.000
2.000
1.000
9.000
f(x) = - 0.02x + 2.28
R² = 0.05
14.000 19.000 24.000
29.000
34.000
BMI
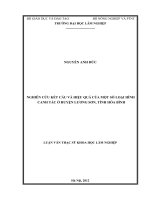
Figure 3.9. Correlation between quality of life and BMI
The average quality of life had a linear inverse correlation with the BMI
(r = -0.214; p<0.001).
3.3. The effectiveness of interventions
Table 3.20: In the intervention group (CT), the proportion of mothers who
practice storing energy-rich foods in refrigerators like storing pastries (47.3%
to 29.1%) candies (38.2 % to 5.5%) fresh water (38.2% to 21.8%) had a
marked decrease compared to before the intervention. The reserve of ripe fruit
increased from before intervention from 89.1% to 92.7%.
Table 3.21: There has been a change in eating habits after intervention
such as the rate of children eating fast eating a lot and having snacks when
watching TV after intervention was always lower than before the
intervention. In contrast. these habits tended to increase or decrease slightly
in the non-intervention group.
18
Bảng 3.22. The change of diet after the intervention
intervention
unintervention
NCĐN/VD
group (n=55)
group (n=55)
Index
D
(2016)
After Before
After
Before
Calories (Kcal)**
1765.7 1670.5
1707.6
1837.9
1460 - 2150
Protein (g)
83.9
71.4
75.2
81.4
Protein %
19
17
18
18
13 - 20%
Lipid (g)
61.7
47.1
51.4
56.7
Total Lipid %
31
25
27
28
20 - 30%
Glucid (g)
219.0
241.3
236.1
252.1
Glucid %
50
58
55
54
50 - 67%
Animal protein / Total
73
66
63
56
≥ 50%
protein
Plant lipid /Total lipids
17
30
21
34
30%
Balance P:L:G
19:31:50 17:25:58 18:27:55 18:28:54
After the intervention, the diet of the intervention group decreased (from
1765.7 kcal to 1670.5 kcal), the intervention group ensured the balance of the
diet was the animal protein ratio (66%). Plant lipid (30%), the balance of the ratio
P:L:G was 17: 25: 58 reached the recommendation.
Table 3.23. Change endurance, strength of intervention group after 60
weeks
intervention group (n=55)
Test of physic/al fitness
Before
After 1
After 2
(X ± SD)
(X ± SD)
(X ± SD)
Running time 50m (seconds)
18.27 ± 1.80
17.00 ± 1.77
15.82± 1.39
Pulse rate of rotary artery before
97.44 ±6.70
94.80±6.96
95.05 ± 7.71
running 50m (times/ minute)
Pulse rate of rotary artery after
116.45±5.60 106.95±6.7
106.18 ± 7.67
running 50m (times/ minute)
Long jump (cm)
91.27 ± 6.58
97.04 ± 6.96
97.58± 6.79
Sit down - stand up (number/ 30
21.15 ± 3.76
23.76 ± 2.86
25.96±3.49
seconds)
Jump rope (number/ minute)
43.3 ± 16
56.3±13.7
57.1±14.3
Before the intervention, the number of children who reached the physical
activity requirements (jumping rope ≥ 60 times/minute) of the intervention
group was 8 (accounting for 14.5%). The intervention was 9 (accounting for
16.4%), after 30 weeks of intervention. The control group did not change. the
intervention group increased to 17 satisfactory children (30.9%), this result was
19
maintained and after 60 weeks of intervention the number of children increased
to 24 satisfactory children (43.6%).
Table 3.28: After 30 weeks of intervention, most of the clinical indicators
that exceeded the normal limit of the children in the intervention group
mostly decreased, from 25.5% of children with overweight and obesity
normally had cholesterol exceeded now decrease to 20%; HDL decrease from
20% to 16.4%; Triglycerid from 26.8% to 25.5%; Glucose decrease from
9.1% to 7.3%; Fatty liver decreased from 23.6% to 21.8%; LDL was not
changed. the difference was statistically significant (p <0.05).
Table 3.29. Change rate of overweight, obesity after intervention
intervention unintervention
Status
Time
group n (%) group n (%)
Before
3 (5.5%)
4 (7.3%)
overweight
After
9 (16.4%)
2 (3.6%)
Before
52 (94.5%)
51 (92.7%)
obesity
After
42 (76.4%)
53 (96.4%)
Before
0 (0)
0 (0)
overweight and obesity
(return normal)
After
4 (7.3%)
0 (0%)
Before
23.7 ± 2.7
23.1 ± 2.2
BMI index
After **
22.1 ± 2.7
23.7 ± 2.4
**Difference before- after intervention t- test p<0.001
After 30 weeks, in the intervention group of children from overweight and
obesity group, the number of obesity turned normal were 4 children, from
obesity to overweight were 6 children. In contrast, in the control group, no
children returned to normal, 02 children from overweight turned into obesity.
Table 3.31. The real effect of interventions with overweight and obesity
Before
After
CSHQ
Status
intervention
intervention
(%)
(n)
(n)
Obesity
intervention group
52 (94.5%)
42 (76.4%)
19.2
unintervention group
51 (92.7%
53 (96.4%)
-4.2
General CSHQ
23.4
overweight and obesity
intervention group
55 (100%)
51 (92.7%)
7.3
unintervention group
55 (100%)
55 (100%)
0
General CSHQ
7.3
In the obese group, the effective index of the intervention group was 19.2%
and the control group was -4.2%, the real effective index of the intervention
20
solution was 23.4%; for children with overweight and obesity, the
effectiveness index in the intervention group was 7.3% and in the control
group was 0%, the effective index of intervention solutions was 7.3%.
Chapter 4
DISCUSSION
4.1. Determine the prevalence of overweight and obesity in primary
schools in Bac Ninh City
The study found that 1.349/4.968 overweight and obese pupils accounted
for 27.2% (of which the overweight rate was 16.4% and obesity was 10.8%).
Our results are quite similar to the results of some other studies. 27% of
children in the Western Pacific were overweight and obesity; in China. The
rate of overweight and obesity of 1.544 children 6-17 years old was 24%
(overweight was 16%. obesity was 8%); our research results was higher than
those of Le Thi Kim Qui et al in 2010 which showed the overweight and
obesity rate of primary school pupils in Ho Chi Minh City was 20.8%; Tran
Thi Xuan Ngoc studied on 8.561 children aged 6-14 in Hanoi in 2012. the
rate of overweight and obesity was 10.7%. However. our results were quite
low in compare to big cities and central cities: According to the survey of
Institute of Nutrition in 2009-2010. The rate of overweight and obesity in
children from 5 to 19 age of years in the city under the central government
was 31.9%.
Our research results were similar to other authors. that was the rate of
overweight and obesity in the downtown area is significantly higher than in
the suburbs (32.76% compared to 18.38%). Male were higher than girls
among all ages (36.4% and 18.0%). The difference was statistically
significant with p <0.05.
4.2. Risk factors related to overweight and obesity in primary school
pupils in Bac Ninh city
According to our results. the average daily energy of overweight and
obesity group was higher than that of control group (1657.33 and 1345.65
Kcal); The average content of Protein. Lipid. Glucid was higher than the
control group. 71.64 and 57.28gr; 56.51 and 39.61gr 215.91 and 190.85gr (p
<0.001) respectively; The proportion of energy-generating components in the
diet of overweight and obese group (P: L: G) was 17:31:52. it was
disproportionate in comparision with the control group: 17: 26: 57). Our
research results were similar with Phan Thi Bich Ngoc and Tran Thi Xuan
Ngoc and some other authors.
Voracious children with habits of fast eating, eating a lot. snacking ... had
a higher rate of overweight and obesity than children without these habits
21
(OR greater than 1. p <0.01). In particular. children with voracious habits
had the highest risk of being overweight and obesity and got 29.1 times
higher than children without that habit (OR = 29.1; p <0.001) (table 3.6). Our
research results were similar to those of some national and international
authors such as Tran Thi Phuc Nguyet; Tran Thi Xuan Ngoc. for overweight
and obesity risk of voracious was 3.6 times and nosh was 2.3 times higher
than the control group; A study in Hong Kong found that the risk of
overweight and obesity in voracious children from childhood was 2.2 times
(p <0.01).
In our study. children in family where got overweight and obese person
(grandparents. parents. siblings) were over 9.2 times risk for overweight and
obese than children who lived in family without overweight and obese people
(p <0.001). Comparision to the results of Tran Thi Xuan Ngoc. if the child is
overweight. obese. the risk was 2.9 times. if the child had siblings with
overweight or obese. the risk was 3.9 times and especially if the mother was
overweight and obese. the risk of the child being overweight and obese up to
24.8 times; Hoang Thi Dieu and colleagues found the rate of overweight.
obesity or obesity in children whose parents with overweight. Obesity were
1.87 and 2.59 times higher than children with normal parents.
When assessing the risk factors as household economic conditions related
to overweight and obesity. We investigated household daily appliances. So
children who were brought up in economic conditions had a higher rate of
overweight and obesity than the control group. Specific as: air-conditioner
(OR = 21.7; p <0.001); washing machine (OR = 7; p <0.001); cars (OR = 3; p
<0.001); computers (OR = 7.1; p <0.001). Similar to the research results of
Tran Thi Xuan Ngoc. Families with air-conditioners 1.8 times higher and a
family with a washing machine 1.7 times higher than a family without an air
conditioner and a washing machine.
Our study on the relationship between income and expenditure of
households and overweight and obesity of pupils. Children who lived in
household with the average expenditure on food for 1 person/1 month over
1.000.000 VND. Had risk for overweight and obese 1.8 times higher than
children who lived in households with average expenditure on food of 1
person/month <1.000.000 VND (p <0.001). Our research results are similar
to those of other authors.
When input univariate factors related to overweight and obesity into the
logistic multivariate model. using the Forward method: Wald showed that
children who had the habit of doing no/little physical activity; eatting snack;
using tWeb for more than 60 minutes/day; letting children to eat sweets as
prefer were risk factors for being overweight and obese (p <0.05). In
22
particular. No/less physical activity is the risk factor with the strongest impact
on overweight and obesity of children (OR = 95.9; p <0.001) (table 3.17).
Our research results were similar to those of some authors. Cao Thi Yen
Thanh found that children who did not participate in physical activities were
at risk of overweight. Obesity by 1.88 times. A study of 3.698 children in the
United States showed that obese children were less active than overweight
children and overweight children were less active than normal weight
children. diet and TV time in children from families with single-parent
showed higher evidence of BMI. in which girls from single families are more
obese.
In results of our study. pupils in overweight and obese groups were 3.6
times more likely to suffer from fasting hyperglycemia; Cholesterol 2.9 times
higher; increased triglycerides 1.9 times higher; increase LDL - C higher than
7.4 times; reduce HDL more 2 times; the risk of hypertension was 12 times
higher; fatty liver 64.4 times higher; myopia was 8.5 times higher; dental
disease is 3.4 times higher; respiratory infection 5.3 times higher than the
group without overweight and obesity; this difference is statistically
significant with p <0.05 (Table 3.18. 3.19. 3.20). Our research results were
similar to those of some authors. according to Tran Quoc Cuong et al when
studyed 442 obese ptimary pupils in District 10. Ho Chi Minh City. it showed
an increase in total cholesterol. triglycerides. LDL-C and decreased HDL-C
by 22.6%; 22.6%; 22.2% and 5.9% respectively; in research of B.S. Wee et
al.. among 209 overweight and obese children. more than 80% of overweight
and obese children had waist circumference ≥ 90th. 19.7% of HDL – C were
low; 12.5% increase in triglycerides; 6.3% with hypertension; according to
Vu Thi Dinh. When studyed the oral disease of primary school pupils in
Hanoi. tooth decay rate was 59.78%; Vu Thi Hoang Lan. Revealed that the
rate of myopia in pupils was 50%.
Overweight and obesity were not only related to disease but also to the
quality of life of the child. Our research results showed that overweight and
obese pupils had lower overall quality of life than control group (p <0.05).
this partly showed the influence of overweight. Obesity to the quality of life
of the child. In comparision with the study on the quality of life of children
aged 6 - 11 years old through psychological approach of Ngo Thanh Hue and
Le Thi Mai Lien (2013). It showed that the average score of the entire
AUQUEI questionnaire according to the child's rating was equal to 2.07
points. Therefore, we need to care and support them more. especially
overweight and obese children on these factors so that they can integrate with
friends, family, school and society. That also helps improve the quality of the
children's life.
23
4.3. Evaluate the effectiveness of some overweight and obesity
interventions among primary pupils in Bac Ninh City
According to our research. the proportion of mothers in the intervention
group who practice on rich food storage significantly decreased compared to
before the intervention such as pastry storage (47.3% to 29.1). %), candy
(38.2% to 5.5%), soft drink (38.2% to 21.8%); our results were quite similar
to Veuglers P.J researched in the US. It showed that after intervention
children changed their habit of overeating. Avoiding energy-rich foods.
Similar to our research results. Tran Thi Phuc Nguyet pointed out that the
dietary energy of the intervention group decreased (from 1702 kcal to 1596
kcal). Lipid consumption in the intervention group decreased. Tran Thi Xuan
Ngoc showed that diet energy decreased, lipid decreased; ensure the balance
of the part of dietary.
Our research results are similar to those of Tran Thi Phuc Nguyet. When
evaluating changes in strength, strength and endurance. It showed that the
rotary artery index of intervention children is less changed after running
compared to the non-intervention group. The number of times for standing up
and down increased (11 times increased to 18.4 times). Tran Thi Xuan Ngoc
assessed the change in strength. strength and endurance of overweight and
obese children by physical activities such as skipping, long jump, short
running. It showed that before intervention primary school pupils met the
requirement of jumping rope per minute was 34.7%. But after intervention
increased to 39.7%. Another study had shown that after intervention.
Children increase muscle strength and stamina in overweight and obese
children.
We evaluated the effectiveness index after intervention for overweight and
obese children. the effectiveness index was 7.3% (for obese children is
19.2%). Our research results were similar to those of author Tran Thi Phuc
Nguyet. The actual effectiveness of the intervention showed that the level of
overweight. Mild obesity reached 41.4% and the level of overweight and
obesity mild and severe obesity reached 11.1%. Tran Thi Xuan Ngoc's study
showed that after 9 months of intervention. The rate of overweight and
obesity decreased (19.0% to 13.7%). Interventions by educational
communication combining family and school to prevent overweight and
obesity among Hue primary school pupils by Phan Thi Bich Ngoc et al
showed results of weight. Obesity decreased from 8% to 6.4% at the
intervention school. A study of 2.425 primary school pupils (including 1.029
children in the intervention school and 1.396 children in the control school)