Is utility-based quality of life associated with overweight in children? Evidence from the UK WAVES randomised controlled study
Bạn đang xem bản rút gọn của tài liệu. Xem và tải ngay bản đầy đủ của tài liệu tại đây (570.84 KB, 10 trang )
Frew et al. BMC Pediatrics (2015) 15:211
DOI 10.1186/s12887-015-0526-1
RESEARCH ARTICLE
Open Access
Is utility-based quality of life associated
with overweight in children? Evidence from
the UK WAVES randomised controlled
study
Emma J. Frew1*, Miranda Pallan2, Emma Lancashire2, Karla Hemming2, Peymane Adab2 and on behalf of the
WAVES Study co-investigators
Abstract
Background: Quality-Adjusted Life Years (QALYs) are often used to make judgements about the relative costeffectiveness of competing interventions and require an understanding of the relationship between health and
health-related quality of life (HRQOL) when measured in utility terms. There is a dearth of information in the
literature concerning how childhood overweight is associated with quality of life when this is measured using
utilities. This study explores how weight is associated with utility-based HRQOL in 5–6 year olds and examines the
psychometric properties of a newly developed pediatric utility measure – the CHU9D instrument.
Methods: Weight and HRQOL were examined using data collected from 1334 children recruited within a UK
randomised controlled trial (WAVES) (ISRCTN97000586). Utility-based HRQOL was measured using the CHU9D,
and general HRQOL measured using the PedsQL instrument. The association between weight and HRQOL was
examined through a series of descriptive and multivariate analysis. The construct validity of the CHU9D was
further assessed in relation to weight status, in direct comparison to the PedsQL instrument.
Results: The HRQOL of children who were either overweight or obese was not statistically different from children who
were healthy or underweight. This result was the same for when HRQOL was measured in utility terms using the CHU9D
instrument, and in general terms using the PedsQL instrument. Furthermore, the results support the construct validity of the
newly developed CHU9D as the PedsQL total HRQOL scores corresponded well with the individual CHU9D dimensions.
Conclusion: At age 5–6 years, the inverse association between overweight and HRQOL is not being captured by either the
utility-based CHU9D instrument nor the PedsQL instrument. This result has implications for how the cost-effectiveness of
childhood obesity interventions is measured in children aged 5–6 years.
Trial registration: ISRCTN Registry: ISRCTN97000586 19th May 2010.
Keywords: Health-related quality of life, Utility, CHU9D, BMI, Children, UK
Background
Childhood obesity is a growing problem worldwide [1–3].
The direct annual costs of obesity and associated health
consequences across the EU is about 7 % of national
health budgets [4] and within the UK National Health
Service (NHS), is approximately £4.2 billion, with an estimated cost of £16 billion to the wider economy [5].
* Correspondence:
1
Health Economics Unit, University of Birmingham, Birmingham B15 2TT, UK
Full list of author information is available at the end of the article
A range of interventions have been developed to
prevent and manage childhood obesity [6]. However,
there is an absence of evidence on the costeffectiveness of such interventions. Whilst there is
much evidence to suggest that weight status has an
effect on adult health-related quality of life (HRQOL)
[7–11], and many studies have reported similar associations in adolescents [12–14], these studies report
HRQOL in general terms rather than in the more
© 2015 Frew et al. Open Access This article is distributed under the terms of the Creative Commons Attribution 4.0
International License ( which permits unrestricted use, distribution, and
reproduction in any medium, provided you give appropriate credit to the original author(s) and the source, provide a link to
the Creative Commons license, and indicate if changes were made. The Creative Commons Public Domain Dedication waiver
( applies to the data made available in this article, unless otherwise stated.
Frew et al. BMC Pediatrics (2015) 15:211
specific utility terms required for an economic analysis. In the UK, for decision making bodies such as
the National Institute for Health and Care Excellence
(NICE) it is recommended that HRQOL is measured
in utility terms to facilitate the construction of
Quality-Adjusted Life Years (QALYs). QALYs are then
used as the unit of assessment for comparing the
cost-effectiveness of alternative interventions [15] and
are now used to inform resource allocation decisions
worldwide [16]. Conventional practice within economic evaluations is to measure HRQOL on a cardinal 0–1 utility scale with death (0) and full health
(1) denoting either end of the scale [17]. Very few
studies have looked at the impact of childhood overweight/obesity on HRQOL when it is measured in
utility terms [18] yet this information is vital for the
construction of QALYs. This study directly addresses
this evidence gap.
Assessment of health status in children differs from
adults and requires a different conceptual approach
due to rapid rates of development, dependency on
parents/caregivers and differences in disease epidemiology [19]. Utility-based HRQOL in children therefore
needs to be measured using an instrument specifically
designed for children. The CHU9D is a recently developed generic HRQOL measure designed to produce
utility information. Originally tested for 7–11 year
olds [20, 21], it has more recently demonstrated good
construct validity in adolescents aged 11–17 years
[22]. Although there is emerging evidence regarding
the psychometric properties of the CHU9D instrument
[22, 23], more evidence is required with respect to its
validity for use in different age groups and country
settings. Different terms are used in the literature to
describe validity, and in this context, discriminant
validity refers to the degree with which the instrument
discriminates between groups with known differences,
and convergent validity refers to the degree to which two
theoretically related measures of construct are actually
related. Both are subtypes of construct validity [24].
This paper explored the relationship between weight
status and utility-based HRQOL (measured on a 0–1
scale reflecting full health and death) in children aged
5–6 years. Also it examined the construct validity of
the CHU9D instrument by reporting specifically on
the discriminant and convergent validity. To facilitate
this assessment, the CHU9D was directly compared to
the PedsQL instrument [25], a widely used, validated
generic HRQOL measure in children.
Methods
The WAVES study is a UK-based cluster-randomised
controlled trial assessing clinical and cost-effectiveness
of an obesity prevention intervention targeting
Page 2 of 10
children, funded by the UK National Institute for
Health Research (ISRCTN97000586; Date of registration: 19/5/2010) from 2010 to 2015. Fifty-four schools
(recruited from a random sample of 200) participated
in the study. The study had full ethics approval and was
conducted in accordance with the World Medical
Association’s Declaration of Helsinki (National
Research Ethics Service Committee, West Midlands,
The Black Country No. 10/H1202/69). The random
sample was weighted to achieve sufficient representation (to enable sub group analysis) from the two most
prevalent ethnic minority groups in the West Midlands,
UK: South Asian (Bangladeshi, Indian and Pakistani)
and Black (African and Caribbean). All children in
school year 1 (aged 5–6) from participating schools
were invited to take part. Written parental consent was
obtained for each study participant through a signed
consent form and verbal assent from the children at the
point of measurement. Parental consent was obtained
for 1470 children (60 % of those eligible), and 1401
children (95 % of those consented/57 % of those eligible) were available for baseline measurements. For
practical reasons the schools were split into two groups,
half the schools had baseline measurements taken in
2011 and the other half in 2012. Data on participants’
date of birth, sex and postcode were obtained from
school records. Ethnicity data were collected through a
parent completed questionnaire, or school records
when this was not available. Small area deprivation was
used as a proxy for socioeconomic status. Deprivation
was assessed using the index of multiple deprivation
(IMD) [26]. The IMD score for the residential area of
each child was identified based on their postcode using
an online facility [27]. These scores were then allocated
to the appropriate IMD quintile; those in the first quintile, living in an area classified by the IMD as one of the
20 % most deprived in England and those in the 5th in
an area classified as one of the 20 % least deprived.
Measurement of weight status
For all participants, height and weight measures were
taken at school by trained researchers using standardised
instruments and procedures. Height was measured to the
nearest 0.1 cm using a Leicester height measure. Weight
was measured in light clothing without shoes to the nearest 0.1 kg using a Tanita SC-331 S body composition
analyser. BMI was calculated by dividing weight (in kilograms) by height (in metres) squared (kg/m2) and used to
categorise the children into underweight, healthy weight,
overweight and obese groups. The 2nd, 85th and 95th
centiles of the UK 1990 Growth reference charts for BMI
[28] were used to define the four weight categories, in line
with standard UK definitions [29].
Frew et al. BMC Pediatrics (2015) 15:211
HRQOL measures
As the focus of this study was to explore the association
between weight status and HRQOL when measured in utility terms, two instruments were selected for the measurement of HRQOL. Both are generic instruments and thus are
designed to measure a wider notion of HRQOL and are not
specific to any one disease or condition. The CHU9D is a
preference-based utility instrument designed exclusively for
use in children and previous research has shown this instrument is the most appropriate choice in this age group [30].
As a utility-based instrument, it is designed to produce a
HRQOL score that is preference-based and set between the
values of 0 (death) and 1 (full health), however like many
preference-based utility instruments, it does produce scores
that are deemed to be ‘worse than death’ and therefore have
values of less than 0. The PedsQL was chosen as a ‘gold
standard’ comparator as this is a widely used HRQOL
instrument validated for use in this age group and was the
instrument of choice for the WAVES trial from which the
data was generated. Although this instrument is non-utility
based would be expected to generate HRQOL values which
move in the same direction as the CHU9D utility values.
CHU9D
The CHU9D instrument contains 9 dimensions: school
work/homework; tired; sleep; worried; sad; annoyed; daily
routine; ability to join in activities; and pain, and every
dimension contains 5 levels indicating the severity of the
dimension. Each of the possible 1,953,125 unique health
states are assigned a health utility value ranging from 0.33 to
1 based on an algorithm that reflects the preference weight
attached to each dimension [31] .
PedsQL
The PedsQL is a 23-item instrument including four domains: physical (8 items), emotional (5 items), social (5
items), and school (5 items) functioning [25, 32]. For
this study we used the child self-report PedsQL version
designed for use in 5–7 year olds. Emerging from the
instrument is a score (transformed on to a 0–100 scale)
for each type of functioning, with higher scores indicating better quality of life. Each item has three response
options: not at all; sometimes; a lot; which in the scoring process are assigned values of 100; 50; 0, respectively. Provided data are available for at least half of the
relevant items, the mean score for each of the four domains is then calculated by summing the values for the
relevant items and dividing by the number of items answered. This is repeated including all items for the total
score. The PedsQL instrument has good reliability and
validity in both sick and healthy populations [32–35].
Both the CHU9D and the PedsQL were administered
at the same time point by researchers on a one-to-one
basis. The items and possible responses were read out
Page 3 of 10
and to help the children understand how to answer, for
the PedsQL, a visual prompt (of a face ranging from
smiley to sad associated with each response option) was
provided as recommended by the developers of the instrument for administration to young children.
Statistical analysis
In the absence of a gold standard for the measurement of utility-based HRQOL in young children, and
with no prior knowledge of how weight status affects
utility-based HRQOL in children, to measure the construct validity of the CHU9D, we looked at the relationship between CHU9D and PedsQL in relation to
weight status. This method allowed us to explore two
subtypes of construct validity: discriminant and convergent validity. We explored discriminant validity by
determining if the CHU9D instrument was able to
discriminate between children within different weight
groups, and the convergent validity by assessing how
the CHU9D correlated with the PedsQL measure.
To explore the relationship between HRQOL and sample characteristics we report mean (and SD) CHU9D and
PedsQL scores by weight status category, gender, ethnic
group and deprivation quintile. Differences in HRQOL
scores between groups were assessed using either the
Kruskal-Wallis test, or the non-parametric test for trend.
To examine the construct validity of the CHU9D, we split
the sample according to the median PedsQL total score
and examined separately the mean CHU9D utility value
for children who scored on or above this median score,
and those who scored below it. This difference was then
compared using the one-way ANOVA test. Next, we
looked at the distribution of response to each of the
CHU9D dimensions by weight status category to assess if
there were any significant differences in response. We
hypothesised that children in the overweight and obese
category would report more problems in each dimension
compared to children in the healthy and underweight
category. We assessed the significance of differences in response using the chi-squared test. To determine how well
the PedsQL scores correspond with the CHU9D dimensions we estimated the mean PedsQL total score for each
level of CHU9D response with the expectation that with
increasing severity on each CHU9D dimension, the mean
PedsQL total score would be lower. A scatter plot (along
with fitted regression line and 95 % CIs) for the CHU9D
utility values and the total PedsQL scores was used to
visualise the correlation between the instruments, and the
correlation coefficient was calculated using the Spearman’s
rho statistic. To explore the correlation further we looked
at the relationship between theoretically similar dimensions within both instruments. Our prior expectation was
that the following dimensions would be correlated:
Frew et al. BMC Pediatrics (2015) 15:211
Page 4 of 10
Table 1 Sample Characteristics
PedsQL Instrument
CHU9D instrument
Characteristics
Physical functioning
Tired/Able to join in activities/
Daily routine/Pain/Sleep
Gender: n (%) (n = 1344)
Emotional functioning
Sad/Annoyed/Worried
Social functioning
Able to join in activities
School functioning
School work/home work
Finally, to compare the CHU9D utility values between
the weight groups we used a linear mixed regression
model (with random effect for school), adjusted for
potential confounders (age, gender, ethnicity and
deprivation quintile). All analyses were undertaken in
2014, using Stata version 13.
Results
Full data (including PedsQL total score, CHU9D utility
value, and weight status group) were available for 1344
children and are presented in Table 1. The proportion of
children in the study sample who were either obese or
overweight (21.7 %) is similar to the most comparable
national data available [36] in which 22.6 % of children
measured in their Reception Year during the 2011/12
school year were classified as overweight or obese.
Discriminant validity
Using the known-groups method, the CHU9D (but not
the PedsQL) differentiated HRQOL in children of different ethnic origin (p =0.028) with White British children
having the highest mean utility score (Table 2). There
was a statistically significant trend of decreasing HRQOL
by increasing level of deprivation which was identified
by both instruments (P < 0.05). When children were
categorised into two groups according to their weight
status, neither instrument differentiated between the two
groups.
To explore the discriminant validity of the CHU9D instrument, the mean and standard deviations for the
CHU9D utility values were estimated for children who
had a score either above, or below, the median PedsQL
total score (71.73) for the sample. The mean utility
scores were 0.87 (SD 0.109) and 0.76 (SD 0.143) respectively (p < 0.001).
Table 3 shows the distribution of the CHU9D dimensions by weight status category. Overall, the majority of
children had no or few problems for all dimensions, irrespective of weight status. There were no underlying
differences in the distribution of response to any of the
CHU9D dimensions between children in the different
weight categories.
Table 4 shows how the mean PedsQL scores corresponded with the options for each of the CHU9D dimensions. The mean PedsQL total scores decrease
Male
695 (51.7)
Female
649 (48.3)
Age: mean (SD) (n = 1344)
6.3 (0.31)
Ethnic origin: n (%) (n = 1328)
White British
603 (45.4)
South Asian
403 (30.3)
African Caribbean
107 (8.1)
Other
215 (16.2)
Deprivation quintile: n (%) (n = 1324)
1 Most deprived
738 (55.8)
2
239 (18.1)
3
146 (11.0)
4
113 (8.5)
5 Least deprived
88 (6.6)
Weight: n (%) (n = 1344)
Underweight
40 (3.0)
Healthy weight
1012 (75.3)
Overweight
116 (8.6)
Obese
176 (13.1)
CHU9D mean score (SD) (n = 1344)
0.825 (0.14)
PedsQL mean score (SD):
PedsQL Physical functioning (n = 1344)
74.03 (17.56)
PedsQL Emotional functioning (n = 1344)
72.32 (22.74)
PedsQL Social functioning (n = 1344)
68.11 (22.23)
PedsQL School functioning (n = 1344)
67.15 (21.89)
PedsQL Psychosocial functioning (n = 1344)
68.93 (18.13)
PedsQL Total scale score (n = 1344)
70.44 (16.04)
linearly with increasing severity on each of the CHU9D
dimensions.
Convergent validity
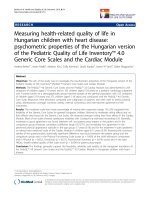
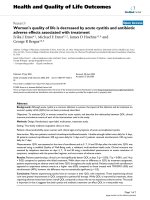
Figure 1 shows the relationship between the CHU9D
utility values and the PedsQL total scores. Although
there is a moderate association between the instruments
with higher CHU9D utility values corresponding with
higher PedsQL total scores, there are some anomalies.
For example, one child reported a CHU9D utility of
0.32, yet had a PedsQL total score of 76.09, and another
child reported a CHU9D utility score of 0.9, yet had a
PedsQL total score of 13.04.
Overall, the correlation between the CHU9D utility
values and PedsQL total scores showed a statistically
significant moderate, positive correlation (rs = .4696, p =
<0.001). The content and coverage of the two instruments
were further assessed by examining the correlation
Frew et al. BMC Pediatrics (2015) 15:211
Page 5 of 10
Table 2 Mean CHU9D and PedsQL scores grouped by
respondent characteristics
Number Mean CHU9D
Utility (SD)
PEDSQL total
score (SD)
Male
695
0.826 (0.14)
71.10 (16.81)
Female
649
0.824 (0.13)
69.72 (15.17)
0.38
0.05
Gender
pa
Ethnic Origin:
White British
603
0.836 (0.13)
71.41 (16.07)
Asian
403
0.809 (0.15)
69.19 (15.66)
African Carribean
107
0.818 (0.15)
69.18 (18.35)
Other
215
0.822 (0.12)
70.63 (15.27)
0.02
0.09
0.851 (0.13)
72.52 (17.51)
pa
Weight status groups:
Underweight
40
statistically significant. Children from a non-White
British background have lower mean CHU9D utility
values and this association approaches significance (p =
0.07) for the South Asian population. Also, children
from the least deprived areas have significantly higher
CHU9D utility values relative to children from the most
deprived areas.
Discussion
Weight management interventions increasingly target
preadolescent children and this has implications for the
methods of outcome measurement within economic
evaluation as few instruments exist that are designed to
elicit utilities in this age group. This paper contributes
evidence on the use of the newly developed utility-based
CHU9D instrument, within an ethnically and socioeconomically diverse UK population of young children.
Normal weight
1012
0.825 (0.14)
70.81 (15.57)
Relationship between CHU9D and weight status
Overweight
116
0.811 (0.14)
67.97 (16.12)
Obese
176
0.827 (0.13)
69.44 (18.13)
0.33
0.28
1052
0.83 (0.14)
70.87 (15.64)
292
0.82 (0.13)
68.86 (17.35)
0.30
0.18
The results indicate that there is no statistically significant relationship between the CHU9D utility values and
weight status in children aged 5–6 years. Adjusted for
potential confounding factors, compared to the healthy/
underweight group, children who were overweight/obese
reported lower CHU9D utility values, but this effect was
not statistically significant. A similar result was found
using the PedsQL. When focusing on the CHU9D dimensions, there were no statistically significant differences in scores by child weight status group for any of
the dimensions.
Four previous studies that have measured utility-based
HRQOL in children [18, 37–39] have shown similar
findings. In a US-based study, Belfort et al. (2011) used
the Health Utilities Index-2 (HUI-2) instrument to
measure utility-based HRQOL in children and adolescents aged 5–18 years, and found that utility scores
were, on average, 0.04 lower in overweight/obese participants compared with healthy weight [37]. Boyle et al.
(2010) used the EQ-5D-Y to investigate the effect of
weight on the HRQOL in a UK-based population aged
11–15 years and found children who were overweight or
obese had a significantly lower HRQOL than children of
healthy weight [38]. A recently published paper explored
the relationship between BMI and HRQOL using
CHU9D in two cohorts of Australian children, aged 9–
12 years and 14–16 years. They found mean CHU9D
utility values to be lower in children who were overweight or obese (compared to ‘healthy’ weight children),
but this effect was only significant in the younger age
group [39]. Despite these reports of a negative relationship between HRQOL and being overweight in children,
the evidence is mixed in terms of whether this effect
reaches statistical significance. Within a UK-based pilot
study that was linked to this study, the same direction of
pb
Weight status groups:
Underweight/
Healthy weight
Overweight/obese
b
p
Deprivation quintiles:
1 Most deprived
738
0.81 (0.14)
69.17 (16.28)
2
239
0.81 (0.14)
71.14 (16.10)
3
146
0.84 (0.13)
73.04 (15.19)
4
113
0.82 (0.13)
71.48 (15.98)
5 Least deprived
88
0.86 (0.11)
72.97 (14.45)
<0.001
0.002
pb
a
Kruskal-Wallis test; bnon-parametric test for trend
between individual CHU9D dimensions and the theoretically similar PedsQL domains (Table 5).
Using conventional cut-off values for Spearman’s ρ, we
found that each CHU9D dimension was either weakly,
or very weakly correlated with each of the predetermined PedsQL domain functioning scores. As the
CHU9D dimensions are coded with 1 as highest level
and 5 as lowest level, the signs on the coefficients were
consistently negative.
Table 6 shows the results of the linear mixed regression model (with random effect for school) which compared the CHU9D utility score between the two weight
status groups, adjusted for potential confounders (age,
gender, ethnicity and deprivation quintile). Children who
are overweight or obese have a lower CHU9D utility
value (i.e. poorer HRQOL) but this association is not
Frew et al. BMC Pediatrics (2015) 15:211
Page 6 of 10
Table 3 Distribution of response to CHU9D dimensions by
weight status category
CHU9D
Level
Dimensions
Worried
Sad
Pain
Tired
Annoyed
Healthy
Overweight and
and underweight obese (n = 292)
(n = 1052)
Chisquared
test
n (%)
p
0.68
Many
45 (4.2)
problems
Can’t do
Daily
routine
245 (23.3)
19 (6.5)
82 (28.0)
No
741 (70.4)
problems
198 (67.8)
A few
113 (10.7)
problems
41 (14.0)
Some
77 (7.3)
problems
20 (6.9)
Many
40 (3.8)
problems
14 (4.8)
Can’t do
19 (6.5)
No
649 (61.7)
187 (64.0)
A little
bit
171 (16.3)
46 (15.8)
A bit
70 (6.6)
23 (7.9)
Quite
67 (6.4)
14 (4.8)
Very
95 (9.0)
22 (7.5)
No
669 (63.6)
181 (62.0)
A little
bit
168 (16.0)
48 (16.4)
Any
723 (68.7)
189 (64.7)
A bit
61 (5.8)
14 (4.8)
Most
136 (12.9)
48 (16.4)
Quite
86 (8.1)
29 (10.0)
Some
79 (7.5)
21 (7.2)
Very
68 (6.5)
20 (6.8)
A few
61 (5.8)
23 (7.9)
No
53 (5.1)
11 (3.8)
0.84
Activities
No
665 (63.2)
187 (64.0)
A little
bit
191 (18.2)
51 (17.5)
A bit
56 (5.3)
10 (3.4)
Quite
47 (4.5)
16 (5.5)
Very
93 (8.8)
28 (9.6)
No
492 (46.8)
141 (48.3)
A little
bit
183 (17.4)
61 (20.9)
A bit
93 (8.8)
18 (6.1)
Quite
69 (6.6)
16 (5.5)
Very
215 (20.4)
56 (19.2)
No
718 (68.2)
196 (67.1)
A little
bit
117 (11.1)
28 (9.6)
A bit
55 (5.2)
19 (6.5)
Quite
40 (3.8)
21 (7.2)
Very
122 (11.6)
28 (9.6)
School/
No
622 (59.1)
home work problems
Sleep
n (%)
Table 3 Distribution of response to CHU9D dimensions by
weight status category (Continued)
186 (63.7)
A few
185 (17.6)
problems
45 (15.4)
Some
94 (9.0)
problems
24 (8.2)
Many
49 (4.6)
problems
17 (5.8)
Can’t do
20 (6.9)
102 (9.7)
No
549 (52.2)
problems
135 (46.2)
A few
140 (13.3)
problems
38 (13.0)
Some
73 (7.0)
problems
18 (6.1)
0.66
0.37
0.09
0.37
81 (7.7)
0.48
0.28
effect was found, but there was no statistical difference
between utility values and weight status groups in children aged 5–6 years [18]. Three reasons were offered to
help explain this result. The first related to the small
pilot sample (n = 160), that may not have been large
enough to assess subgroup differences. The sample size
within this study population is substantially higher, and
a similar result was found. The second reason suggested
that the CHU9D is not sensitive enough to detect a difference in utility-based HRQOL between overweight and
non-overweight children. In this study, the PedsQL total
scores are available for comparison, and although the
PedsQL shows a negative relationship between weight
and HRQOL, again this does not reach statistical significance. Thirdly it was suggested that within this age
group, the co-morbidities attached to obesity do not
substantially affect HRQOL when measured on a 0–1
utility scale, and it is only once these children approach
adolescence that the effects of being overweight have a
negative impact on utility values. This might help explain the results within this study.
Psychometric properties of CHU9D
0.17
This study has also contributed evidence on the construct validity of the CHU9D and the results support the
convergent and the discriminant validity of the instrument. The most significant, consistent finding within the
study population was that HRQOL when measured
using both the CHU9D and the PedsQL, was lower
within children from the most deprived areas, compared
to children from the least deprived areas. This demonstrates that both instruments are discriminating between
these groups of children with known differences. Also
Frew et al. BMC Pediatrics (2015) 15:211
Page 7 of 10
Table 4 Mean PedsQL score by each level of CHU9D dimension
CHU9D
Dimensions
Level
n
Worried
No
836 73.2 (15.05)
A little bit
217 68.0 (16.14)
A bit
93
68.6 (15.70)
Quite
81
65.6 (14.89)
Very
117 59.4 (17.53)
<0.001
No
850 72.9 (15.10)
<0.001
A little bit
216 68.0 (15.95)
Sad
Pain
Tired
Annoyed
School/home
work
Sleep
Daily routine
Mean PedsQL score
(SD)
a
A bit
75
Quite
115 65.8 (16.37)
Very
88
No
852 72.7 (15.65)
A little bit
242 69.4 (14.81)
A bit
66
69.5 (12.63)
Quite
63
63.5 (16.33)
Very
121 60.0 (17.39)
p
Activities
633 75.2 (15.17)
244 69.0 (13.84)
A bit
111 67.6 (16.60)
Quite
85
54
59.3 (15.57)
Can’t do
100 56.8 (15.57)
Any
912 72.5 (15.68)
Most
184 69.0 (16.28)
Some
100 67.0 (13.76)
A few
84
64.1 (15.62)
No
64
58.0 (15.68)
<0.001
Non-parametric test for trend
60.8 (18.66)
A little bit
Many
problems
a
66.6 (15.69)
No
Table 4 Mean PedsQL score by each level of CHU9D dimension
(Continued)
<0.001
<0.001
67.5 (16.40)
Very
271 62.5 (15.74)
No
914 73.1 (15.43)
A little bit
145 66.5 (15.10)
A bit
74
65.0 (15.71)
Quite
61
65.2 (16.41)
Very
150 62.3 (16.11)
<0.001
No problems
808 74.2 (14.98)
<0.001
A few
problems
230 67.7 (14.23)
Some
problems
118 63.8 (16.75)
Many
problems
66
Can’t do
122 60.9 (16.67)
with respect to discriminant validity, the results showed
that the mean CHU9D values were significantly higher
for all children with a PedsQL total score greater than or
equal to the sample median total PedsQL score, compared to children with a PedsQL total score less than
the sample median. Furthermore, PedsQL total scores
corresponded well with the individual CHU9D dimensions, with a lower mean PedsQL total score with increasing severity on each CHU9D dimension. Regarding
the convergent validity, overall, there was a moderate,
statistically significant positive correlation between the
PedsQL total scores and the CHU9D utility values. However, despite this correlation between the overall scores
of both instruments, we found only a weak, or very weak
correlation between the dimensions of each instrument
that were pre-determined as being theoretically similar.
One possible explanation is that although the PedsQL
total scores and the CHU9D utility values tap into a
similar underlying construct (HRQOL), the individual
dimensions of each instrument, while appearing quite
similar, might actually be describing something that is
quite specific and different. So at the dimension level the
correlations are weak but when combined, the overall instrument scores become moderately correlated.
62.0 (16.33)
Strengths and weaknesses of the study
No problems
684 74.8 (15.78)
A few
problems
178 69.9 (11.91)
Some
problems
91
64.0 (13.81)
Many
problems
64
66.2 (14.21)
Can’t do
327 63.9 (6.47)
No problems
939 73.7 (14.92)
A few
problems
154 65.9 (15.19)
Some
problems
97
65.2 (15.63)
<0.001
<0.001
The data within this study was collected from the
WAVES trial which was designed to include a diverse
socioeconomic and multi-ethnic population. Parental
consent for participation in the WAVES trial was obtained for 57 % of eligible pupils which could lead to
sample selection bias. However when the proportion
consented out of those eligible was considered by several
socio-demographic characteristics, although there was
some variation, the differences were generally modest
(sex (boys = 65 %, girls = 67 %), ethnicity (white = 75 %,
South Asian = 61 %, Black African Caribbean = 64 %;
deprivation (most deprived quintile = 65 %, least deprived quintile = 72 %).
As it is rare to have utility information available for
children as young as 5 years and for this to be reported
Frew et al. BMC Pediatrics (2015) 15:211
.2
.4
Chu9D utility score
.6
.8
1
Page 8 of 10
0
20
40
60
PedsQL Total Score
Chu9D utility score
Fitted values
80
100
95% CI
Fig. 1 Relationship between CHU9D utility scores and PedsQL total scores
for different weight groups, this study contributes this
much needed evidence. There are some limitations to
note however. First, this paper reports data from a trial
and the available data therefore were restricted to what
was collected as part of the trial. Ideally, it would have
been interesting to assess the convergent validity of the
CHU9D utility data with HRQOL data collected using
an obesity-specific HRQOL instrument. This would have
allowed us to determine if the weak association between
weight and utility-based HRQOL in this age group was
due to there being no underlying relationship there at all
or a lack of sensitivity with detecting the negative effects
of being overweight through use of a generic instrument.
However, the PedsQL is widely viewed as a ‘gold standard’ generic measure of HRQOL, and has been validated
and used in diverse populations. We suggest this as an
Table 5 Correlation between CHU9D dimensions and PedsQL
domain functioning scores
area for future research. Second, all questions within the
PedsQL and the CHU9D were read out to children by
an interviewer and this might have had an influence on
how children responded. This was a pragmatic decision
as children in this age group have very different reading
abilities making self-completion problematic but it could
have influenced children’s responses to the questions.
Third, because of the very small number of children
Table 6 Results of linear mixed model to estimate variation in
CHU9D between weight groups
Variables
Mean
difference
95 % confidence
intervals
Pvalue
Mean value
0.685
(0.529,0.841)
<0.001
-0.005
(-0.023,0.012)
0.52
0.022
(-0.002,0.046)
0.07
Weight
Underweight/Healthy
weight
Overweight/Obese
CHU9D dimension
Correlation with PedsQL score Spearman’s ρ a
Age (years)
Utility score
PedsQL total score
0.47
Ethnic Group:
Worried
Emotional functioning
−0.18
White British
-
Sad
Emotional functioning
−0.18
South Asian
−0.019
(−0.040,0.002)
0.07
Pain
Physical functioning
−0.18
African-Caribbean
−0.006
(−0.037,0.239)
0.66
Tired
Physical functioning
−0.26
Other
−0.005
(−0.028,0.185)
0.66
Annoyed
Emotional functioning
−0.22
Deprivation quintile:
School work/
home work
School functioning
−0.21
1 Most deprived
Sleep
Physical functioning
−0.22
2
0.001
(-0.021,0.024)
0.88
3
0.019
(-0.007,0.047)
0.15
Daily routine
Physical functioning
Able to join in activities Social functioning
a
All were significant at 0.01 level
−0.28
−0.13
4
-0.000
(-0.031,0.031)
0.99
Least deprived
0.040
(0.003,0.077)
0.03
Frew et al. BMC Pediatrics (2015) 15:211
who were measuring ‘underweight’ in our sample (3 %) a
decision was made to pull the ‘underweight’ and ‘healthy’
weight children into one weight category. There is no a
priori reason to assume that the HRQOL of underweight
and healthy weight children are similar but we could not
explore this in a statistically robust fashion and the focus
of this paper was on the effects of being overweight on
HRQOL, not underweight. To enable a comprehensive
analysis of the effects of being underweight would have
required a purposive sampling approach to ensure adequate numbers of children in this category.
Conclusion
This paper contributes utility data from a large UKbased pediatric population alongside information on the
psychometric properties of the instrument used to generate these data. Studies suggest that overweight is negatively associated with HRQOL in children but the extent
of the association, how it varies across age groups, and
how it translates to the 0–1 utility scale is as yet underresearched. This paper offers support for the convergent
and discriminant validity of the CHU9D, as a measure of
utility-based HRQOL in children aged 5–6 years. It offers evidence that overweight is negatively associated
with HRQOL in children in this young age group but
that this association is weak. Utility values are frequently
used within health economic studies conducted globally
to derive QALYs to inform resource allocation decisions.
Future studies need to determine how weight status is
associated with HRQOL in utility terms, in different age
cohorts, and across different country settings, to help inform the methods of economic evaluations alongside
clinical trials of childhood obesity prevention and
management.
Abbreviations
BMI: Body mass index; CHU9D: Child Health Utility 9D; HRQOL: health-related
quality of life; HUI: Health Utilities Index; NICE: National Institute for Health
and Care Excellence; PedsQL: Pediatric Quality of Life Inventory TM;
QALYs: quality adjusted life years; WAVES: The West Midlands ActiVe lifestyle
and healthy Eating in School children study.
Competing interests
All authors declare that they have no competing interests.
Authors’ contribution
EF conceived the idea for the study, conducted part of the analysis and
wrote the paper. MP, EL and PA collected the data for the study and edited
the paper. KH carried out part of the analyses and edited the paper. All
authors read and approved the final version of the manuscript.
Acknowledgements
This project was funded by the National Institute for Health Research (NIHR)
Health Technology Assessment programme (project number 06/85/11). The
views and opinion expressed therein are those of the authors and do not
necessarily reflect those of the HTA programme, NIHR, NHS or the
Department of Health.
Page 9 of 10
WAVES trial investigators
Peymane Adab, Tim Barrett, KK Cheng, Amanda Daley, Jon Deeks, Joan
Duda, Emma Frew, Paramjit Gill, Miranda Pallan, Jayne Parry – University of
Birmingham; Ulf Edland – Cambridge MRC Epidemiology Unit; Janet Cade –
University of Leeds; Raj Bhopal – University of Edinburgh.
Trial collaborators
Eleanor McGee – Birmingham East and North PCT; Sandra Passmore –
Birmingham Local Education Authority.
Trial management group
Emma Lancashire, Miranda Pallan, Peymane Adab – University of
Birmingham
Research Team
Behnoush Ahranjani, Jo Clark, Tania Griffin, Kiya Kelleher, Emma Lancashire,
Alastair Canaway, Karla Hemming.
Steering committee
Peymane Adab, John Bennett, Kelvin Jordan, Karla Hemming, Louise
Longworth, Peter Whincup.
Author details
Health Economics Unit, University of Birmingham, Birmingham B15 2TT, UK.
Department of Public Health, Epidemiology and Biostatistics, School of
Health and Populations Sciences, University of Birmingham, Birmingham B15
2TT, UK.
1
2
Received: 5 May 2015 Accepted: 9 December 2015
References
1. Baker JL, Olsen LW, Sorensen TIA. Childhood body mass index and the risk
of coronary heart disease in adulthood. N Engl J Med. 2007;357:2329–37.
2. Lobstein T, Baur L, Uauy R. Obesity in children and young people: a crisis in
public health. Obes Rev. 2004;5(Suppl):4–85.
3. Singh AS, Mulder C, Twisk JWR, van Mechelen W, Chinapaw MJM. Tracking
of childhood overweight into adulthood: a systematic review of the
literature. Obes Rev. 2008;9:474–88.
4. European Commission/ Health & Consumer Protection Directorate-General.
Ten key facts about nutrition and obesity; 2014. />archive/ph_determinants/life_style/nutrition/documents/10keyfacts_nut_
obe.pdf. Accessed January 2015.
5. McPherson K, Marsh T, Brown M. Tackling Obesities: Future Choices Modelling Future Treatment in Obesity and the Impact on Health.
Governement Office for Science Foresight Report; 2007. .
uk/1/shared/bsp/hi/pdfs/22_11_07_modelling_fat.pdf. Accessed January
2015.
6. Waters E, De Silva-Sanigorski A, Hall BJ, Brown T, Campbell TJ, Gao Y et al.
Interventions for preventing obesity in children (Review). Cochrane
Database Syst Rev. 2011;7(12):CD001871. doi:10.1002/14651858.CD001871.
pub3.
7. Doll HA, Petersen SEK, Stewart-Brown SL. Obesity and physical and
emotional well-being: associations between body mass index, chronic
illness, and the physical and mental components of the SF-36
questionnaire. Obes Res. 2000;8:160–70.
8. Fine JT, Colditz GA, Coakley EH, Moseley G, Willet WC, Kawachi I. A
prospective study of weight change and health-related quality of life.
JAMA. 1999;282:2136–42.
9. Han TS, Tijhuis MA, Lean ME, Seidell JC. Quality of life in relation to
overweight and body fat distribution. Am J Public Health. 1998;88:1814–20.
10. Jia H, Lubetkin EI. The impact of obesity on health related quality of life in
the general adult US population. J Public Health. 2005;27:156–64.
11. Lean ME, Han TS, Seidell JC. Impairment of health and quality of life in
people with large waist circumference. Lancet. 1998;351:853–6.
12. Griffiths LPT, Hill AJ. Self-esteem and quality of life in obese children and
adolescents: A systematic review. Int J Pediatr Obes. 2010;5:282–304.
13. Swallen KC, Reither EN, Haas SA, Meier AM. Overweight, obesity, and healthrelated quality of life among adolescents: the National Longitudinal Study
of Adolescent Health. BMC Public Health. 2012;12:997.
Frew et al. BMC Pediatrics (2015) 15:211
14. Wallandar JL, Kerbawy S, Toomey S, Lowry R, Elliot MN, Escobar-Chaves SL,
et al. Is obesity associated with reduced health-related quality of life in
Latino, Black and White children in the community? Int J Obes.
2013;37:920–5.
15. National Institute for Health and Care Excellence (NICE). Guide to the
methods of technology appraisal 2008. Available from: .
uk/media/B52/A7/TAMethodsGuideUpdatedJune2008.pdf.
16. Neumann P. Greenberg: Is the United States ready for QALYs? Health Aff.
2009;28:1366–71.
17. Whitehead SJ, Ali S. Health outcomes in economic evaluation: the QALY
and utilities. Br Med Bull. 2010;96:5–21.
18. Canaway A, Frew E. Is utility-based quality of life in children aged 6–7 years
affected by Body Mass Index (BMI)? International Journal of Obesity. 2014;
38:1146. doi:10.1038/ijo.2013.219.
19. Ungar W. Economic evaluation in child health. Oxford: Oxford University
Press; 2010.
20. Stevens KJ. Working with children to develop dimensions for a preferencebased, generic, pediatric health-related quality of life measure. Qual Health
Res. 2010;20:340–51.
21. Stevens KJ. Assessing the performance of a new generic measure of health
realted quality of life for children and refining it for use in health state
valuation. Appl Health Econ Health Policy. 2011;9:157–69.
22. Ratcliffe J, Stevens K, Flynn T, Brazier J, Sawyer M. An assessment of the
construct validity of the CHU9D in the Australian adolescent general
population. Qual Life Res. 2012;21:717–25.
23. Stevens K, Ratcliffe J. Measuring and valuing health benefits for economic
evaluation in adolescence: an assessment of the practicality and validity of
the Child Health Utility 9D in the Australian adolescent population. Value
Health. 2012;15:1092–9.
24. Cronbach LJ, Meehl PE. Construct validity in pscyhological tests. Psychol
Bull. 1955;52:281–302.
25. Varni JW, Seid M, Rode CA. The PedsQL measurement model for the
pediatric quality of life inventory. Medical Care. 1999;37(2):126-139.
26. The UK Government Web Archive. Communities and Local Government,
Indices of Deprivation 20017. The National Archives; 2010. http://
webarchive.nationalarchives.gov.uk/+/http:/www.communities.gov.uk/
communities/neighbourhoodrenewal/deprivation/deprivation07/. Accessed
January 2015.
27. Mimas National Services. University of Manchester. ervices.
manchester.ac.uk/our-services/research/mimas/. Accessed January 2015.
28. Cole T, Freeman J, Preece M. Body mass index reference curves to the UK,
1990. Arch Dis Child. 1995;73:25.
29. National Obesity Observatory (NOO). A simple guide to classifying body
mass index in children; 2011. Available from: />uploads/doc/vid_11601_A_simple_guide_to_classifying_BMI_in_children.
pdf.
30. Canaway A, Frew E. Measuring preference based quality of life in children
aged 6–7 years: A comparison of the performance of CHU-9D and EQ-5D-Y.
The WAVES pilot study. Qual Life Res. 2014;22:173–82.
31. Stevens K. Valuation of the Child Health Utility 9D Index.
Pharmacoeconomics. 2012;30:729–47.
32. Varni JW, Seid M, Rode CA. The Peds QL Measurement Model for the
Pediatric Quality of Life Inventory. Med Care. 1999;37:126–39.
33. Varni JW, Seid M, Murtin PS. PedsQL 4.0: reliability and validity of the
pediatric quality of life inventory version 4.0 generic core scales in healthy
and patient populations. Med Care. 2001;39:800–12.
34. Varni JW, Burwinkle TM, Katz ER, Meeske K, Dickinson P. The PedsQL in
pediatric cancer: reliability and validity of the pediatric quality of life
inventory generic core scales, multidimensional fatigue scale, and cancer
module. Cancer. 2002;94(7):2090–106.
35. Varni JW, Seid M, Knight TS, Burwinkle TM, Brown J, Szer IS. The PedsQL in
pediatric rheumatology: reliability, validity, and responsiveness of the
pediatric quality of life inventory generic core scales and rheumatology
module. Arthritis Rheum. 2002;46:714–25.
36. Health and Social Care Information Centre. National Child Measurement
Programme. />searchcatalogue?productid=10135&q=title%3a%22national+child
+measurement+programme%22&sort=Relevance&size=10&page=1#top. 15.
37. Belfort M, Zupancic J, Riera K, Runer J, Prosser L: Health state preferences
associated with weight status in children and adolescents. BMC Pediatrics
2011, 11: doi:10.1186/1471-2431-11-12
Page 10 of 10
38. Boyle S, Jones GL, Walters SJ. Physical activity, quality of life, weight status
and diet in adolescents. Qual Life Res. 2010;19:943–54.
39. Chen G, Ratcliffe J, Olds T, Magarey A, Jones M, Leslie E: BMI, Health
Behaviors, and Quality of Life in Children and Adolescents: A School-Based
Study. Pediatrics 2014, 133: doi:10.1542/peds.2013-0622
Submit your next manuscript to BioMed Central
and we will help you at every step:
• We accept pre-submission inquiries
• Our selector tool helps you to find the most relevant journal
• We provide round the clock customer support
• Convenient online submission
• Thorough peer review
• Inclusion in PubMed and all major indexing services
• Maximum visibility for your research
Submit your manuscript at
www.biomedcentral.com/submit