Motor development related to duration of exclusive breastfeeding, B vitamin status and B12 supplementation in infants with a birth weight between 2000-3000 g, results from a randomized
Bạn đang xem bản rút gọn của tài liệu. Xem và tải ngay bản đầy đủ của tài liệu tại đây (691.34 KB, 11 trang )
Torsvik et al. BMC Pediatrics (2015) 15:218
DOI 10.1186/s12887-015-0533-2
RESEARCH ARTICLE
Open Access
Motor development related to duration of
exclusive breastfeeding, B vitamin status
and B12 supplementation in infants with a
birth weight between 2000-3000 g, results
from a randomized intervention trial
Ingrid Kristin Torsvik1*, Per Magne Ueland2,3, Trond Markestad1,4, Øivind Midttun5 and Anne-Lise Bjørke Monsen2
Abstract
Background: Exclusive breastfeeding for 6 months is assumed to ensure adequate micronutrients for term infants.
Our objective was to investigate the effects of prolonged breastfeeding on B vitamin status and neurodevelopment
in 80 infants with subnormal birth weights (2000-3000 g) and examine if cobalamin supplementation may benefit
motor function in infants who developed biochemical signs of impaired cobalamin function (total homocysteine
(tHcy) > 6.5 μmol/L) at 6 months.
Methods: Levels of cobalamin, folate, riboflavin and pyridoxal 5´-phosphate, and the metabolic markers tHcy and
methylmalonic acid (MMA), were determined at 6 weeks, 4 and 6 months (n = 80/68/66). Neurodevelopment was
assessed with the Alberta Infants Motor Scale (AIMS) and the parental questionnaire Ages and Stages (ASQ) at
6 months.
At 6 months, 32 of 36 infants with tHcy > 6.5 μmol/L were enrolled in a double blind randomized controlled trial to
receive 400 μg hydroxycobalamin intramuscularly (n = 16) or sham injection (n = 16). Biochemical status and
neurodevelopment were evaluated after one month.
Results: Except for folate, infants who were exclusively breastfed for >1 month had lower B vitamin levels at all
assessments and higher tHcy and MMA levels at 4 and 6 months. At 6 months, these infants had lower AIMS scores
(p = 0.03) and ASQ gross motor scores (p = 0.01).
Compared to the placebo group, cobalamin treatment resulted in a decrease in plasma tHcy (p < 0.001) and MMA
(p = 0.001) levels and a larger increase in AIMS (p = 0.02) and ASQ gross motor scores (p = 0.03).
Conclusions: The findings suggest that prolonged exclusive breastfeeding may not provide sufficient B vitamins for
small infants, and that this may have a negative effect on early gross motor development. In infants with mild
cobalamin deficiency at 6 months, cobalamin treatment significantly improvement cobalamin status and motor
function, suggesting that the observed impairment in motor function associated with long-term exclusive
breastfeeding, may be due to cobalamin deficiency.
Clinical trial registration: ClinicalTrials.gov, number NCT01201005
Keywords: B vitamins, cobalamin, motor development, infants, breastfeeding
* Correspondence:
1
Department of Pediatrics, Haukeland University Hospital, N-5021 Bergen,
Norway
Full list of author information is available at the end of the article
© 2015 Torsvik et al. Open Access This article is distributed under the terms of the Creative Commons Attribution 4.0
International License ( which permits unrestricted use, distribution, and
reproduction in any medium, provided you give appropriate credit to the original author(s) and the source, provide a link to
the Creative Commons license, and indicate if changes were made. The Creative Commons Public Domain Dedication waiver
( applies to the data made available in this article, unless otherwise stated.
Torsvik et al. BMC Pediatrics (2015) 15:218
Background
Infant micronutrient status depends on gestational age
(GA), birth weight (BW), and maternal micronutrient
status during pregnancy and after delivery for infants
who are breastfed [1, 2]. For infants born at term with
an appropriate weight for GA (AGA), exclusive breastfeeding is believed to ensure an adequate supply of
micronutrients during the first 6 months [3], whereas
iron, folic acid or multivitamin supplementations are
usually given to infants with a BW below 2500 g (g)
[4, 5]. Breast milk is important for the infant, but it is
however, not a complete food, as it is low in vitamins
K and D [6, 7]. Vitamin K injections to neonates and a
minimum daily intake of 400 IU (10 μg) of vitamin D
beginning soon after birth are therefore recommended
by many countries [8–10]. There have also been
concerns about low levels of other vitamins in breast
milk, namely vitamin A, vitamin B2 (riboflavin), vitamin B6 and vitamin B12 (cobalamin) [1, 11, 12], but
routine supplementation of these vitamins to breastfed
infants of under-nourished mothers has not been
implemented [1, 13].
As formula is supplemented with several B vitamins,
deficiency is uncommon in formulafed infants [14, 15].
Folate levels are reported to be high in breast milk, and
folate deficiency in term born AGA breastfed infants is
uncommon [16]. There are few data on the prevalence
of vitamin B2 and B6 deficiency among young infants,
but studies in both low-income and high-income countries have documented a rather high incidence of
deficiency of both vitamins among pregnant and lactating women [17, 18]. Total cobalamin concentration in
human milk falls progressively during the lactation
period [12, 19], and in exclusively breastfed term infants
with an adequate birth weight, a biochemical profile
indicative of impaired vitamin B12 status has been
reported to be common from 4 months [12, 20]
An adequate micronutrient status is important to support
optimal growth and development during infancy [21]. In a
recent intervention study, cobalamin supplementation
resulted in biochemical evidence of cobalamin repletion
and improvement in motor function and regurgitations in
term infants up to the age of 8 months, demonstrating that
an adequate cobalamin status is important for a rapidly
developing nervous system [22]. Other micronutrients,
including iron and zinc, have also been shown to play an
important role in infant motor development [23].
Low BW is a known risk factor for both developmental
delays and lower stores of several micronutrients [24],
which in turn may affect gross motor development [25, 26].
We investigated B vitamin status during the first 6 months
of life in infants with a subnormal BW (2000-3000 g), in
relation to nutrition, i.e. exclusive breastfeeding for 0–1
month or ≥ 1 month. The association between gross motor
Page 2 of 11
development, nutrition and B vitamin status was assessed
at 6 months. Infants with biochemical signs of cobalamin
deficiency at 6 months were included in a randomized
cobalamin intervention study, and biochemical status and
motor development were evaluated after one month.
Methods
Study population and design
Between December 2008 and April 2010, 97 healthy
infants with a BW 2000-3000 g and their mothers were
consecutively recruited at the Department of Obstetrics
and Gynecology, Haukeland University Hospital, Bergen,
Norway. Determination of gestational age (GA) was
based on ultrasonography at 17–18 weeks’ gestation and
small for gestational age (SGA) was defined as BW less
than the 10th percentile for GA according to recently
updated growth charts for Norwegian infants [27].
The infants and their mothers were invited back for
investigation at 6 weeks, 4 months and 6 months. At
each visit the infants’ growth parameters were measured,
a questionnaire on infant and maternal nutrition and
vitamin supplementation was completed and blood
samples were collected from the infant and the mother.
At 6 months, infant neurodevelopment was assessed. In
infants, cobalamin is the main determinant of plasma
tHcy [2, 28] and a plasma tHcy level of 6.5 μmol/L was
chosen as a cut-off for defining impaired cobalamin
function [29]. Infants with a tHcy level >6.5 μmol/L at
6 months were invited to a double blind randomized
controlled cobalamin intervention study, and biochemical status and motor development were evaluated after
one month.
All infants received sugar water for pain relief during
blood sampling and during injection for those included in
the intervention study [30]. The Regional Committee for
Medical and Health Research Ethics West granted ethical
approval of the protocol, and the mothers gave written, informed consent. An additional written, informed consent
was given by the mothers included in the intervention trial.
The trial is registered with ClinicalTrials.gov, number
NCT0 1201005.
Nutrition
According to Norwegian recommendations all infants
receive vitamin D (10 μg per day) as cod liver oil or
vitamin D drops from 6 weeks of age [31]. Infants with
a BW ≤ 2500 g also receive a multivitamin supplement
for the first 3 weeks after being discharged from the
hospital, iron supplements from 6 weeks to 1 year and
folic acid from 3 days to 3 months of age. In this study
multivitamins were provided as Multibionta, (Merck
Selbstmedikation GmbH, Darmstadt, Germany), iron as
ferrous fumarate mixture, (Nycomed Pharma AS,
Asker, Norway), 9 mg daily from 6 weeks to 6 months,
Torsvik et al. BMC Pediatrics (2015) 15:218
and 18 mg daily to 12 months of age, and folic acid
(Apotek, Oslo, Norway), 0.1 mg daily.
Infant nutrition was recorded as exclusive breastfeeding
or mixed feeding, which included breastfeeding combined
with infant formula, exclusive infant formula feeding or either of these combined with cereals or solid foods. Infants
who were never breastfed or exclusively breastfed for less
than 1 month were categorized as formula fed and infants
who were exclusively breastfed for more than 1 month
were categorized as breastfed. Months of breastfeeding
was also used as a continuous variable. It was recommended that solid food, usually starting with infant
cereals, was introduced at 6 months of age. The different
cereals contained 3–10 mg iron, 15–45 μg folic acid and
0.09–0.3 mg vitamin B6 per 100 g powder. The various
formulas contained 0.41–1.22 mg iron, 0.06–0.16 mg riboflavin , 0.02–0.05 mg vitamin B6 , 0.09–0.24 μg cobalamin
and 6–15 μg folic acid per 100 ml prepared milk.
The official guideline in Norway is to take a daily folic
acid supplement of 0.4 mg from 1 month before and
throughout the first 2–3 months of pregnancy; however,
only 10% follow this recommendation [32]. Approximately
80 % of the folic acid users report taking an additional
micronutrient supplements during the first trimester [33].
Neurodevelopmental assessment
At 6 months the infants underwent a pediatric examination and neurodevelopmental evaluation by one
pediatrician (IT), using the Alberta Infants Motor Scale
(AIMS) test [34] and the parental questionnaire Ages
and Stages Questionnaire (ASQ) [35].
AIMS
This is a norm-referenced observational tool designed
for evaluating gross motor development in infants from
birth to 18 months [36]. Assessment is based on free
observation of the child in different positions (prone,
supine, sitting and standing) according to the age of the
child. The obtained score, 0 to 60 points, is converted to
a normative age-dependent percentile rank (5th to 90th
percentile). A score below the 10th percentile is classified
as possibly delayed motor development [36].
All infants were videotaped during the AIMS test. All
scores were revised based on the videotapes, without
access to clinical data, after the study was completed.
The AIMS test was not possible to obtain for all infants
(missing n = 5), because the infant was sleepy or
distressed.
ASQ
To assess neurodevelopment, the Norwegian version of
the 6-month form of ASQ was used. This is a validated
parent-completed developmental screening tool with a
high sensitivity and specificity to detect developmental
Page 3 of 11
delay [37, 38]. ASQ covers 5 developmental domains, i.e.
communication, gross motor function, fine motor function, personal-social functioning and problem solving,
and each domain has 6 questions on the developmental
milestones. The parents evaluate whether the child has
achieved a milestone (yes, 10 points), has partly achieved
the milestone (sometimes, 5 points) or has not yet
achieved the milestone (no, 0 points). Sums of each domain scores were calculated for every infant.
Cobalamin intervention
At 6 months, infants with impaired cobalamin function
(tHcy level >6.5 μmol/L) were invited to participate in
an intervention study. Eligible infants were assigned by
block randomization (envelopes, 10/10) to receive either
an intramuscular injection of 400 μg hydroxycobalamin
(Vitamin B12 Depot, Nycomed Pharma, Norway) (cobalamin group, n = 16), or a sham injection, i.e. the skin
was punctured by a needle connected to a syringe (placebo group, n = 16). These procedures were performed
by one pediatrician (ALBM), and the parents were
blinded to whether their infant received cobalamin or
not (both syringes were wrapped in aluminium foil in
order to hide the content, and the parent was asked to
turn her head away, to prevent her from observing
whether the syringe was activated). Assignment to cobalamin and placebo group was also blinded to the
pediatrician (IT) who performed all the clinical and developmental assessments, and to the laboratory
personnel. All infants were scheduled for follow-up one
month after the first examination and this included
blood tests, AIMS evaluation (IT) and maternal questionnaire concerning nutrition, growth and ASQ.
Blood sampling and analyses
Blood samples from the infants and the mothers were
obtained by antecubital venipuncture and collected into
EDTA Vacutainer Tubes (Becton Dickinson) for separation of plasma and in Vacutainer Tubes without additives (Becton Dickinson) for separation of serum. Blood
samples for preparation of EDTA-plasma were placed in
ice water, and plasma was separated within 4 h. The
samples were stored at –80 °C until analysis. Plasma
levels of total homocysteine (tHcy) and methylmalonic
acid (MMA) were assayed using a (GC-MS) method
based on methylchloroformate derivatization [39].
Serum cobalamin was determined by a Lactobacillus
leichmannii microbiological assay [40], serum folate by a
Lactobacillus casei microbiological assay [41] whereas
plasma levels of riboflavin and pyridoxal 5´-phosphate
(PLP, the active form of vitamin B6) were analyzed using
an LC-MS/MS assay [42]. A complete set of vitamin and
metabolites was not available for all infants at all time
Torsvik et al. BMC Pediatrics (2015) 15:218
points. Analyses of vitamins and biomarkers were
carried out at BEVITAL AS (www.bevital.no).
Page 4 of 11
Table 1 Characteristics of infants and mothers, growth and
neurodevelopmental assessment according to nutrition
Duration of exclusive
breastfeeding (Group)
Statistical analysis
Results are presented as median and interquartile range
(IQR) and mean and standard deviation. Medians were
compared by Mann-Whitney U test, and means with
Student’s t-test. Differences in categorical variables were
tested with the Chi-square test.
Multiple linear regression models were used to assess
the relation of AIMS scores at 6 months with gender,
SGA, weight at 6 months, folic acid and iron supplementation, number of months with exclusive breastfeeding and maternal education.
Graphical illustration of the dose-response relationship
between months of exclusive breastfeeding versus concentrations of cobalamin, folate, PLP, riboflavin, tHcy
and MMA levels at 6 months and between AIMS score
and tHcy and MMA levels at 6 months were obtained
by generalized additive models (GAM). The models were
adjusted for folic acid and iron supplementation (i.e. for
infants with BW ≤ 2500 g).
The calculation of the sample size for the intervention
study was based on data from our previous cobalamin
intervention study in infants below 8 months [22]. A calculated sample size of 36; i.e. 18 in each group, would
give the study a statistical power of more than 80 % to
detect a 1.9 difference in AIMS increment score at a 5 %
significance level.
GAMs were computed using the mgcv-package (version
1.4–1) in R (The R Foundation for Statistical Computing,
version 2.8.1), and the SPSS statistical package (version 18)
was used for the remaining statistical analyses. Two-sided
p-values < 0.05 were considered statistically significant.
Characteristics of infants
0–1 month
(Formula fed)
Pa
>1 month
(Breastfed)
Number at inclusion
32
48
Number at 6 months
26
40
Gender (M) [n (%)]
13 (50)
20 (50)
1
Birth weight (g)
2458 ± 294b
2561 ± 224
0,12
Gestational age (weeks)
36.9 (1.9)
37.3 (1.8)
0,42
Premature [n (%)]
10 (39)
16 (40)
0,90
SGA [n (%)]
7 (30)
13 (33)
0,63
Twins [n (%)]
10 (39)
4 (10)
0,006
Exclusive breastfeed
(months)
0 (0)c
5 (3.4, 5.4)
0,02
16 (62)
Folate and iron
supplementation [n (%)]d
14 (35)
0,03
Multivitamin
11 (42)
supplementation [n (%)]e
12 (30)
0,31
Characteristics of mothers
BMI prior to pregnancy
(kg/m2)
23.7 (4.0)
22.5 (3.3)
0.19
Higher education
[n (%)]f
10 (42)
28 (70)
0,03
Plasma MMA μmol/l
at 6 months
0.15 (0.13–0.18) 0.18 (0.16–0.21)
0.01
Plasma tHcy
μmol/l at 6 months
7.17 (5.91–9.69) 7.86 (7.05–10.95)
0.10
Growth and neurodevelopment at 6 month
Weight (g)
7256 ± 646
7019 ± 894
0,25
Weight gain (g)g
4797 ± 750
4458 ± 907
0,10
AIMS (score)
24 (22, 27)
21 (18, 25)
0,03
AIMS (percentile)
50–75 (25–50,
75)
25–50 (25, 50)
0,01
Demographics and Nutrition
Infants
ASQ, communication
(score)
48 (40, 50)
45 (35, 50)
0.35
Of the 97 infant-mother dyads initially recruited at birth,
80 infants (including 8 pairs of twins and 1 single twin)
returned at 6 weeks, and were included in either the
formula fed group (n = 32, 40 %) or the breastfed group
(n = 48, 48 %). The formula fed group comprised infants
who were never breastfed (n = 27) and infants who were
exclusively breastfed for less than 1 month (n = 5),
whereas the breastfed group included infants who were
exclusively breastfed for more than 1 month. Mean GA
was 37 weeks (SD 1.8), 41 % were premature, and 33 %
were SGA. Apart from a higher percentage of twins in
the formula fed group, there were no differences in infant characteristics between the formula fed and breastfed infants (Table 1).
At 4 months, 12 infants were lost to follow-up (8
from the breastfed group and 4 from the formula fed
ASQ, gross motor (score) 40 (35, 49)
35 (25, 40)
0.01
ASQ, fine motor (score)
50 (36, 60)
35 (30, 50)
0.06
ASQ, problem solving
(score)
50 (50, 60)
50 (40, 58)
0.22
ASQ, personal-social
(score)
45 (35, 50)
45 (35, 53)
0.66
Results
a
Proportions were compared by chi-square test. Means were compared by
student’s t-test. Medians were compared by mann-Whitney U test
b
Mean ± SD (all such values)
c
Median; IQRs in parentheses (variable that was not normally distributed) (all
such values)
d
Folic acid supplementation 0.1 mg daily from day 3 to 3 months
e
Multivitamin supplementation the first 3 weeks of life
f
Minimum 3 years of college or university education (one missing in
each group)
g
Weight gain from birth to 6 months
SGA Small for gestational age < 10percentila, AIMS Alberta Infant Motor Scale,
AIMS was missing for 5 infants, ASQ Ages and stages questionnaires, ASQ was
missing for 5 infants
Torsvik et al. BMC Pediatrics (2015) 15:218
Page 5 of 11
group) and at 6 months additional 2 infants were lost
to follow-up in the formula fed group. These 14 infants showed no significant differences in baseline
characteristics compared to the study group at 6 weeks
(all p > 0.21).
As recommended, all infants received cod liver oil or
other vitamin D supplementation from age 6 weeks and
infants with BW ≤ 2500 g (n = 36, 45 %) also received
iron (100 %), folic acid (100 %) and multivitamin supplement (78 %).
Table 2 Vitamins and metabolites in infants aged 6 weeks,
4 months and 6 months according to nutritiona
Mothers
Serum
cobalamin,
pmol/L
A higher proportion of the breastfeeding mothers had
higher education and they tended to have a lower pre
pregnancy body mass index (Table 1). Age, parity and
number of previous pregnancies were the same for the
groups.
Daily use of multivitamin supplement for a shorter or
longer period was reported by 38 % of the mothers during
pregnancy, and by 28 % postpartum up to 6 months, with
no significant differences between the groups (p > 0.29).
Apart from a higher MMA level at 6 months in the breastfeeding compared to the formula feeding mothers
(Table 1), no significant differences were observed in maternal B vitamin status between the two groups (p > 0.10).
During follow-up, the mothers had a fairly stable vitamin
B status except for PLP, which increased from 6 weeks to
6 months. Maternal PLP and riboflavin levels were considerably lower than in the infants.
Infant vitamin status in relation to breastfeeding practice
At 6 months, duration of exclusive breastfeeding in
months from birth was inversely associated with infant
B vitamin levels, i.e. cobalamin (r = -0.55, p < 0.001), PLP
(r = -0.53, p < 0.001), riboflavin (r = -0.57, p < 0.001), and
positively associated with the metabolic markers, tHcy
(r = 0.47, p < 0.001) and MMA (r = 0.55, p < 0.001). No
association was observed between duration of exclusive
breastfeeding and folate level (r =0.01, p = 0.97).
Although cobalamin, PLP and riboflavin levels increased somewhat in the breastfed infants from 6 weeks
to 6 months, the formula fed infants had at all assessments significantly higher levels of these vitamins and at
4 and 6 months also significantly lower levels of the
metabolic markers tHcy and MMA compared to breastfed infants (Table 2). The groups did not differ in folate
levels at any time point (Table 2).
In a multiple linear regression model, which included gender, infant weight at 6 months, and iron
and folate supplementation (i.e. for infants with BW ≤
2500 g), the strongest determinant of infant B vitamin
status at 6 months was duration (months) of exclusive
breastfeeding (Table 3). B vitamin status at 6 months
showed a linear, inverse relationship with duration
Duration of exclusive breastfeeding
(Group)
Number
Serum folate,
nmol/L
Plasma PLP,
nmol/L
Plasma
riboflavin,
nmol/L
Plasma tHcy,
μmol/L
Plasma
MMA,μmol/L
a
Pb
0–1 month
(Formula fed)
>1 month (Breastfed)
32
48
At 4
27
monthsc
40
At 6
26
monthsd
40
At 6
weeks
372 (294, 444)
234 (158, 321)
<0.001
At 4
months
476 (404, 573)
281 (224, 423)
<0.001
At 6
months
497 (387, 622)
321 (198, 451)
<0.001
Pe
<0.001
<0.001
At 6
weeks
56.4 (30.6,
118,4)
27.2 (21.1, 119.9)
0.09
At 4
months
61.4 (44.0, 84.5)
64.4 (41.8, 85.6)
0.96
At 6
months
53.9 (34.2, 67.0)
50.5 (39.9, 62.5)
0.69
Pe
0.48
0.02
At 6
weeks
274 (201, 337)
79 (42, 132)
<0.001
At 4
months
230 (155, 281)
135 (88, 161)
<0.001
At 6
months
184 (123, 278)
122 (93, 162)
<0.001
Pe
0.006
0.007
At 6
weeks
62.2 (43.1, 84.1)
16.3 (13.8, 22.6)
<0.001
At 4
months
36.3 (21.0, 47.2)
12.5 (9.8, 17.1)
<0.001
At 6
months
33.5 (22.7, 49.5)
14.8 (10.6, 18.5)
<0.001
Pe
0.001
0.02
At 6
weeks
7.24 (5.91, 8.42)
7.44 (6.31, 9.07)
0.36
At 4
months
5.90 (5.14, 7.26)
8.11 (6.40, 10.32)
<0.001
At 6
months
5.38 (4.38, 6.96)
7.35 (5.78, 9.02)
0.001
Pe
<0.001
0.50
At 6
weeks
0.61 (0.38, 1.14)
0.54 (0.28, 1.87)
0.59
At 4
months
0.22 (0.20, 0.39)
0.50 (0.21, 1.32)
0.01
At 6
months
0.19 (0.16, 0.36)
0.59 (0.33, 1.20)
<0.001
Pe
<0.001
0.29
At 6
weeks
All values are medians, (IQR)
b
Mann-Whitney U
c
4 months: One blood sample missing 0–1 month, one missing for cobalamin
and folate >1 month
d
6 months: Four missing for PLP and riboflavin >1 month
e
Friedman test
PLP Pyridoxal 5´-phosphate, tHcy total homocysteine, MMA Metylmalonic acid
Torsvik et al. BMC Pediatrics (2015) 15:218
Page 6 of 11
Table 3 Determinants of B vitamin in infants aged 6 months (n = 66) by multiple linear regressiona
Independent variables
Gender (boys, girls)
b
Weight
Serum
cobalamin
Serum
folate
B
p
B
25.65
0.67
-3.53
33.44
0.23
0.001
Exclusive breastfeedingc -44.32
Plasma PLP
Plasma
riboflavin
Plasma total
homocysteine
Plasma methylmalonic
acid
p
B
p
B
p
B
p
B
p
0.55
8.79
0.61
-0.32
0.93
-0.01
0.99
-0.03
0.90
0.83
0.76
0.61
0.94
3.00
0.09
-0.07
0.80
-0.15
0.15
-0.76
0.53
-17.53 <0.001 -4.16
<0.001
0.55
<0.001
0.12
0.008
a
The regression model contains folic acid and iron supplementations as independent variables, in addition to the parameters listed in the table
Infant weight at 6 months, quartiles
Exclusive breastfeeding, number of months with exclusive breastfeeding from birth to 6 months
PLP Pyridoxal 5´- phosphate, B: regression coefficient
b
c
(months) of exclusive breastfeeding, as shown by
GAM (Fig. 1a).
When comparing infants with BW ≤ 2500 g and BW
2501-3000 g, we observed no differences in B vitamin
levels and the metabolic markers at 4 or 6 months (p >
0.13) except for folate at 6 weeks and 4 months, which
was higher in infants BW ≤ 2500 g, who had been supplemented with folic acid (p < 0.001).
Neurodevelopment in relation to breastfeeding practice
and B vitamin status
AIMS data were available for 61 of the 66 (92 %) infants
at 6 months. Of the 5 infants with missing data, 3 came
from the formula fed and 2 from the breastfed group.
The formula fed infants had a significantly higher median AIMS score than the breastfed infants (Table 1).
In the breastfed group 25/38 (66 %) infants scored
below the 50th percentile and 8/38 (21 %) below the 10th
percentile, i.e. classified as possibly delayed motor development, compared to 9/23 (39 %, p = 0.04) and 3/23
(13 %, p = 0.43) in the formula fed group.
Duration of exclusive breastfeeding was a significant
negative predictor of AIMS score in a multiple linear regression model adjusted for gender, SGA, infant weight at
6 months, maternal education and folate and iron supplementations (B = -0.5; (95 % CI; -0.9 - -0.03, p = 0.04) per
month of exclusive breastfeeding). The dose-response reduction in AIMS score with increasing levels of tHcy and
MMA is visualized by GAM curves in Fig. 1b.
ASQ data were available for 61 of the 66 (92 %) infants
at 6 months (missing data for 2 infants in the formula
fed and for 3 infants in the breastfed group). The breastfed infants had a significantly lower median gross motor
score (p = 0.01) and the median fine motor score showed
a similar trend (p = 0.06). No significant differences were
observed for communication, personal-social functioning
and problem solving skills (p > 0.09) (Table 1).
Cobalamin intervention
At 6 months, 36 (45 %) of the 66 infants had plasma
tHcy > 6.5 μmol/L and were invited to participate in the
intervention study. Of these, 32 infants accepted and
were included (cobalamin group, n = 16 and placebo
group, n = 16). All, but one infant (from the placebo
group), came back for assessment after one month.
At inclusion, there were no significant differences between the cobalamin and the placebo group for infant
characteristics (growth parameters at birth and 6 months,
GA, SGA and twin status, use of vitamins and iron, AIMS
score and ASQ scores) or maternal characteristics (age,
pre pregnancy BMI and parity) (p > 0.06). There were
however, more girls in the cobalamin group (11/16) than
in the placebo group (4/16) (p = 0.01) and infants in the
cobalamin group were exclusively breastfed for a longer
period (median 5 months (IQR 3, 6)) compared to the placebo group (3 months (0, 5), p = 0.03). This was reflected
in significantly higher tHcy levels (median 9.57 μmol/L
(IQR 7.62, 11.61)) in the cobalamin group compared to
the placebo group (7.72 μmol/L (6.91, 8.33), p = 0.02) at
inclusion. No other significant differences in metabolic
parameters were seen (p > 0.16).
The observed changes in cobalamin, tHcy, and MMA
levels from inclusion to follow-up were significantly
greater in the cobalamin compared to the placebo group
(Table 4), while no significant differences between the
two groups were observed for the other vitamins. AIMS
and ASQ scores increased in both groups from inclusion
at age 6 months to follow-up at age 7 months as expected; however, the median increase in scores for AIMS
and for ASQ gross motor function were significantly
higher for the cobalamin group than the placebo group
(Table 4). There were no significant differences between
the groups for fine motor score, communication,
personal-social functioning or problem solving skills
(p > 0.4). No adverse effects from the cobalamin injections were reported.
Discussion
In the present study of infants with BW between 20003000 g, those who were mainly formula fed from birth
had significantly higher levels of cobalamin, PLP and riboflavin and lower levels of the metabolic markers, tHcy and
MMA, and a better gross motor development at 6 months
compared to infants who were exclusively breastfed for
Torsvik et al. BMC Pediatrics (2015) 15:218
a
b
Fig. 1 (See legend on next page.)
Page 7 of 11
Torsvik et al. BMC Pediatrics (2015) 15:218
Page 8 of 11
(See figure on previous page.)
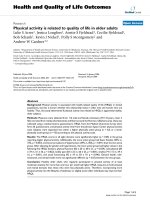
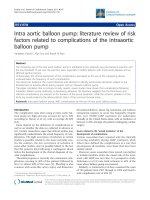
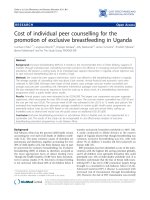
Fig. 1 a. Dose-response relationship of cobalamin, folate, PLP, riboflavin, tHcy and MMA at 6 months with months of exclusive breastfeeding by
Generalized additive models (GAM), adjusted for gender, infant weight at 6 months and iron and folate supplementation. The solid line shows
the fitted model and the shaded areas indicate 95 % CIs. PLP, pyridoxal 5´phosphate; tHcy, total homocysteine; MMA, methylmalonic acid. b.
Dose-response relationship of tHcy and MMA at 6 months with AIMS scores at 6 months by Generalized Additive Models (GAM), adjusted for
gender, infant weight at 6 months and iron and folate supplementation. The solid line shows the fitted model and the shaded areas indicate
95 % CIs. tHcy, total homocysteine; MMA, methylmalonic acid
more than 1 month, despite the fact that the formula fed
group had more twins and lower maternal educational
level, factors known to be negatively associated with neurodevelopment [43, 44]. Furthermore, vitamin status, as
well as gross motor function, was negatively and linearly
associated with duration of exclusive breastfeeding when
adjusted for possible confounders.
In infants with biochemical signs of mild cobalamin deficiency at 6 months, cobalamin treatment resulted in significant improvement in cobalamin status and motor function.
These results indicate that the observed impairment in
motor function associated with long-term exclusive breastfeeding, may be due to cobalamin deficiency.
Study design and limitations
Plasma methylmalonic acid, -0.88 (-2.01,
-0.07 (-0.33, 0.29),
μmol/L, (median (IQR)),
-0.12), -113 % -14 %
%change
0.001a
Serum folate, nmol/L,
(median (IQR)), %change
-16.1 (-30.4,
-2.5), -37 %
-14.0 (-16.8, -2.9),
-29 %
<0.44a
Plasma PLP, μmol/L,
(median (IQR)), %change
12 (-24, 38),
9%
0 (-22, 61),
0%
<0.98a
Plasma riboflavin, μmol/L,
(median (IQR)), %change
0.3 (-4.8, 2.7),
2%
3.7 (-3.5, 8.4), 3 %
<0.32a
AIMS score, (median (IQR)),
%change
7.0 (5.3, 9.8),
36 %
5.0 (4.0, 7.0), 23 %
0.02a
ASQ; Gross motor score
(median (IQR)), %changec
12.5 (10.0,
16.3), 42 %
10.0 (-1.3, 10.0),
29 %
0.03a
Weight, gram, (mean (SD)),
%change
532 (230),
8%
377 (257),
6%
0.09b
Length, cm, (mean (SD)),
%change
2.0 (1.3), 3 %
1.8 (1.1), 3 %
0.81b
The first part of this study was observational, known to
have its limitations. However, data were collected prospectively, the participation rate was high throughout
the study and there were no significant differences in infant or maternal characteristics between the two groups
that could explain the differences in clinical outcome.
Evaluation of motor development, a major developmental function in early infancy [36, 45] is challenging
[46]. Infants develop discontinuously, and the age of
achieving gross motor milestones varies substantially
among healthy term infants [47]. The AIMS test is considered to be among the most reliable tests for assessing
gross motor function [36, 45] and ASQ is a validated
screening tool with high sensitivity and specificity to detect children with developmental delay [38]. It was a
weakness of the study that the examiner was not blinded
to the nutrition of the infants when the infants were first
assessed at 6 months, however, as all AIMS scores were
revised based on the videotape, without access to clinical
data, after the study was completed, potential confounding
was minimized. In the intervention study, both the parents and the examiner were blinded to the intervention
when assessing the infants 1 month after randomization.
The intervention study included 86 % of eligible infants with cobalamin deficiency at 6 months. Apart from
differences in gender and period of exclusive breastfeeding, similar characteristics of the cobalamin and placebo
groups suggest that the randomization was appropriate.
The given dose of 400 μg hydroxycobalamin represents
approximately twice the total amount of cobalamin considered necessary for the first year of life, based on an
Adequate Intake (AI) for cobalamin [48]. This dosage
has been proven to improve cobalamin status and enhance motor development in young infants [22].
Head circumference, cm,
(mean (SD)), %change
0.8 (0.7), 2 %
0.8 (0.4), 2 %
0.89b
B vitamin status and psychomotor development
Table 4 Change in biochemical status and clinical parameters
according to cobalamin intervention at 6 months and follow-up
at 7 months
Trial Groups
(tHcy: 6.73–15.96)
P value
Change in variables
Cobalamin
Group
Number
16/16
16/15
Serum cobalamin, pmol/L,
(median (IQR)), %change
707 (422,
904), 254 %
33 (-17, 74), 10 %
<0.001a
Plasma total homocysteine, -5.85 (-7.48,
μmol/L, (median (IQR)),
-4.37), -61 %
%change
-1.02 (-1.81, -0.23),
-13 %
<0.001a
a
Placebo Group
Medians were compared by Mann-Whitney U test
b
Means were compared by Student’s t-test
c
Missing data for 2 infants in the Cobalamin group and 4 infants in the
Placebo group
PLP Pyridoxal 5´- phosphate, AIMS Alberta Infant Motor Scale, ASQ Ages and
Stages Questionnaires
Gross motor function is a good marker of neurodevelopment in early infancy [45, 49], and is known to be related
to micronutrient status [25, 26]. We have earlier demonstrated in a randomized, double blind intervention study
that cobalamin supplementation not only improves
Torsvik et al. BMC Pediatrics (2015) 15:218
Page 9 of 11
biochemical measures of cobalamin status, but also motor
development and gastrointestinal symptoms in moderately
cobalamin-deficient infants, an observation that emphasizes
the importance of an adequate cobalamin status for normal
neurodevelopment [22]. In the present study, formula fed
infants had significantly better B vitamin status and higher
median AIMS and ASQ scores compared to the breastfed
infants. We cannot exclude that nutrients other than B vitamins, may at least partially, have contributed to the observed differences in clinical outcome. Our study
population consisted of infants born with a suboptimal
BW, and one may assume that they had a higher risk of
micronutrient deficiency compared to infants born AGA
close to term. Motor development was, however, not related to BW or AGA vs. SGA status. Motor development is
influenced by several factors, like GA, BW, neonatal health
and genetic, cultural and parental sociodemographic factors
[43, 50]. After adjusting for such factors, the associations
between gross motor function and duration of exclusive
breastfeeding remained, suggesting that at least cobalamin
status had a significant effect on gross motor function. The
intervention study confirmed this notion, as our results indicate that the observed impairment in motor function associated with long-term exclusive breastfeeding is corrected
by cobalamin supplementation.
infants at this age. As B vitamins are important for development, these data suggest that introduction of solid
animal food should start from age 3–4 months.
Prolonged exclusive breastfeeding and adequate
micronutrient status
Competing interests
PMU and ALBM are members of the steering board of the nonprofit
Foundation to Promote Research into Functional Vitamin B12 Deficiency. The
other authors have no conflicts of interest relevant to this article to disclose.
With the exception of vitamin D and K, which are supplemented, the World Health Organization (WHO) considers breast milk to be a complete food for the term
infant for the first 6 months of life, a period of rapid
growth and development [51]. Low BW (<2500 g) is a
recognized risk factor for multiple micronutrient deficiencies, although supplementation with only iron and
folic acid are commonly recommended [52–54].
We observed a higher MMA level, despite a similar
cobalamin level, indicative of inadequate intracellular cobalamin status, in the breastfeeding compared to the formula feeding mothers at 6 months. Cobalamin levels in
milk correlate with maternal plasma levels [55] and falls
progressively during the lactional period [12, 19]. The
estimated cobalamin intake from breastmilk has been reported to be maximal at 12 weeks, and reduced by 50 %
at 24 weeks [56], which may not be satisfactory given
the crucial role for cobalamin in neurodevelopment [20].
The present study suggests that prolonged exclusive
breastfeeding may not sustain sufficient B vitamin status,
not only for those with a low BW, but also for infants
with a BW in the range 2500–3000 g. Although all B vitamins, except for folate, were lower in breastfed infants
already from 6 weeks, the metabolic markers were
significantly higher from 4 months, suggesting an intracellular B vitamin deficency in exclusively breastfed
Conclusion
In this study, duration of exclusive breastfeeding was
associated with lower B vitamin status and poorer
gross motor development at 6 months in infants with
BW 2000-3000 g. In infants with biochemical signs of
mild cobalamin deficiency at 6 months, cobalamin
treatment resulted in significant improvement in
cobalamin status and motor function. These results
indicate that the observed impairment in motor function associated with long-term exclusive breastfeeding,
may be due to cobalamin deficiency. In order to obtain an adequate cobalamin status to ensure normal
neurodevelopment, we suggest that introduction of
solid animal food should start from age 4 months in
infants with a subnormal BW.
Abbreviations
AGA: Appropriate weight for Gestational Age; AIMS: Alberta Infant Motor
Scale; ASQ: Ages and Stages Questionnaire; BW: Birth Weight; G: Grams;
GA: Gestational Age; GAM: Generalized Additive Models; tHcy: Plasma levels
of total plasma homocysteine; IQR: Interquartile Range; MMA: Methylmalonic
Acid; PLP: Pyridoxal 5´-phosphate; SD: Standard Deviation; SGA: Small for
Gestational Age.
Authors’ contributions
IT and ALBM designed and performed experiments, analysed data and wrote
the paper. PMU was responsible for the biochemical analyses. PMU, TM and
ØM discussed the results and implications, commented on the manuscript at
all stages. ALBM had primary responsibility for final content. All authors read
and approved the final manuscript.
Acknowledgements
We thank all mothers and infants for their willingness to participate in the
study and the laboratory staff at the Laboratory of Clinical Biochemistry,
Haukeland University Hospital, Norway for help with blood sampling and the
laboratory staff at Bevital AS for the blood analyses.
Funding source
The study was supported by grants from the Norwegian Women’s Public
Health Association and the Foundation to promote research into functional
vitamin B12-deficiency. The sponsor of the study had no role in study design,
data collection, data analysis, data interpretation, writing of the report or in
the decision to submit the paper for publication. The corresponding author
had full access to all the data in the study and had final responsibility for the
decision to submit for publication.
Financial disclosure statement
The authors have no financial relationships relevant to this article to disclose.
Author details
1
Department of Pediatrics, Haukeland University Hospital, N-5021 Bergen,
Norway. 2Laboratory of Clinical Biochemistry, Haukeland University Hospital,
N-5021 Bergen, Norway. 3Institute of Medicine, Faculty of Medicine and
Dentistry, University of Bergen, N-5021 Bergen, Norway. 4Department of
Clinical Science, Faculty of Medicine and Dentistry, University of Bergen,
N-5021 Bergen, Norway. 5Bevital AS, N-5021 Bergen, Norway.
Torsvik et al. BMC Pediatrics (2015) 15:218
Received: 8 September 2015 Accepted: 9 December 2015
References
1. Allen LH. B vitamins in breast milk: relative importance of maternal status
and intake, and effects on infant status and function. Adv Nutr (Bethesda,
Md). 2012;3(3):362–9.
2. Bjorke Monsen AL, Ueland PM, Vollset SE, Guttormsen AB, Markestad T,
Solheim E, et al. Determinants of cobalamin status in newborns. Pediatrics.
2001;108(3):624–30.
3. Kramer MS, Kakuma R. Optimal duration of exclusive breastfeeding.
Cochrane Database Syst Rev. 2012;8:CD003517.
4. Berglund SK, Westrup B, Domellof M. Iron supplementation until 6 months
protects marginally low-birth-weight infants from iron deficiency during
their first year of life. J Pediatr Gastroenterol Nutr. 2015;60(3):390–5.
5. Lohner S, Fekete K, Berti C, Hermoso M, Cetin I, Koletzko B, et al. Effect of
folate supplementation on folate status and health outcomes in infants,
children and adolescents: a systematic review. Int J Food Sci Nutr. 2012;
63(8):1014–20.
6. Greer FR. Do breastfed infants need supplemental vitamins? Pediat Clin N
Amer. 2001;48(2):415.
7. Markestad T, Aksnes L, Finne PH, Aarskog D. Plasma concentrations of
vitamin D metabolites in a case of rickets of prematurity. Acta Paediatr
Scand. 1983;72(5):759–61.
8. American Academy of Pediatrics Committee on Fetus and Newborn.
Controversies concerning vitamin K and the newborn. American Academy
of Pediatrics Committee on Fetus and Newborn. Pediatrics. 2003;112(1 Pt 1):
191–2.
9. Wagner CL, Greer FR. Prevention of rickets and vitamin D deficiency in
infants, children, and adolescents. Pediatrics. 2008;122(5):1142–52.
10. DoH LH. Vitamin K for newborn babies. PL/CMO. 1998;1998:98(3).
11. Vinutha B, Mehta MN, Shanbag P. Vitamin a status of pregnant women and
effect of post partum vitamin a supplementation. Indian Pediatr. 2000;
37(11):1188–93.
12. Greibe E, Lildballe DL, Streym S, Vestergaard P, Rejnmark L, Mosekilde L, et
al. Cobalamin and haptocorrin in human milk and cobalamin-related
variables in mother and child: a 9-mo longitudinal study. Am J Clin Nutr.
2013;98(2):389–95.
13. Butte N, Lopez-Alarcon MG, Garza C. Nutrient adequacy of exclusive
breastfeeding for the term infnat during the first six months of life. Geneva:
World health organization; 2002.
14. Fokkema MR, Woltil HA, van Beusekom CM, Schaafsma A, Dijck-Brouwer DA,
Muskiet FA. Plasma total homocysteine increases from day 20 to 40 in
breastfed but not formula-fed low-birthweight infants. Acta Paediatr. 2002;
91(5):507–11.
15. Specker BL, Brazerol W, Ho ML, Norman EJ. Urinary methylmalonic acid
excretion in infants fed formula or human milk. Am J Clin Nutr. 1990;51(2):
209–11.
16. Tamura T, Yoshimura Y, Arakawa T. Human milk folate and folate status in
lactating mothers and their infants. Am J Clin Nutr. 1980;33(2):193–7.
17. Bamji MS, Prema K, Jacob CM, Ramalakshmi BA, Madhavapeddi R.
Relationship between maternal vitamins B2 and B6 status and the levels of
these vitamins in milk at different stages of lactation. A study in a lowincome group of Indian women. Hum Nutr Clin Nutr.
1986;40(2):119–24.
18. Dostalova L. Vitamin status during puerperium and lactation. Ann Nutr
Metab. 1984;28(6):385–408.
19. Craft IL, Matthews DM, Linnell JC. Cobalamins in human pregnancy and
lactation. J Clin Pathol. 1971;24(5):449–55.
20. Bjorke-Monsen AL, Ueland PM. Cobalamin status in children. J Inherit Metab
Dis. 2011;34(1):111–9.
21. Benton D. Vitamins and neural and cognitive developmental outcomes in
children. Proc Nutr Soc. 2012;71(1):14–26.
22. Torsvik I, Ueland PM, Markestad T, Bjorke-Monsen AL. Cobalamin
supplementation improves motor development and regurgitations in
infants: results from a randomized intervention study. Am J Clin Nutr. 2013;
98(5):1233–40.
23. Black MM, Baqui AH, Zaman K, Ake Persson L, El Arifeen S, Le K, et al. Iron
and zinc supplementation promote motor development and exploratory
behavior among Bangladeshi infants. Am J Clin Nutr. 2004;80(4):903–10.
Page 10 of 11
24. Elizabeth KE, Krishnan V, Vijayakumar T. Umbilical cord blood nutrients in
low birth weight babies in relation to birth weight & gestational age. Indian
J Med Res. 2008;128(2):128–33.
25. Angulo-Barroso RM, Schapiro L, Liang W, Rodrigues O, Shafir T, Kaciroti N, et
al. Motor development in 9-month-old infants in relation to cultural
differences and iron status. Dev Psychobiol. 2011;53(2):196–210.
26. Wighton MC, Manson JI, Speed I, Robertson E, Chapman E. Brain damage in
infancy and dietary vitamin B12 deficiency. Med J Austr. 1979;2:1–3.
27. Skjaerven R, Gjessing HK, Bakketeig LS. Birthweight by gestational age in
Norway. Acta Obstet Gynecol Scand. 2000;79(6):440–9.
28. Minet JC, Bisse E, Aebischer CP, Beil A, Wieland H, Lutschg J. Assessment of
vitamin B-12, folate, and vitamin B-6 status and relation to sulfur amino acid
metabolism in neonates. Am J Clin Nutr. 2000;72(3):751–7.
29. Bjorke-Monsen AL, Torsvik I, Saetran H, Markestad T, Ueland PM. Common
metabolic profile in infants indicating impaired cobalamin status responds
to cobalamin supplementation. Pediatrics. 2008;122(1):83–91.
30. Kassab M, Foster JP, Foureur M, Fowler C. Sweet-tasting solutions for
needle-related procedural pain in infants one month to one year of age.
Cochrane Database Syst Rev. 2012;12:CD008411.
31. Arsky GH, Lande B. Mat for spedbarn. Oslo: Helsedirektoratet afe; 2001.
32. Nilsen RM, Vollset SE, Gjessing HK, Magnus P, Meltzer HM, Haugen M, et al.
Patterns and predictors of folic acid supplement use among pregnant
women: the Norwegian Mother and Child Cohort Study. Am J Clin Nutr.
2006;84(5):1134–41.
33. Bjorke-Monsen AL, Roth C, Magnus P, Midttun O, Nilsen RM, ReichbornKjennerud T, et al. Maternal B vitamin status in pregnancy week 18
according to reported use of folic acid supplements. Mol Nutr Food Res.
2013;57(4):645–52.
34. Piper MC, Pinnell LE, Darrah J, Maguire T, Byrne PJ. Construction and
validation of the Alberta Infant Motor Scale (AIMS). Can J Public Health.
1992;83 Suppl 2:S46–50.
35. Squires J, Bricker D, Twombly E:, Nickel R, Clifford J, Murphy K, et al. Ages &
Stages Questionnaires®, Third Edition (ASQ-3™). 2009.
36. Darrah J, Piper M, Watt MJ. Assessment of gross motor skills of at-risk
infants: predictive validity of the Alberta Infant Motor Scale. Dev Med Child
Neurol. 1998;40(7):485–91.
37. Richter J, Janson H. A validation study of the Norwegian version of the
Ages and Stages Questionnaires. Acta Paediatr. 2007;96(5):748–52.
38. Schonhaut L, Armijo I, Schonstedt M, Alvarez J, Cordero M. Validity of the
ages and stages questionnaires in term and preterm infants. Pediatrics.
2013;131(5):e1468–1474.
39. Windelberg A, Arseth O, Kvalheim G, Ueland PM. Automated assay for the
determination of methylmalonic acid, total homocysteine, and related
amino acids in human serum or plasma by means of methylchloroformate
derivatization and gas chromatography-mass spectrometry. Clin Chem.
2005;51(11):2103–9.
40. Kelleher BP, Broin SD. Microbiological assay for vitamin B12 performed in
96-well microtitre plates. J Clin Pathol. 1991;44(7):592–5.
41. O’Broin S, Kelleher B. Microbiological assay on microtitre plates of folate in
serum and red cells. J Clin Pathol. 1992;45(4):344–7.
42. Midttun O, Hustad S, Ueland PM. Quantitative profiling of biomarkers
related to B-vitamin status, tryptophan metabolism and inflammation in
human plasma by liquid chromatography/tandem mass spectrometry.
Rapid Commun Mass Spectrom. 2009;23(9):1371–9.
43. Lung FW, Shu BC, Chiang TL, Lin SJ. Twin-singleton influence on infant
development: a national birth cohort study. Child Care Health Dev. 2009;
35(3):409–18.
44. Rahu K, Rahu M, Pullmann H, Allik J. Effect of birth weight, maternal
education and prenatal smoking on offspring intelligence at school age.
Early Hum Dev. 2010;86(8):493–7.
45. Rydz D, Shevell MI, Majnemer A, Oskoui M. Developmental screening. J
Child Neurol. 2005;20(1):4–21.
46. Heineman KR, Hadders-Algra M. Evaluation of neuromotor function in
infancy-A systematic review of available methods. J Dev Behav Pediatr.
2008;29(4):315–23.
47. WHOMGRS Group. WHO Motor Development Study: windows of
achievement for six gross motor development milestones. Acta Paediatr.
2006;450:86–95.
48. Intakes SCotSEoDR. Vitamin B12. Dietary Reference Intakes for Thiamin,
Riboflavin, Niacin, Vitamin B6, Folate, Vitamin B12, Pantothenic Acid, Biotin,
and Choline. Washington (DC): National Academy Press; 2000. p. 306–56.
Torsvik et al. BMC Pediatrics (2015) 15:218
Page 11 of 11
49. Majnemer A, Snider L. A comparison of developmental assessments of
the newborn and young infant. Ment Retard Dev Disabil Res Rev. 2005;
11(1):68–73.
50. Cheung YB, Yip PS, Karlberg JP. Fetal growth, early postnatal growth and
motor development in Pakistani infants. Int J Epidemiol. 2001;30(1):66–72.
51. Kramer MS, Kakuma R. Optimal duration of exclusive breastfeeding.
Cochrane Database Syst Rev. 2002;1:CD003517.
52. Baker H, Thind IS, Frank O, DeAngelis B, Caterini H, Louria DB. Vitamin levels
in low-birth-weight newborn infants and their mothers. Am J Obstet
Gynecol. 1977;129(5):521–4.
53. Fomon SJ, Strauss RG. Nutrient deficiencies in breast-fed infants. N Engl J
Med. 1978;299(7):355–7.
54. Siimes MA, Vuori E, Kuitunen P. Breast milk iron–a declining concentration
during the course of lactation. Acta Paediatr Scand. 1979;68(1):29–31.
55. Black AK, Allen LH, Pelto GH, de Mata MP, Chavez A. Iron, vitamin B-12 and
folate status in Mexico: associated factors in men and women and during
pregnancy and lactation. J Nutr. 1994;124(8):1179–88.
56. Ford C, Rendle M, Tracy M, Richardson V, Ford H. Vitamin B12 levels in
human milk during the first nine months of lactation. Int J Vit Nutr Res.
1996;66(4):329–31.
Submit your next manuscript to BioMed Central
and we will help you at every step:
• We accept pre-submission inquiries
• Our selector tool helps you to find the most relevant journal
• We provide round the clock customer support
• Convenient online submission
• Thorough peer review
• Inclusion in PubMed and all major indexing services
• Maximum visibility for your research
Submit your manuscript at
www.biomedcentral.com/submit