Neck circumference as a predictor of metabolic syndrome, insulin resistance and low-grade systemic inflammation in children: The ACFIES study
Bạn đang xem bản rút gọn của tài liệu. Xem và tải ngay bản đầy đủ của tài liệu tại đây (583.88 KB, 9 trang )
Gomez-Arbelaez et al. BMC Pediatrics (2016) 16:31
DOI 10.1186/s12887-016-0566-1
RESEARCH ARTICLE
Open Access
Neck circumference as a predictor of
metabolic syndrome, insulin resistance and
low-grade systemic inflammation in
children: the ACFIES study
Diego Gomez-Arbelaez1,2,3 , Paul Anthony Camacho1, Daniel Dylan Cohen1,2, Sandra Saavedra-Cortes2,
Cristina Lopez-Lopez4 and Patricio Lopez-Jaramillo1,2*
Abstract
Background: The current study aims to evaluate the association between neck circumference (NC) and several
cardio-metabolic risk factors, to compare it with well-established anthropometric indices, and to determine the
cut-off point value of NC for predicting children at increased risk of metabolic syndrome, insulin resistance and
low-grade systemic inflammation.
Methods: A total of 669 school children, aged 8–14, were recruited. Demographic, clinical, anthropometric and
biochemical data from all patients were collected. Correlations between cardio-metabolic risk factors and NC and
other anthropometric variables were evaluated using the Spearman’s correlation coefficient. Multiple linear regression
analysis was applied to further examine these associations. We then determined by receiver operating characteristic
(ROC) analyses the optimal cut-off for NC for identifying children with elevated cardio-metabolic risk.
Results: NC was positively associated with fasting plasma glucose and triglycerides (p = 0.001 for all), and systolic and
diastolic blood pressure, C-reactive protein, insulin and HOMA-IR (p < 0.001 for all), and negatively with HDL-C (p = 0.001).
Whereas, other anthropometric indices were associated with fewer risk factors.
Conclusions: NC could be used as clinically relevant and easy to implement indicator of cardio-metabolic risk in children.
Keywords: Childhood obesity, Anthropometric measurements, Neck circumference, Metabolic syndrome, Low-grade
systemic inflammation, Insulin resistance, Cardiometabolic risk, Latin America, Colombia
Background
The prevalence of obesity in children and adolescents is
increasing worldwide and it is now recognized as an
international public health concern [1]. Epidemiological
and clinical investigations have revealed that the association between obesity and cardiovascular and metabolic
risk factors begins early in life [2, 3]. Childhood obesity
is associated with increased prevalence of hypertension,
dyslipidemia, and abnormal glucose tolerance [2–4].
Thus, identifying and controlling childhood obesity is an
* Correspondence:
1
Dirección de Investigaciones, Fundación Oftalmológica de Santander FOSCAL, Floridablanca, Colombia
2
Instituto MASIRA, Facultad de la Ciencias de la Salud, Universidad de
Santander - UDES, Bucaramanga, Colombia
Full list of author information is available at the end of the article
important goal in the prevention of cardiovascular
diseases (CVD) in later life [5].
Although obesity is at the core of the development of
CVD, appropriate anthropometric measures and cut-off
points to identify children with elevated cardio-metabolic
risk factors are not well established. The most widely used
method to categorize overweight and obese children and to
predict cardiovascular and metabolic risk is the body mass
index (BMI) [6]. However, BMI has been considered as an
imperfect measure of adiposity, because it does not distinguish between muscle mass and fat mass, and requires
calculations and the use of charts that may not always be
available [7, 8].
Alternative measures to BMI such as waist-to-hip ratio
(WHR) and waist circumference, which also give some
© 2016 Gomez-Arbelaez et al. Open Access This article is distributed under the terms of the Creative Commons Attribution
4.0 International License ( which permits unrestricted use, distribution, and
reproduction in any medium, provided you give appropriate credit to the original author(s) and the source, provide a link to
the Creative Commons license, and indicate if changes were made. The Creative Commons Public Domain Dedication waiver
( applies to the data made available in this article, unless otherwise stated.
Gomez-Arbelaez et al. BMC Pediatrics (2016) 16:31
indication of fat distribution, have been used as alternatives, but none of these have been accepted as a gold
standard measure to identify cardiovascular and metabolic risk [9, 10]. Both have limitations in distinguishing
the contribution from ectopic adipose tissue and subcutaneous adipose tissue [11], which show strong and
modest correlations to cardio-metabolic risk, respectively [12, 13].
Prior studies have suggested that upper body fat
plays a role in cardio-metabolic risk [14, 15], and neck
circumference (NC) was proposed as a new measurement to evaluate overweight and obesity in children
[16–18]. NC has demonstrated to be an independent
predictor of metabolic risk beyond BMI and waist circumference [15] and to be positively associated with
insulin resistance and visceral adipose tissue in adults
[19], but few studies have been conducted to determine its association with cardio-metabolic risk factors
in children [20, 21]. Hence, the aims of the present
study were to evaluate the association between NC
and several cardio-metabolic risk factors and to compare
these associations with those of BMI and other wellestablished anthropometric indexes in a Latin American
pediatric population.
Methods
Study population
During the 2011–2012 school year, we conducted the
cross-sectional component of the ACFIES study (Association between Cardiorespiratory Fitness, Muscular Strength
and Body Composition with Metabolic Risk Factors
in Colombian Children) to identify the prevalence
and associations of cardiovascular risk factors, in a sample
of schoolchildren from both sexes, enrolled in public
elementary and high schools (grades 5 and 6), from the
city of Bucaramanga, Colombia. All the recruited participants met the general ACFIES inclusion criteria: age range
8 to 14 years, not having any physical disability and be free
of any acute infection lasting less than 2 weeks before the
inclusion. Moreover, children were excluded if were using
medications that could alter blood pressure, insulin resistance, glycemic levels and/or lipid profile. The study protocol was in accordance with the Declaration of Helsinki
and was approved by the Health Research Ethics Board of
the Ophthalmological Foundation of Santander (FOSCAL). The children expressed their interest in participating in the study, and parents or legal guardians gave
written informed consent, before the children were
included in the study.
Anthropometric measurements and physical examination
All physical assessments and anthropometric measurements were performed after an overnight fast (8 to 10 h), in
duplicate by well-trained health workers. For the analysis
Page 2 of 9
we used the mean of the two measurements. Participant’s
body weight was measured to the nearest 0.1 kg on an electronic device (Tanita BC544, Tokyo, Japan), in underwear
and without shoes, and height was measured to the nearest
0.1 cm using a mechanical stadiometer with platform (Seca
274, Hamburg, Germany), while participants were asked to
stand erect with their head positioned in the Frankfort
horizontal plane. BMI was calculated by dividing body
weight by the square of height (BMI = weight (kg)/
height (m)2). The weight status was classified according to Barlow et al. [22].
Neck circumference was measured to the nearest
0.1 cm using a tape measure. The superior border of the
tape measure was placed just below the laryngeal prominence and applied perpendicular to long axis of the
neck. Waist circumference was determined at the middle
point between the lower edge of the ribs and the iliac
anterior spine. The measurement was made at the end
of a normal expiration while the subject stood upright.
Hip circumference was measured over non-restrictive
underwear at the level of the maximum extension of the
buttocks posteriorly in a horizontal plane. All circumferences were measured using a measuring tape with spring
scale (Ohaus 8004-MA, NJ, USA). WHR was calculated
as waist circumference divided by hip circumference.
Waist-to-height ratio (WHtR) was calculated by dividing
waist circumference by height in cm. The measurements
were realized according to the procedures previously described by Lohman et al. [23].
Skinfold thickness was measured to the nearest 0.2 mm
on the right side of the body at the triceps and subscapular
sites using a skinfold caliper (Harpenden C-136, United
Kingdom) and body fat percentage (%BF-Skinfold) estimated using skinfold equations described by Slaughter et al
[24]. Body fat percentage was also assessed by bioelectrical
impedance analysis (BIA) (%BF-BIA) (Tanita BC544, Tokyo,
Japan). Systolic blood pressure and diastolic blood pressure
were determined after a resting period of 10 min in the
sitting position using an automatic and calibrated sphygmomanometer with a pediatric cuff (Omron HEM 757 CAN,
Hoofddorp, Netherlands). Pubertal development was
assessed by Tanner stage of breast development in girls and
testicular volume in boys [25].
Biochemical parameters
Venous blood samples were collected in the morning at
the same time (07:00 am to 09:00 am), after an overnight
fast (8 to 10 h), and from the antecubital vein. Participants
were asked not to do any prolonged exercise during the
24 h prior to the exam. Blood samples were analyzed for
concentrations of fasting plasma glucose and lipid profile
(total cholesterol, triglycerides, and high-density lipoprotein cholesterol (HDL-C)) using a routine colorimetric
method (Biosystems BTS-303 Photometric, Barcelona,
Gomez-Arbelaez et al. BMC Pediatrics (2016) 16:31
Page 3 of 9
Spain). High-sensitivity C-reactive protein (hs-CRP) was
quantified using a turbid metric test (SPINREACT, Spain),
and insulin levels were determined using an insulin microplate ELISA test (Monobind, USA). Samples were
processed and analyzed in the clinical laboratory of bacteriology school of the University of Santander - UDES.
Homeostasis model assessment for insulin resistance
(HOMA-IR) was calculated using the equation: HOMAIR = Fasting insulin (lU/ml) x Fasting glucose (mg/dl)/
405 [26].
inflammation according to gender, analyzes were made
using the ROC (receiver operating characteristic) curves.
The statistical significance of each analysis was verified
by the area under the ROC curve (AUCs) and by 95 %
confidence intervals (95 % CI´s). The maximum values
of the Youden’s index [29] were used as a criterion for
selecting the optimum cut-off points. All statistical
analyzes were carried out using Stata statistical software, release 11.0 (Stata Corporation, College Station,
TX, USA). A p < 0.05 was considered statistically significant.
Cardiovascular and metabolic risk definition
Results
For this study, the cardiovascular and metabolic risk in children and adolescents was defined according to a modified
version of the National Health and Nutrition Examination
Survey (NHANES) definition of metabolic syndrome
(MetS) [27]. The considered parameters were: increased
waist circumference (≥75th percentile for age and sex of
study cohort), elevated triglycerides (≥110 mg/dl), low
HDL-C (≤40 mg/dl), elevated systolic blood pressure and/
or diastolic blood pressure (≥90 percentile for age, sex and
height), and elevated fasting plasma glucose (≥100 mg/dl).
MetS was defined by the presence of 3 or more of the
above criteria [27]. Although the NHANES definition was
not intended to be applied to children below 12 years of
age, for the purposes of this study to enable comparisons to
be made and as cardiovascular and metabolic alterations
can be present in children from their earliest years of
life [2, 3], we have defined the individual risk components of MetS across the complete sample of children
aged between 8 to 14 years. Moreover, a value of ≥2.6 in
HOMA-IR was considered to indicate insulin resistance
[28], and values of hs-CRP ≥0.55 mg/dl (75th percentile in
our study sample) were considered as low-grade systemic
inflammation.
Descriptive statistics
Statistical analysis
Descriptive statistics were computed for variables of
interest, and included mean values and standard
deviations of continuous variables and absolute and
relative frequencies of categorical factors. Normality
of distribution was checked for continuous variables using
the Shapiro-Wilk test and by graphical methods.
Student’s t-test and Mann-Whitney test were used to
assess potential differences in continuous variables. We
tested for differences in categorical variables using the
Pearson’s chi-squared test (Chi2). Correlations between
cardio-metabolic risk factors and anthropometric variables were evaluated using the Pearson’s correlation or
Spearman’s correlation coefficient, according to normality of
distributions. Multiple linear regression analysis was applied
to further examine these associations.
For selection of the cut-off points of NC that could
identify MetS, insulin resistance and low-grade systemic
As it has been previously reported [30, 31], a total of 669
children and adolescents were recruited during the crosssectional component of the ACFIES study, of which 351
(52.5 %) were boys. The overall mean age was 11.5 ±
1.1 years. Demographic, anthropometric and metabolic
characteristics of the study population by sex are presented
in Table 1. Compared to the girls, mean systolic blood pressure, waist circumference, WHR, WHtR, NC and %BFSkinfold were significantly higher, while height, %BF-BIA,
triglycerides, insulin and HOMA-IR were significantly
lower in boys. Among our study population, 85 (12.9 %)
were overweight and 65 (9.8 %) were obese. There were no
statistically significant differences in weight status and BMI
between both genders. Sex-specific prevalences of MetS
and its individual abnormalities, insulin resistance and lowgrade systemic inflammation were also estimated (Fig. 1),
and statistical differences were not found.
Correlation between anthropometric indexes and
cardio-metabolic risk factors
Correlations of anthropometric indexes and cardiometabolic risk factors are presented in Table 2 for the total
sample and by gender. Z-score BMI was positively correlated with triglycerides, systolic and diastolic blood pressure, hs-CRP, insulin and HOMA-IR in both genders, and
inversely correlated with HDL-C only in boys. Z-score WC
was positively correlated with triglycerides, systolic and diastolic blood pressure, insulin and HOMA-IR in both genders, with fasting plasma glucose and hs-CRP only in girls,
and inversely correlated with HDL-C only in boys. WHR
was positively correlated only with triglycerides in both
genders, with diastolic blood pressure, insulin and HOMAIR only in boys, and with hs-CRP only in girls. WHtR was
positively correlated with triglycerides, systolic and diastolic
blood pressure, insulin and HOMA-IR in both genders,
and with hs-CRP only in girls. %BF-BIA was positively
correlated with triglycerides, systolic and diastolic blood
pressure, insulin and HOMA-IR in both genders, with hsCRP only in girls, and inversely correlated with HDL-C
only in girls. %BF-Skinfold was positively correlated with
systolic and diastolic blood pressure, hs-CRP, insulin and
Gomez-Arbelaez et al. BMC Pediatrics (2016) 16:31
Page 4 of 9
Table 1 Demographic, anthropometric and metabolic data
Total
(n = 669)
Girls
(n = 318)
Boys
(n = 351)
11.52 ± 1.13
11.52 ± 1.10
11.51 ± 1.16
114.51 ± 11.59
113.29 ± 11.72
115.58 ± 11.38b
73.78 ± 9.47
73.66 ± 8.97
73.86 ± 9.93
Weight (kg)
40.08 ± 10.07
40.33 ± 9.77
39.86 ± 10.35
Height (m)
1.45 ± 0.09
1.45 ± 0.08
1.44 ± 0.09b
BMI (kg/m )
18.87 ± 3.61
18.81 ± 3.52
18.93 ± 3.68
WC (cm)
65.95 ± 9.73
64.86 ± 9.02
66.92 ± 10.24b
WHR
0.84 ± 0.08
0.81 ± 0.06
0.86 ± 0.09b
WHtR
0.45 ± 0.06
0.44 ± 0.06
0.46 ± 0.06b
NC (cm)
29.93 ± 2.39
28.40 ± 2.06
29.41 ± 2.55b
%BF-BIA
20.47 ± 7.50
22.71 ± 6.89
18.43 ± 7.46b
%BF-Skinfold
25.47 ± 11.37
24.63 ± 9.10
26.23 ± 13.04b
Z-score BMI (kg/m2)
-0.0004 ± 0.98
-0.0008 ± 0.98
-5.45-7 ± 0.98
Age (years)a
a
SBP (mmHg)
a
DBP (mmHg)
a
Anthropometric measures
2
-0.038 ± 0.99
4.88 ± 0.99
-0.073 ± 0.99b
88.52 ± 12.56
87.87 ± 12.32
89.12 ± 12.76
TC (mg/dl)
159.23 ± 39.28
158.25 ± 39.04
160.13 ± 39.53
HDL-C (mg/dl)
75.34 ± 19.96
74.57 ± 19.82
76.04 ± 20.08
TG (mg/dl)
91.76 ± 52.37
94.07 ± 46.79
89.67 ± 56.97b
hs-CRP (mg/dl)
0.89 ± 1.62
0.88 ± 1.52
0.89 ± 1.71
Insulin (lU/ml)
2.58 ± 2.61
2.91 ± 2.91
2.29 ± 2.26b
HOMA-IR
0.57 ± 0.58
0.64 ± 0.66
0.50 ± 0.50b
29 (4.4)
9 (2.9)
20 (5.8)
Z-score WC (cm)
-8
Biochemical measurementsa
FPG (mg/dl)
Weight status (n - %)d
o Underweight
o Normal weight
479 (72.8)
240 (77.2)
239 (68.9)
o Overweight
85 (12.9)
42 (13.5)
43 (12.4)
o Obese
65 (9.8)
20 (6.4)
45 (12.9)
o1
368 (56.3)
149 (47.8)
219 (64.0)c
o2
208 (31.8)
110 (35.3)
98 (28.7)
o3
78 (11.9)
53 (16.9)
25 (7.3)
Tanner stage (n - %)e
SBP systolic blood pressure, DBP diastolic blood pressure, BMI body mass index, WC waist circumference, WHR waist-to-hip ratio, WHtR waist-to-height ratio,
NC neck circumference, %BF-BIA body fat percentage – bioelectrical impedance analysis, %BF-Skinfold body fat percentage – skinfolds, FPG fasting plasma glucose,
TC total cholesterol, HDL-C high-density lipoprotein cholesterol, TG triglycerides, hs-CRP high sensitivity C-reactive protein
a
Data are presented as mean ± standard deviation for continuous variables. bMann-Whitney test p < 0.05. cPearson’s chi-squared test (Chi2) p <0.05
d
data missing for 11 participants
e
data missing for 15 participants
HOMA-IR in both genders, with triglycerides only in
boys, and inversely correlated with HDL-C in both
genders. NC was positively correlated with fasting
plasma glucose, systolic and diastolic blood pressure,
hs-CRP, insulin and HOMA-IR in both genders, with
triglycerides only in boys, and inversely correlated with
HDL-C in both genders.
Multiple linear regression analysis between
anthropometric indexes and cardio-metabolic risk factors
Table 3 illustrates the results of the multivariate regression analysis conducted using separately each CVD risk
factor as the dependent variable and controlling for
age, gender and Tanner stage. Fating plasma glucose
was significantly associated only with NC, and HDL-C
Gomez-Arbelaez et al. BMC Pediatrics (2016) 16:31
Page 5 of 9
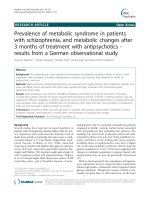
Fig. 1 Prevalence of metabolic syndrome and its components, insulin resistance and low-grade systemic inflammation among study population.
Data are presented as relative frequencies with 95 % confidence intervals represented by vertical bars. Significant differences between girls and
boys (Pearson’s chi-squared test (Chi2)). FPG: fasting plasma glucose; HDL-C: high-density lipoprotein cholesterol; TG: triglycerides; SBP: systolic
blood pressure; DBP: diastolic blood pressure; WC: waist circumference; hs-CRP: high sensitivity C-reactive protein
was associated with waist circumference and NC. In
contrast, triglycerides, hs-CRP, insulin and HOMA-IR
were significantly associated with all the anthropometric indices, whereas systolic and diastolic blood pressures were associated with all the anthropometric
indices, except WHR.
Neck circumference cut-off points to identify MetS, insulin
resistance and low-grade systemic inflammation according
to gender
The cut-off points and respective sensitivity and specificity
values, the AUCs and the Youden’s index of NC for the
identification of MetS, insulin resistance and low-grade
Table 2 Correlations between cardiometabolic risk factors and anthropometric measurements according to gender
Z-score BMI
Total
Girls
Z-score WC
Boys
Total
Waist to hip ratio
Girls
Boys
Total
Girls
Waist to height ratio
Boys
Total
Girls
Boys
FPG (mg/dl)
0.08
0.10
0.06
0.10*
0.13*
0.08
-0.04
-0.08
-0.07
0.02
0.01
0.02
HDL-C (mg/dl)
-0.12*
-0.09
-0.15*
-0.16**
-0.10
-0.21**
0.02
0.01
-0.02
-0.06
-0.08
-0.07
TG (mg/dl)
0.16**
0.15*
0.17*
0.23**
0.19*
0.25**
0.10*
0.12*
0.20**
0.15**
0.15*
0.19**
SBP (mmHg)
0.29**
0.28**
0.30**
0.31**
0.31**
0.33**
0.08*
0.01
0.04
0.21**
0.17*
0.21**
DBP (mmHg)
0.35**
0.36**
0.33**
0.35**
0.33**
0.37**
0.06
-0.03
0.17*
0.29**
0.26**
0.33**
hs-CRP (mg/dl)
0.15*
0.19*
0.12*
0.15**
0.21**
0.09
0.04
0.12*
0.01
0.14**
0.22**
0.08
Insulin (Ul/ml)
0.27**
0.28**
0.27**
0.29**
0.23**
0.33**
0.06
0.06
0.23**
0.24**
0.21**
0.34**
HOMA-IR
0.27**
0.27**
0.26**
0.29**
0.24**
0.33**
0.05
0.03
0.21**
0.24**
0.20*
0.33**
%BF – BIA
%BF - Skinfold
Neck Circumference
Total
Girls
Boys
Total
Girls
Boys
Total
Girls
Boys
FPG (mg/dl)
0.01
0.09
-0.03
0.06
0.10
0.04
0.20**
0.19**
0.19**
HDL-C (mg/dl)
-0.09*
-0.12*
-0.02
-0.12*
-0.11*
-0.13*
-0.19**
-0.12*
-0.29**
TG (mg/dl)
0.18**
0.13*
0.17*
0.15**
0.09
0.19**
0.11*
0.10
0.18*
SBP (mg/dl)
0.17**
0.26**
0.20**
0.24**
0.25**
0.23**
0.39**
0.34**
0.42**
DBP (mg/dl)
0.33**
0.39**
0.32**
0.35**
0.41**
0.30**
0.29**
0.29**
0.31**
hs-CRP (mg/dl)
0.11*
0.18*
0.05
0.16**
0.18*
0.15*
0.15**
0.17*
0.15*
Insulin (Ul/ml)
0.30**
0.24**
0.29**
0.28**
0.21**
0.33**
0.19**
0.22**
0.25**
HOMA-IR
0.28**
0.24**
0.27**
0.28**
0.23**
0.32**
0.21**
0.23**
0.27**
*Spearman’s correlation coefficient p < 0.05. **Spearman’s correlation coefficient p < 0.001
BMI body mass index, WC waist circumference, %BF-BIA body fat percentage – bioelectrical impedance analysis, %BF-Skinfold body fat percentage – skinfolds, FPG
fasting plasma glucose, HDL-C high-density lipoprotein cholesterol, TG triglycerides, SBP systolic blood pressure, DBP diastolic blood pressure, hs-CRP high sensitivity
C-reactive protein
Gomez-Arbelaez et al. BMC Pediatrics (2016) 16:31
Page 6 of 9
Table 3 Multiple linear regression analysis, using each cardiometabolic risk factor as the dependent variable
Dependent variable
Independent factor
Coef. ± SE
P Value
Dependent variable
Independent factor
FPG (mg/dl)
BMI (kg/m2)
0.193 ± 0.149
0.194
DBP (mmHg)
BMI (kg/m2)
0.849 ± 0.106
<0.001
WC (cm)
0.100 ± 0.056
0.075
WC (cm)
0.346 ± 0.039
<0.001
WHR
-12.777 ± 6.791
0.060
WHR
7.498 ± 5.024
0.136
WHtR
2.198 ± 8.620
0.799
WHtR
46.847 ± 6.094
<0.001
%BF-BIA
0.063 ± 0.075
0.399
%BF-BIA
0.500 ± 0.051
<0.001
%BF-Skinfold
0.039 ± 0.045
0.393
%BF-Skinfold
0.283 ± 0.031
<0.001
NC (cm)
1.305 ± 0.173
<0.001
BMI (kg/m2)
0.132 ± 0.020
<0.001
HDL-C (mg/dl)
TG (mg/dl)
SBP (mmHg)
NC (cm)
0.815 ± 0.244
0.001
BMI (kg/m2)
-0.279 ± 0.236
0.237
hs-CRP (mg/dl)
Coef. ± SE
P Value
WC (cm)
-0.237 ± 0.088
0.008
WC (cm)
0.043 ± 0.007
<0.001
WHR
-6.135 ± 10.745
0.568
WHR
2.459 ± 0.936
0.009
WHtR
-21.145 ± 13.584
0.120
WHtR
7.225 ± 1.177
<0.001
%BF-BIA
-0.149 ± 0.116
0.203
%BF-BIA
0.061 ± 0.010
<0.001
%BF-Skinfold
-0.133 ± 0.072
0.067
%BF-Skinfold
0.037 ± 0.006
<0.001
NC (cm)
-1.333 ± 0.384
0.001
NC (cm)
0.133 ± 0.034
<0.001
BMI (kg/m2)
2.149 ± 0.621
0.001
BMI (kg/m2)
0.245 ± 0.031
<0.001
WC (cm)
1.253 ± 0.229
<0.001
WC (cm)
0.108 ± 0.011
<0.001
WHR
104.268 ± 28.023
<0.001
WHR
5.850 ± 1.448
<0.001
WHtR
155.901 ± 35.351
<0.001
WHtR
14.963 ± 1.785
<0.001
%BF-BIA
1.260 ± 0.313
<0.001
%BF-BIA
0.130 ± 0.015
<0.001
%BF-Skinfold
0.754 ± 0.190
<0.001
%BF-Skinfold
0.086 ± 0.009
<0.001
NC (cm)
0.362 ± 0.051
<0.001
BMI (kg/m2)
0.055 ± 0.007
<0.001
NC (cm)
3.887 ± 1.014
<0.001
BMI (kg/m2)
0.705 ± 0.129
<0.001
Insulin (Ul/ml)
HOMA-IR
WC (cm)
0.311 ± 0.048
<0.001
WC (cm)
0.024 ± 0.002
<0.001
WHR
7.001 ± 6.020
0.245
WHR
1.192 ± 0.330
<0.001
WHtR
34.576 ± 7.503
<0.001
WHtR
3.306 ± 0.407
<0.001
%BF-BIA
0.362 ± 0.064
<0.001
%BF-BIA
0.029 ± 0.003
<0.001
%BF-Skinfold
0.206 ± 0.039
<0.001
%BF-Skinfold
0.018 ± 0.002
<0.001
NC (cm)
1.719 ± 0.205
<0.001
NC (cm)
0.085 ± 0.011
<0.001
After controlling for age, gender and Tanner stage
FPG fasting plasma glucose, HDL-C high-density lipoprotein cholesterol, TG triglycerides, SBP systolic blood pressure, DBP diastolic blood pressure, hs-CRP high sensitivity
C-reactive protein, BMI body mass index, WC waist circumference, WHR waist-to-hip ratio, WHtR waist-to-height ratio, %BF-BIA body fat percentage – bioelectrical impedance
analysis, %BF-Skinfold body fat percentage – skinfolds, NC neck circumference
systemic inflammation according to gender are shown in
Table 4. NC cut-off values for MetS were calculated to be
28.5 cm (95 % CI, 0.68 – 0.78) in girls and 29 cm (95 %
CI, 0.68 – 0.78) in boys, 29.3 cm (95 % CI, 0.49 – 0.60) in
girls and 29.2 (95 % CI, 0.47 – 0.58) in boys for detecting
low-grade systemic inflammation, and 29 cm (95 % CI,
0.51 – 0.62) in girls and 30 cm (95 % CI, 0.49 – 0.59) in
boys for identifying insulin resistance (Table 5).
Discussion
We found that NC was associated with all the assessed
cardio-metabolic risk factors similar to that observed for
waist circumference, which was associated with all the
cardio-metabolic risk factors except fasting plasma glucose.
The association for HDL-C was more robust for NC than
for waist circumference. The other anthropometric indices
were not associated neither with fasting plasma glucose nor
HDL-C, and WHR was also not associated with systolic
and diastolic blood pressure. Interestingly, similar NC cutoff points for identifying children at elevated risk of MetS,
insulin resistance and low-grade systemic inflammation
were obtained by gender (28.5 to 29.3 cm in girls and 29 to
30 cm in boys), making it a simple marker of metabolic
risk. Therefore, NC is a measure that potentially might be
implemented in situations where equipment availability or
cultural issues limit the use of the traditional anthropometric measures.
Moreover, it should be noted that in cases wherein significant associations were found, most of the anthropometric measures were similar to each other in the strength of
Gomez-Arbelaez et al. BMC Pediatrics (2016) 16:31
Page 7 of 9
Table 4 Neck circumference cut-offs points to identify metabolic syndrome, low-grade systemic inflammation and insulin resistance
in study sample according to gender
Cutoffs (cm)
Sensitivity (%)
Specificity (%)
AUC (IC 95 %)
Youden’s index
Girls
28.5
87.50
53.61
0.73 (0.68 - 0.78)
0.41
Boys
29
100
45.37
0.74 (0.68 - 0.78)
0.45
Metabolic Syndrome
Low-grade systemic inflammation
Girls
29.3
42.02
69.15
0.55 (0.49 - 0.60)
0.11
Boys
29.2
54.62
51.63
0.53 (0.47 - 0.58)
0.06
Girls
29
50.00
62.35
0.57 (0.51 - 0.62)
0.12
Boys
30
52.54
61.19
0.54 (0.49 - 0.59)
0.13
Insulin resistance
Receiver operating characteristic (ROC) analyzes. Youden’s index = Sensitivity + Specificity – 1
these associations. Thus, our results confirm the value of a
complete anthropometric assessment in the identification
of cardiovascular and metabolic risk factors in children.
Adiposity is widely accepted to play a key role in the
pathogenesis of cardiovascular and metabolic diseases in
children [3–5, 32]. So, it is important the identification
of overweight children with cardio-metabolic risk factors
in whom counseling and treatment must be provided in
a timely manner. The determination of biochemical variables is costly, making impractical its use as a screening
tool, particularly in low-middle income countries with
lower resources. Thus, the present findings showing that
NC, which only requires a tape measure, is effective,
simple, easy-to-use and inexpensive anthropometric
measurement to identify children and adolescents with
cardio-metabolic risk constitute an important contribution from a public health perspective.
However, previous studies [20, 21] have assessed the
association between NC and cardio-metabolic risk in
children, our study has the strength of having the largest
Table 5 Advantages and limitations in pediatric population of
anthropometrics measurements to identify metabolic alterations
FPG HDL-C TG
SPB/DPB hs-CRP Insulin HOMA-IR
BMI
-
+
++ ++
++
++
++
WC
+
+
++ ++
++
++
++
WHR
-
-
++ +
+
+
+
WHtR
-
-
++ ++
+
++
++
%BF-BIA
-
+
++ ++
+
++
++
%BF-Skinfold -
++
+
++
++
++
++
NC
++
+
++
++
++
++
++
(-) Not correlation; (+) Correlation in girls or boys; (++) Correlation in both girls
and boys
FPG fasting plasma glucose, HDL-C high-density lipoprotein cholesterol, TG
triglycerides, SBP systolic blood pressure, DBP diastolic blood pressure, hs-CRP
high sensitivity C-reactive protein, BMI body mass index, WC waist circumference,
WHR waist-to-hip ratio, WHtR waist-to-height ratio, %BF-BIA body fat percentage –
bioelectrical impedance analysis, %BF-Skinfold body fat percentage – skinfolds,
NC neck circumference
pediatric population sample to date. Moreover, the results showed for the first time, an association between
high NC and abnormal values of fasting plasma glucose
and low-grade systemic inflammation. These results support the proposal of an increased cardio-metabolic risk
in our population at lower levels of adiposity [33–35].
Although NC is an emerging marker of cardio-metabolic
risk in children, it has been demonstrated as a good predictor of cardiovascular disease in adults with different conditions such as MetS, obstructive sleep apnea and fatty liver
disease [15, 19, 36–39].
BMI has been the accepted standard measure of overweight and obesity for children two years of age and older
[40]. However, some studies have suggested that BMI is
not a good indicator of cardio-metabolic risk [7, 8, 41]. In
our current study BMI was associated with most of the
cardio-metabolic risk factors assessed, confirming that
despite its apparent limitations, in children BMI is non inferior to measures that assess body composition and differentiate fat and lean mass, such as BIA or skinfolds [42].
We found that associations between BIA and skinfolds
and cardio-metabolic risk factors were similar to that of
the anthropometric indices; but, in contrast to NC, neither
of these measures was associated with fasting plasma glucose and HDL-C. Moreover, it is notable that despite
identical statistical associations with cardio-metabolic risk
of these two field measures of body composition, the
mean values were lower for BIA in boys and girls and
%BF-BIA was significantly higher in girls than boys, while
the reverse was the case for %BF-Skinfolds. Therefore, it is
not clear which of these two estimates of %BF is more
accurate or whether it is appropriate to calculate them
using predictive equations validated in different populations.
Fat distribution is also recognized as an important determinant of metabolic risk [43] and those anthropometric measures such as waist circumference, WHR and
WHtR are good indicators of visceral adipose tissue and
therefore good predictors of cardiovascular risk [44–46].
Gomez-Arbelaez et al. BMC Pediatrics (2016) 16:31
In the present study, all these anthropometric indexes
showed acceptable correlations with the cardio-metabolic
risk factors, although none were superior to NC. Hence,
in agreement with previous studies, we can also suggest
the use of waist circumference, WHR and WHtR as an
optional adiposity indexes in relation to the cardiovascular
and metabolic health risk.
Our study should be interpreted in light of its limitations.
First, is a cross-sectional study; therefore, the association
with cardiovascular and metabolic disease outcomes could
not be established. Second, as pubertal growth and development is characterized by changes in metabolic traits that
characterize the MetS [47], we suggest further studies with
larger sample sizes, in which the cut-off points would be
defined by pubertal development. Third, we defined the
cardio-metabolic risk using a modified NHANES definition
of MetS, which we considered as the most applicable in the
clinical practice based on the simplicity of its diagnostic criteria, however it should be mentioned that the appropriate
risk factor cut-offs for children remain controversial, and
therefore further studies to define thresholds for abnormalities of the metabolic components should be conducted.
Fourth, our study was specifically conducted in a pediatric
Latin American population. It has been proposed that fetal
programming associated to maternal undernutrition, which
prevalence still is high in Latin America, could affect the
body composition and the utility of different anthropometrics measurements [35]. Hence, we believe that additional
studies should be performed testing whether the proposed
cut-offs points for NC are truly applicable in other populations and regions of the world.
Conclusions
We evaluated the association between several cardiometabolic risk factors and NC, a novel marker of risk,
and compared this with classic anthropometric measures
and indexes such as BMI and WHR and with field measures of body composition. While all of the anthropometric measures and indexes we assessed showed some
associations with cardio-metabolic risk factors, including
insulin resistance and low-grade systemic inflammation,
we found that NC was the most consistent and robust
marker. Further longitudinal studies in representative
populations are required to confirm these findings and
to establish NC as a basic criterion in the diagnosis of
cardio-metabolic risk factors.
Competing interests
The ACFIES study is partially funded by the MAPFRE Foundation and the
mayor of Bucaramanga, Colombia. The authors declare that they have no
competing interests.
Authors’ contributions
PLJ, DGA and DDC conceived the project. DGA, DDC, CLL and SSC carried out
experiments. DGA and PAC analyzed data. All authors were involved in writing
the paper and had final approval of the submitted and published versions.
Page 8 of 9
Acknowledgements
The authors would like to thank principals and teachers of the school
“INEM - Custodio Garcia Rovira”, and schools of medicine, physiotherapy,
nursing and bacteriology at the University of Santander - UDES for their
assistance with the study.
Author details
Dirección de Investigaciones, Fundación Oftalmológica de Santander FOSCAL, Floridablanca, Colombia. 2Instituto MASIRA, Facultad de la Ciencias
de la Salud, Universidad de Santander - UDES, Bucaramanga, Colombia.
3
Departamento de Endocrinología, Escuela de Medicina, Universidad de
Santiago de Compostela, Santiago de Compostela, España. 4Escuela de
Medicina, Universidad Autónoma de Bucaramanga – UNAB, Bucaramanga,
Colombia. 5Fundación Oftalmológica de Santander - FOSCAL, Calle 155A N.
23–09, El Bosque, Floridablanca, Santander, Colombia.
1
Received: 3 July 2015 Accepted: 29 February 2016
References
1. Wang Y, Lobstein T. Worldwide trends in childhood overweight and obesity.
Int J Pediatr Obes. 2006;1:11–25.
2. Short KR, Blackett PR, Gardner AW, Copeland KC. Vascular health in
children and adolescents: effects of obesity and diabetes. Vasc Health
Risk Manag. 2009;5:973–90.
3. Bridger T. Childhood obesity and cardiovascular disease. Paediatr Child
Health. 2009;14:177–82.
4. Burke V. Obesity in childhood and cardiovascular risk. Clin Exp Pharmacol
Physiol. 2006;33:831–7.
5. Biro FM, Wien M. Childhood obesity and adult morbidities. Am J Clin Nutr.
2010;91:1499–505.
6. World Health Organization Expert Committee. Physical status, the use
and interpretation of anthropometry. Report of a WHO Expert
Committee. World Health Organ Tech Rep Ser. 1995;854:1–452.
7. Maynard LM, Wisemandle W, Roche AF, Chumlea WC, Guo SS, Siervogel RM.
Childhood body composition in relation to body mass index. Pediatrics.
2001;107:344–50.
8. Freedman DS, Wang J, Maynard LM, Thornton JC, Mei Z, Pierson RN, et al.
Relation of BMI to fat and fat-free mass among children and adolescents.
Int J Obes (Lond). 2005;29:1–8.
9. Janssen I, Katzmarzyk PT, Ross R. Waist circumference and not body mass
index explains obesity-related health risk. Am J Clin Nutr. 2004;79:379–84.
10. Kahn HS, Imperatore G, Cheng YJ. A population-based comparison of
BMI percentiles and waist-to-height ratio for identifying cardiovascular
risk in youth. J Pediatr. 2005;146:482–8.
11. Goodpaster BH, Krishnaswami S, Harris TB, Katsiaras A, Kritchevsky SB,
Simonsick EM, et al. Obesity, regional body fat distribution, and the metabolic
syndrome in older men and women. Arch Intern Med. 2005;165:777–83.
12. Pou KM, Massaro JM, Hoffmann U, Vasan RS, Maurovich-Horvat P,
Larson MG, et al. Visceral and subcutaneous adipose tissue volumes are
cross-sectionally related to markers of inflammation and oxidative
stress: the Framingham Heart Study. Circulation. 2007;116:1234–41.
13. Neeland IJ, Ayers CR, Rohatgi AK, Turer AT, Berry JD, Das SR, et al.
Associations of visceral and abdominal subcutaneous adipose tissue with
markers of cardiac and metabolic risk in obese adults. Obesity (Silver
Spring). 2013;21:E439–47.
14. Nielsen S, Guo Z, Johnson CM, Hensrud DD, Jensen MD. Splanchnic lipolysis
in human obesity. J Clin Invest. 2004;113:1582–8.
15. Preis SR, Massaro JM, Hoffmann U, D'Agostino Sr RB, Levy D, Robins SJ, et al.
Neck circumference as a novel measure of cardiometabolic risk: the
Framingham Heart study. J Clin Endocrinol Metab. 2010;95:3701–10.
16. Hatipoglu N, Mazicioglu MM, Kurtoglu S, Kendirci M. Neck circumference: an
additional tool of screening overweight and obesity in childhood. Eur J
Pediatr. 2010;169:733–9.
17. Lou DH, Yin FZ, Wang R, Ma CM, Liu XL, Lu Q. Neck circumference is an
accurate and simple index for evaluating overweight and obesity in Han
children. Ann Hum Biol. 2012;39:161–5.
18. Nafiu OO, Burke C, Lee J, Voepel-Lewis T, Malviya S, Tremper KK.
Neck circumference as a screening measure for identifying children with
high body mass index. Pediatrics. 2010;126:e306–310.
Gomez-Arbelaez et al. BMC Pediatrics (2016) 16:31
19. Stabe C, Vasques AC, Lima MM, Tambascia MA, Pareja JC, Yamanaka A, et al.
Neck circumference as a simple tool for identifying the metabolic syndrome
and insulin resistance: results from the Brazilian Metabolic Syndrome Study.
Clin Endocrinol (Oxf). 2013;78:874–81.
20. Androutsos O, Grammatikaki E, Moschonis G, Roma-Giannikou E, Chrousos
GP, Manios Y, et al. Neck circumference: a useful screening tool of
cardiovascular risk in children. Pediatr Obes. 2012;7:187–95.
21. Kurtoglu S, Hatipoglu N, Mazicioglu MM, Kondolot M. Neck circumference
as a novel parameter to determine metabolic risk factors in obese children.
Eur J Clin Invest. 2012;42:623–30.
22. Barlow SE, Expert Committee. Expert committee recommendations
regarding the prevention, assessment, and treatment of child and
adolescent overweight and obesity: summary report. Pediatrics. 2007;120
Suppl 4:S164–92.
23. Lohman TG, Roche AF, Martorell R. Anthropometric Standardization
Reference Manual; Champaign, IL: Human Kinetics Book 1991.
24. Slaughter MH, Lohman TG, Boileau RA, Horswill CA, Stillman RJ, Van Loan
MD, et al. Skinfold equations for estimation of body fatness in children and
youth. Hum Biol. 1988;60:709–23.
25. Tanner JM, Whitehouse RH. Clinical longitudinal standards for height,
weight, height velocity, weight velocity, and stages of puberty. Arch Dis
Child. 1976;51:170–9.
26. Matthews DR, Hosker JP, Rudenski AS, Naylor BA, Treacher DF, Turner RC.
Homeostasis model assessment: insulin resistance and beta-cell function
from fasting plasma glucose and insulin concentrations in man.
Diabetologia. 1985;28:412–9.
27. Cook S, Weitzman M, Auinger P, Nguyen M, Dietz WH. Prevalence of a
metabolic syndrome phenotype in adolescents: findings from the third
National Health and Nutrition Examination Survey, 1988-1994. Arch Pediatr
Adolesc Med. 2003;157:821–7.
28. Burrows R, Correa-Burrows P, Reyes M, Blanco E, Albala C, Gahagan S.
Healthy Chilean adolescents with HOMA-IR ≥2 · 6 have increased
cardiometabolic risk: association with genetic, biological, and environmental
factors. J Diabetes Res. 2015;2015:783296.
29. Youden WJ. Index for rating diagnostic tests. Cancer. 1950;3:32–5.
30. Cohen DD, Gómez-Arbeláez D, Camacho PA, Pinzon S, Hormiga C, TrejosSuarez J, et al. Low muscle strength is associated with metabolic risk factors
in Colombian children: the ACFIES study. PLoS One. 2014;9:e93150.
31. Gómez-Arbeláez D, Camacho PA, Cohen DD, Rincón-Romero K, AlvaradoJurado L, Pinzón S, et al. Higher household income and the availability of
electronic devices and transport at home are associated with higher waist
circumference in Colombian children: the ACFIES study. Int J Environ Res
Public Health. 2014;11:1834–43.
32. Dietz WH, Robinson TN. Clinical practice. Overweight children and adolescents.
N Engl J Med. 2005;352:2100–09.
33. López-Jaramillo P, Herrera E, Garcia RG, Camacho PA, Castillo VR. Interrelationships between body mass index, C-reactive protein and blood pressure in
a Hispanic pediatric population. Am J Hypertens. 2008;21:527–32.
34. López-Jaramillo P, Gómez-Arbeláez D, López-López J, López-López C,
Martínez-Ortega J, Gómez-Rodríguez A, et al. The role of leptin/adiponectin
ratio in metabolic syndrome and diabetes. Horm Mol Biol Clin Investig.
2014;18:37–45.
35. Lopez-Jaramillo P, Gomez-Arbelaez D, Sotomayor-Rubio A, Mantilla-Garcia D,
Lopez-Lopez J. Maternal undernutrition and cardiometabolic disease: a Latin
American perspective. BMC Med. 2015;13:41.
36. Zhou JY, Ge H, Zhu MF, Wang LJ, Chen L, Tan YZ, et al. Neck circumference
as an independent predictive contributor to cardio-metabolic syndrome.
Cardiovasc Diabetol. 2013;12:76.
37. Lim YH, Choi J, Kim KR, Shin J, Hwang KG, Ryu S, et al. Sex-specific
characteristics of anthropometry in patients with obstructive sleep apnea:
neck circumference and waist-hip ratio. Ann Otol Rhinol Laryngol. 2014;123:
517–23.
38. Zen V, Fuchs FD, Wainstein MV, Gonçalves SC, Biavatti K, Riedner CE, et al.
Neck circumference and central obesity are independent predictors of
coronary artery disease in patients undergoing coronary angiography.
Am J Cardiovasc Dis. 2012;2:323–30.
39. Huang BX, Zhu MF, Wu T, Zhou JY, Liu Y, Chen XL, et al. Neck Circumference,
along with other anthropometric indices, has an independent and additional
contribution in predicting fatty liver disease. PLoS One. 2015;10:e0118071.
40. Deurenberg P, Weststrate JA, Seidell JC. Body mass index as a measure of body
fatness: age- and sex-specific prediction formulas. Br J Nutr. 1991;65:105–14.
Page 9 of 9
41. Melmer A, Lamina C, Tschoner A, Ress C, Kaser S, Laimer M, et al.
Body adiposity index and other indexes of body composition in the SAPHIR
study: association with cardiovascular risk factors. Obesity (Silver Spring).
2013;21:775–81.
42. Nagaya T, Yoshida H, Takahashi H, Matsuda Y, Kawai M. Body mass index
(weight/height2) or percentage body fat by bioelectrical impedance
analysis: which variable better reflects serum lipid profile? Int J Obes Relat
Metab Disord. 1999;23:771–4.
43. Sjöström CD, Håkangård AC, Lissner L, Sjöström L. Body compartment and
subcutaneous adipose tissue distribution–risk factor patterns in obese
subjects. Obes Res. 1995;3:9–22.
44. Pouliot MC, Després JP, Lemieux S, Moorjani S, Bouchard C, Tremblay A, et al.
Waist circumference and abdominal sagittal diameter: best simple
anthropometric indexes of abdominal visceral adipose tissue accumulation and
related cardiovascular risk in men and women. Am J Cardiol. 1994;73:460–8.
45. Müller MJ, Lagerpusch M, Enderle J, Schautz B, Heller M, Bosy-Westphal A.
Beyond the body mass index: tracking body composition in the pathogenesis
of obesity and the metabolic syndrome. Obes Rev. 2012;13:6–13.
46. Boeke CE, Oken E, Kleinman KP, Rifas-Shiman SL, Taveras EM, Gillman MW.
Correlations among adiposity measures in school-aged children. BMC
Pediatr. 2013;13:99.
47. Goodman E, Daniels SR, Meigs JB, Dolan LM. Instability in the diagnosis of
metabolic syndrome in adolescents. Circulation. 2007;115:2316–22.
Submit your next manuscript to BioMed Central
and we will help you at every step:
• We accept pre-submission inquiries
• Our selector tool helps you to find the most relevant journal
• We provide round the clock customer support
• Convenient online submission
• Thorough peer review
• Inclusion in PubMed and all major indexing services
• Maximum visibility for your research
Submit your manuscript at
www.biomedcentral.com/submit