The Linked CENTURY Study: Linking three decades of clinical and public health data to examine disparities in childhood obesity
Bạn đang xem bản rút gọn của tài liệu. Xem và tải ngay bản đầy đủ của tài liệu tại đây (585.84 KB, 11 trang )
Hawkins et al. BMC Pediatrics (2016) 16:32
DOI 10.1186/s12887-016-0567-0
RESEARCH ARTICLE
Open Access
The Linked CENTURY Study: linking three
decades of clinical and public health data
to examine disparities in childhood obesity
Summer Sherburne Hawkins1* , Matthew W. Gillman2, Sheryl L. Rifas-Shiman2, Ken P. Kleinman2,
Megan Mariotti3 and Elsie M. Taveras4,5
Abstract
Background: Despite the need to identify the causes of disparities in childhood obesity, the existing epidemiologic
studies of early life risk factors have several limitations. We report on the construction of the Linked CENTURY
database, incorporating CENTURY (Collecting Electronic Nutrition Trajectory Data Using Records of Youth) Study
data with birth certificates; and discuss the potential implications of combining clinical and public health data
sources in examining the etiology of disparities in childhood obesity.
Methods: We linked the existing CENTURY Study, a database of 269,959 singleton children from birth to age 18 years
with measured heights and weights, with each child’s Massachusetts birth certificate, which captures information on
their mothers’ pregnancy history and detailed socio-demographic information of both mothers and fathers.
Results: Overall, 74.2 % were matched, resulting in 200,343 children in the Linked CENTURY Study with 1,580,597 well
child visits. Among this cohort, 94.0 % (188,334) of children have some father information available on the
birth certificate and 60.9 % (121,917) of children have at least one other sibling in the dataset.
Using maternal race/ethnicity from the birth certificate as an indicator of children’s race/ethnicity, 75.7 % of
children were white, 11.6 % black, 4.6 % Hispanic, and 5.7 % Asian. Based on socio-demographic information
from the birth certificate, 20.0 % of mothers were non-US born, 5.9 % smoked during pregnancy, 76.3 %
initiated breastfeeding, and 11.0 % of mothers had their delivery paid for by public health insurance. Using
clinical data from the CENTURY Study, 22.7 % of children had a weight-for-length ≥ 95th percentile between 1
and 24 months and 12.0 % of children had a body mass index ≥ 95th percentile at ages 5 and 17 years.
Conclusions: By linking routinely-collected data sources, it is possible to address research questions that
could not be answered with either source alone. Linkage between a clinical database and each child’s birth
certificate has created a unique dataset with nearly complete racial/ethnic and socio-demographic information
from both parents, which has the potential to examine the etiology of racial/ethnic and socioeconomic disparities in
childhood obesity.
Keywords: Birth certificates, Electronic health records, Health status disparities, Medical record linkage, Pediatric obesity
* Correspondence:
1
Boston College, School of Social Work, McGuinn Hall, 140 Commonwealth
Avenue, Chestnut Hill, MA, USA
Full list of author information is available at the end of the article
© 2016 Hawkins et al. Open Access This article is distributed under the terms of the Creative Commons Attribution 4.0
International License ( which permits unrestricted use, distribution, and
reproduction in any medium, provided you give appropriate credit to the original author(s) and the source, provide a link to
the Creative Commons license, and indicate if changes were made. The Creative Commons Public Domain Dedication waiver
( applies to the data made available in this article, unless otherwise stated.
Hawkins et al. BMC Pediatrics (2016) 16:32
Background
Despite recent evidence that childhood obesity in the US
may have plateaued or even decreased [1, 2], progress
has not been universal. From 2008 through 2011, the
prevalence of obesity in low-income children age 2–4
years decreased in 19 of 43 states and territories, but
remained high overall with a prevalence of 14 % [2]. According to nationally-representative data, obesity rates
have also decreased among 2- to 5-year-olds, resulting
in a prevalence of 8 % [1]. However, racial/ethnic disparities persist. In 2011–2012, 4 % of preschool-age white
children were obese, compared to 11 % of black children, and 17 % of Hispanic children [1]. In contrast,
obesity rates among older children have remained stable
over the past decade at 18–21 % and ethnic minority
children continue to be at higher risk [1]. In 2011–2012,
13 % of 6–11-year-old white children were obese, compared to 24 % of black children, and 26 % of Hispanic
children [1]. Examining the causes of racial/ethnic and
socioeconomic disparities in childhood obesity could
help inform preventive interventions among those populations at highest risk.
Life course epidemiology proposes that factors during
peri- and post-natal periods may influence the development of obesity from early life through adulthood [3, 4].
Observational studies have shown that maternal smoking during pregnancy [5–7], excessive gestational weight
gain [8–10], gestational diabetes mellitus (GDM) [11],
and accelerated infant weight gain [6, 12, 13] are associated with higher risk for childhood obesity. Some, but
not all studies, also suggest that breastfeeding is protective [14–17]. More recently, cesarean delivery [18, 19]
and antibiotic exposure in the first year of life [20, 21]
have been associated with childhood obesity. At a more
macro-level, aspects of the built and socioeconomic environment, such as access to food, opportunities for
physical activity, and neighborhood deprivation [22–28],
have been associated with childhood obesity and may
explain racial/ethnic differences in obesity [29–31].
However, the existing epidemiologic studies of early
life risk factors have several limitations. Foremost, the
majority of research has been from observational studies
of singletons, which are subject to confounding by genetic and shared environmental and familial factors.
Given that randomized trials are often neither ethical
nor feasible, alternative study methodologies, such as
sibling pair designs [32], can reduce confounding and
thus provide more valid inferences. Differences in outcomes between siblings can be compared when they
have different exposures in utero or after birth, such as
nicotine exposure if their mother smoked during one
pregnancy but not the other. Since this methodology
allows for partial control of the pre- and post-natal environment as well as shared genes [32, 33], it produces a
Page 2 of 11
less confounded estimate. If confounding is present,
sibling-pair effect sizes would be smaller than those in
an overall (between-family) analysis of the same data
[33]. However, to date, there have been only a few sibling pair studies of any peri- or post-natal risk factors for
childhood obesity [34–44]. Thus, whether many of the
known risk factors are causally related to obesity remains unresolved.
In the US there are limited data sources that have information on peri- and post-natal risk factors, measured
height and weight across childhood, racial/ethnic and
socioeconomic diversity, and geocodes. Birth cohort studies [45, 46] have been invaluable resources because they
collect detailed information on a range of exposure and
outcome measures, but they often include a limited number of subjects and power to test interactions between
race/ethnicity and measures of social class. Cohort studies
also generally enroll only a single child from each family
and, consequently, have limited sibling pairs.
Data linkage is a cost-effective approach to adding further value to routinely-collected data. State laws require
that birth certificates be completed for all births and detailed information is collected on peri- and post-natal risk
factors; however, health outcomes after discharge are not
available. In contrast, clinical databases created from electronic health records contain child health outcomes, but
information is often missing on socio-demographics and
peri- or post-natal information. Linking these two sources
of data can marry the advantages of each to overcome
some of the noted limitations of previous study designs
and help address the early origins of disparities in childhood obesity.
This paper first reports on the construction of the
Linked CENTURY Study through data linkage between
the CENTURY (Collecting Electronic Nutrition Trajectory
Data Using e-Records of Youth) Study, a clinical database
with measured height and weight data [47–49], with each
child’s Massachusetts birth certificate; and second, discusses the potential clinical, epidemiologic, and public
health implications of the Linked CENTURY Study in
examining the etiology of disparities in childhood obesity.
Methods
CENTURY study
With funding from the Centers for Disease Control and
Prevention in 1996, 2001, and 2008, we created the CENTURY Study, a database of children ages 0 to <18.0 years
who were seen for a well child visit at any of the 14 health
centers of Harvard Vanguard Medical Associates (HVMA)
and other smaller health centers in eastern Massachusetts
(currently Atrius Health) from 1980 through 2008.
Originally a staff model health maintenance organization,
HVMA evolved into a group practice in 1998. Its patients
are predominantly employed and insured; children with
Hawkins et al. BMC Pediatrics (2016) 16:32
Medicaid insurance were accepted from 1987 onwards.
Since HVMA’s inception in 1969, it has used a completely
electronic health record system for all medical encounters.
To generate the CENTURY database, we obtained demographic and growth data from all well child visits from
1980 through 2008, for those children born from 1969
onwards. The definition of a well child visit was the use of
an appropriate utilization code, the combination of measurement of weight and length or height, or administration
of a routine immunization. The total sample size of the
database is 306,147 children from birth to age 18 years
with 2,110,014 well child visits from 1980 through 2008.
Each child in the database was linked to his/her mother
using insurance information and siblings were identified
through a common family identifier. It is, therefore, possible that siblings may or may not be biological.
Page 3 of 11
length percentiles based on the 2000 CDC growth chart
for children < 24.0 months [53].
Blood pressure Medical assistants routinely take children’s blood pressure at well visits starting at age 3 according to the written protocol of the HVMA health
centers. The protocol, which is based on recommendations from the American Heart Association [54], instructs
patients to sit for five minutes before measuring blood
pressure. It includes using a cuff that fits appropriately.
Blood pressure is measured using automated or manual
instruments, depending on what is available at each site.
We used clinical blood pressure readings to calculate
age-, sex- and height-specific systolic blood pressure and
diastolic blood pressure percentiles according to National
Health Lung and Blood Institute guidelines [55].
Measures from well child visits
Birth weight Birth weight was extracted using both
medical chart abstraction and text-search algorithms.
Text-search algorithms use computational models that
map clinical text to extract contextual use of words and
phrases. Similar models have been used in electronic
health records to identify adverse events of clinical care
[50] and validate clinical diagnoses [51]. Birth weight is
available in the CENTURY database for approximately
32 % of children.
Weights and lengths Medical assistants measured
length or height and weight according to the written
protocol of the HVMA health centers. Weight was measured to the nearest 0.25 lb on a pediatric scale. Length
in children < 24 months was measured recumbent. For
children older than 36 months, height was generally
measured standing. Medical assistants used a paper-andpencil technique for children < 24 months rather than
the recommended recumbent measuring board. In a
measurement validation study conducted at one of the
participating health centers, we found that this paperand-pencil method systematically overestimated children’s length compared with the standard method. Thus,
in all analyses of the CENTURY data, we correct recumbent length for children younger than 24 months using a
regression correction factor from the validation study to
adjust for this systematic overestimation [52].
We used measured height and weight to calculate ageand sex-specific weight-for-length (WFL) and body mass
index (BMI) percentiles based on the Centers for Disease
Control and Prevention (CDC) growth charts from
2000. The CDC defines obesity in children age 2–19
years as a BMI at or above the 95th percentile for age
and sex, with overweight between the 85th and 95th percentiles [53]. We used age- and sex-specific weight-for-
Socio-demographic information From the clinical record, we obtained the child’s gestational age, sex, age at
the time of the visit, and type of medical insurance.
Parental or clinician report of child’s race/ethnicity was
recorded using the categories white, black, Hispanic,
American Indian/Alaska Native, Asian, and other.
Due to the challenge of linking children from multiple
birth pregnancies (i.e., twins, triplets) with their birth
certificate, we retained 269,959 singleton children. Sample characteristics of the singleton children from the original CENTURY Study are shown in Table 1. All of the
children had weight and height or length recorded at
least once. However, information is missing on child’s
race/ethnicity for 36 % of participants and medical insurance status for 66 % of participants.
Massachusetts Department of Public Health (MDPH) birth
certificate data
Information on all live births in Massachusetts is stored
in the Registry of Vital Records and Statistics at MDPH.
The Massachusetts Standard Certificate of Live Birth, referred to as the ‘birth certificate’, consists of a Parent
Worksheet and a Hospital Worksheet. The parent(s)
completes the Parent Worksheet, which contains legal
and socio-demographic information on the child’s mother
and father. While the birth certificate does not confirm
that the father is biological, it states that the information provided is about the child’s father regardless of
whether the father will appear on the child’s legal birth
record. A designated hospital representative (e.g., doctor, nurse, or hospital birth registrar) completes the
Hospital Worksheet, which contains information on
prenatal care, labor and delivery, neonatal conditions
and procedures, and discharge.
Hawkins et al. BMC Pediatrics (2016) 16:32
Page 4 of 11
Table 1 Sample socio-demographic characteristics, maternal
health behaviors, and childhood obesity and blood pressure
outcomes of the singleton children from the existing CENTURY
study and Linked CENTURY study (linked with each child’s
Massachusetts birth certificate), 1980–2008
Characteristics
Any data at age ≤ 18 years
CENTURY Study
Linked CENTURY
Study
Total N %
Total N %
269959
Table 1 Sample socio-demographic characteristics, maternal
health behaviors, and childhood obesity and blood pressure
outcomes of the singleton children from the existing CENTURY
study and Linked CENTURY study (linked with each child’s
Massachusetts birth certificate), 1980–2008 (Continued)
Breastfeeding initiationa
200343
Any data at age < 2 years 121389 45.0 %
No
36097
Yes
118638 76.3 %
Missing
104584 52.2 %
Any data at age 5 years
72195
26.7 %
57547
28.7 %
Any data at age 11 years
61270
22.7 %
44812
22.4 %
Weight-for-length ≥ 95th
percentile anytime between
1 and 24 months [69]
Any data at age 17 years
46559
17.2 %
31326
15.6 %
BMI ≥ 95th percentile [53]
Race/ethnicity
White
23.2 %
761
0.5 %
27331
22.5 %
23756
22.7 %
Child’s race/ethnicity Mother’s race/ethnicity
Age 5 years
8566
11.9 %
6934
12.0 %
121565 45.0 %
Age 11 years
9619
15.7 %
7184
16.0 %
Age 17 years
5566
12.0 %
3758
12.0 %
N
Mean (SD)
N
Mean (SD)
Age 5 years
66391
−0.19 (0.81) 52997
−0.20 (0.81)
Age 11 years
57935
0.02 (0.89)
0.02 (0.89)
Age 17 years
44652
−0.11 (0.97) 30078
−0.11 (0.97)
N
Mean (SD)
N
Mean (SD)
151643 75.7 %
Black
23906
8.9 %
23144
11.6 %
Hispanic
9018
3.3 %
9123
4.6 %
Asian
7941
2.9 %
11421
5.7 %
Other
11076
4.1 %
2396
1.2 %
Missing
96453
35.7 %
2616
1.3 %
Systolic blood pressure
z-score [55]
42391
Medical insuranced
Delivery paymenta, e
Private
73412
27.2 %
136022 87.5 %
Medicaid
18215
6.7 %
17116
11.0 %
Age 5 years
66391
0.08 (0.71)
52997
0.08 (0.71)
Other
-
-
1960
1.3 %
Age 11 years
57935
0.17 (0.74)
42391
0.17 (0.73)
Missing
178332 66.1 %
398
0.3 %
Age 17 years
44652
0.11 (0.75)
30078
0.10 (0.74)
Insurance
Mother US born
Diastolic blood pressure
z-score [55]
a
No
39972
20.0 %
Yes
158965 79.4 %
Missing
1406
0.7 %
Mother married at time
of birth
From 1987
From 1992
From 1996
d
Type of medical insurance at most recent visit recorded in clinical database
e
Medical insurance status for the delivery recorded on the birth certificate
b
c
Birth certificate measures
No
31232
Yes
169026 84.4 %
15.6 %
Missing
85
0.0 %
Mother smoked during
pregnancyb
No
109846 93.9 %
Yes
6852
5.9 %
Missing
264
0.2 %
No
80953
96.1 %
Yes
2884
3.4 %
Missing
413
0.5 %
Mother had gestational
diabetes mellitusc
a
Cesarean delivery
No
118439 76.2 %
Yes
36256
23.3 %
Missing
801
0.5 %
Pregnancy/infant measures The birth certificate contains information on infant’s sex, birth weight, plurality,
gestational age based on the last menstrual period and
clinical estimates, mode of delivery, and parity.
Maternal health behaviors Mothers self-report the
average number of cigarettes they smoked daily before
and, separately, during pregnancy. The hospital records
the mother’s total weight gain/loss, whether the mother
had GDM, whether the mother had hypertension,
whether the mother was breastfeeding at the time the
birth certificate was completed (referred to as breastfeeding initiation), and month prenatal care began and
the number of prenatal care visits.
Socio-demographic information Mothers and fathers
each report their race (white, Black, Asian/Pacific Islander,
American Indian, and other), age, place of birth, education,
language preference, and marital status (mothers only).
Hawkins et al. BMC Pediatrics (2016) 16:32
Page 5 of 11
The birth certificate in Massachusetts also collects information on each parent’s ancestry or ethnic heritage (referred to as ethnicity) from 39 items, including several
write-in options [56]. The hospital records the mothers’
medical insurance status for the delivery.
306,147 children in CENTURY Study
269,959 singleton children
Geographic information Mothers report the city and
zip code of their residential mailing address on the birth
certificate and the Registry reports the census tract. We
have the ability to link each child’s census tract with
area-level measures of socioeconomic circumstances
through the census and the built environment. Information from commercial databases on locations of parks, fast
food restaurants and supermarkets can provide indicators
of children’s physical activity and food environments.
The birth certificate has undergone multiple revisions
since its inception. While a majority of the variables from
the birth certificate are available from 1969 onwards,
when birth certificate data are first available from MDPH,
birth certificates have collected increasingly more information over time. Data for the pregnancy/infant measures
as well as maternal race, education, and marital status are
available over the entire study period. Data for ethnicity
and other socio-demographic characteristics are available
primarily from 1987. Similarly, breastfeeding initiation,
total weight gain/loss, and pregnancy-related hypertension
were included in the birth certificate from 1987. Maternal
smoking during pregnancy was collected from 1992 and
GDM from 1996.
IRB approval for the Linked CENTURY Study was
obtained from Boston College, Harvard Pilgrim Health
Care (HPHC), MDPH, and Massachusetts General Hospital. Only approved study personnel at HPHC and
MDPH had access to names and dates of birth for data
linkage purposes and researchers had access only to a
de-identified dataset.
Linkage file
Random ID
CENTURY Study
linkage variables:
Child name & date of birth
Mother date of birth
Send to MDPH
MDPH links children with birth
certificate data; removes
identifying information and returns
Linked CENTURY dataset
CENTURY Study linked with birth certificate data
200,343 singleton children (74% matched)
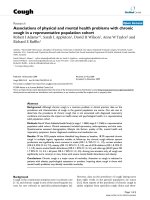
Fig. 1 Flow diagram for linking the CENTURY Study data with each
child’s Massachusetts birth certificate
Linkage procedure
In collaboration with MDPH, we developed a process
for transferring the data between institutions (Fig. 1) and
linking the datasets (Table 2). The Research Support
Data Center at HPHC created a dataset that contained a
random ID for each CENTURY Study child, child’s
name and date of birth, mother’s date of birth, and all
study variables. The Research Support Data Center sent
the dataset to MDPH who linked each child with their
birth certificate based on a linkage algorithm comparing
the child’s name and date of birth and the mother’s date
of birth. Table 2 presents the matching phase linkage algorithm and resulting number of matches for the six
permutations of the algorithm. The majority of matches
occurred only using the child information: 45.2 % of
matches were based on the child’s first and last name
and date of birth, while a further 33.3 % of matches were
Table 2 Success rate of linkage algorithm by type of match
(N = 200,343)
Matching phase Type of match
Number
linked
%
1
Child’s first, middle, and last name 5282
& dob and mother’s dob
2.6 %
2
Child’s first, middle initial, and last 32094
name & dob and mother’s dob
16.0 %
3
Child’s first, middle, and last name 3035
& dob
1.5 %
4
Child’s first, middle initial, and last 66730
name & dob
33.3 %
5
Child’s first and last name & dob
90506
45.2 %
6
Child’s first 3 letters of first name
and last name & dob
2696
1.3 %
Hawkins et al. BMC Pediatrics (2016) 16:32
based on the child’s first, middle initial, and last name
and date of birth. MDPH then removed identifying information and returned the dataset to our study team.
Results
Overall, 74.2 % of the 269,959 singleton children were
matched, resulting in 200,343 children in the Linked
CENTURY Study with 1,580,597 well child visits. On
average, each child had 7.9 visits (SD 6.6), range 1–93.
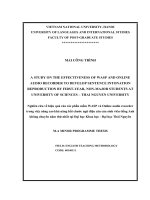
The proportion of children who were linked to their birth
certificate was higher in recent years from 47.8 % in 1969
to 92.4 % in 2008 (Fig. 2). As a result, 77.6 % of the children in the dataset were born from 1987 onwards. Differences in the proportion of children linked may be a result
of when changes in the birth certificate were introduced
(i.e., new items were added in 1987) (personal communication with Kevin Foster, October 14, 2014). Within this
cohort, 60.9 % (121,917) children have at least one other
sibling in the dataset.
Sample socio-demographic characteristics, maternal
health behaviors, and childhood obesity and blood pressure outcomes of Linked CENTURY Study children are
shown in Table 1. Approximately half of the sample had
height/weight data available between 1 and < 24.0 months,
one-third at age 5, and one-fifth at age 11 years. There is a
91 % agreement between maternal race/ethnicity from the
birth certificate and children’s race/ethnicity from the
existing CENTURY Study. Using maternal race/ethnicity
as an indicator of children’s race/ethnicity, 75.7 % of
children were white, 11.6 % black, 4.6 % Hispanic, 5.7 %
Asian, and only 1.3 % had missing data. Using medical
insurance status from the birth certificate as an indicator
of socioeconomic circumstances, 11.0 % of mothers had
N in Linked
CENTURY
Study
Page 6 of 11
their delivery paid for by public health insurance and
0.3 % had missing information.
Based on socio-demographic information from the birth
certificate, 20.0 % of mothers were non-US born, 15.6 %
were not married at the time of birth, 5.9 % smoked during pregnancy and 76.3 % initiated breastfeeding. Using
clinical data from the CENTURY Study, 22.7 % of children
had a weight-for-length ≥ 95th percentile between 1 and
24 months and 12.0 % had a BMI ≥ 95th percentile at ages
5 and 17 years.
Using clinical data from the CENTURY Study, 92 % of
children with a visit at age 5 years had blood pressure
measurement, 95 % at 11 years and 96 % at 17 years. At
ages 5, 11, and 17 years, mean (SD) systolic blood pressure mm Hg values were 93.0 (8.7), 105.8 (9.8), and
114.5 (10.6) and mean (SD) diastolic blood pressure mm
Hg values were 55.8 (8.0), 64.2 (8.3) and 68.9 (8.3). Blood
pressure z-scores are provided in Table 1.
We compared children who were successfully linked
with their birth certificate and those who were not linked
(Table 3). Overall, differences by sex were minimal. Children not linked were more likely to be born in the 1970s
and 1980s, from an ethnic minority group, or have missing race/ethnicity or medical insurance information.
A feature of the Linked CENTURY Study is that 94.0 %
(188,334) of children have some father information available. Table 4 compares the socio-demographic information
from the birth certificate between mothers and fathers.
Fathers were slightly older at the time of birth (mean 32
versus 30 years) and more likely to have 16+ years of education than mothers (18.2 % versus 14.0 %); however, there
were few differences by race/ethnicity or nativity.
Although the Linked CENTURY Study included children
from eastern Massachusetts only, we compared selected
10000
100%
9000
90%
8000
80%
7000
70%
6000
60%
5000
50%
4000
40%
3000
30%
2000
20%
1000
10%
0
% Linked
0%
1969 1971 1973 1975 1977 1979 1981 1983 1985 1987 1989 1991 1993 1995 1997 1999 2001 2003 2005 2007
Child’s year of birth
Fig. 2 Number of participants in Linked CENTURY Study (left axis - bars) and % linked (right axis - line) by child’s year of birth (N = 200,343)
Hawkins et al. BMC Pediatrics (2016) 16:32
Page 7 of 11
Table 3 Socio-demographic characteristics from the CENTURY
Study of children included in the Linked CENTURY Study and
those who were not linked
Characteristics
Linked CENTURY Study
Not linked
(N = 200343)
(N = 69616)
%
%
Child’s year of birth (decade)
1970s
8.6
19.8
1980s
23.9
34.0
1990s
40.0
33.2
2000s
27.6
13.0
Male
50.3
51.0
Female
49.7
49.1
Child’s sex
Child’s race/ethnicity
White
49.1
33.3
Black
7.7
12.1
Hispanic
2.7
5.3
Asian
2.7
3.8
Other
Missing
3.5
5.8
34.3
39.8
29.5
20.6
Medical insurancea
Private
Medicaid
Missing
6.8
6.5
63.7
72.9
a
Type of medical insurance at most recent visit recorded in clinical database
Table 4 Maternal and paternal socio-demographic information
from the birth certificate
Maternal (N = 200,343)
Paternal (N = 188,334)
Characteristic
N
Mean (SD) or %
N
Age, years
199986
30 (6)
175425
Mean (SD) or %
32 (6)
Race/ethnicity
White
151643
76.7 %
146572
79.0 %
Black
23144
Hispanic
9123
11.7 %
18487
10.0 %
4.6 %
7992
4.3 %
Asian
Other
11421
5.8 %
10105
5.5 %
2396
1.2 %
2334
1.3 %
<12 years
2433
1.2 %
2070
1.1 %
12 years
67141
34.0 %
64515
35.1 %
13–15 years
100254
50.8 %
83868
45.6 %
16+ years
27672
14.0 %
33489
18.2 %
Education
US born
No
39972
20.1 %
39671
21.5 %
Yes
158965
79.9 %
144668
78.5 %
maternal socio-demographic characteristics between
singleton children born from 2004 to 2008 and all
Massachusetts births in 2008 [57] (Table 5). Both
datasets had similar proportions of mothers who were
Black, US born, had GDM, and a cesarean delivery. The
Linked CENTURY Study had more white (73.2 %) and
Asian mothers (11.4 %) and fewer Hispanic mothers
(4.9 %) than all Massachusetts births (67.2 %, 7.7 %,
14.2 %, respectively). While the Linked CENTURY Study
had fewer mothers not married at the time of birth
(17.7 % versus 24.0 %), mothers were more likely to have
initiated breastfeeding (86.6 % versus 80.8 %) than all
Massachusetts births.
Discussion
By linking routinely-collected data sources, we can address research questions that could not be answered
with either source alone. Linkage of the existing CENTURY Study, a clinical database, with each child’s birth
certificate, a public health data source, has created a
dataset with the potential to examine the etiology of racial/ethnic and socioeconomic disparities in childhood
obesity. The Linked CENTURY Study is a cohort of
200,343 children who can be followed through age
18 years. Future data extractions can update the dataset
with newer cohorts of children as well as extend the longitudinal nature of the dataset for the existing children
from 2008 through present.
There are many advantages to the type of data linkage
we report. Harvesting data from electronic health records allowed us to generate a large, diverse cohort of
children, which has the potential to be updated with
more recent height and weight data or other items
through future data extractions. Linking databases is a
cost-effective study design for examining research questions using a life course perspective. Although the
process of working with MDPH and HVMA was time
consuming for the study team and personnel time
should not be under-estimated, the physical cost of linking the data sources was less than $1,000. This price is
substantially less than the cost of developing a cohort
with primary data collection and long-term follow up.
Linking databases has enabled us to fill in information
that was missing in one source, but not the other. We
can also conduct validation studies of an item from one
source when the other can serve as a gold standard. In
addition, most research on childhood obesity focuses on
maternal or household indicators of socioeconomic status [1]. However, through the birth certificate data, we
have the ability to look at the influence of both parents.
The Linked CENTURY Study has socio-demographic
information on the fathers of almost 190,000 children.
Finally, little is known about the role of the neighborhood
in explaining disparities in childhood obesity because
Hawkins et al. BMC Pediatrics (2016) 16:32
Page 8 of 11
Table 5 Comparison of selected maternal socio-demographic characteristics and health behaviors in the singleton children from the
Linked CENTURY Study, births from 2004 to 2008, and all Massachusetts births in 2008 [57]
Linked CENTURY Study
Massachusetts births
2004–2008 (N = 30,016)
Maternal characteristics
Total N
2008 (N = 76,969)
%
Total N
%
Race/ethnicity
White
21947
73.2
51,760
67.2
Black
2610
8.7
6,652
8.6
Hispanic
1471
4.9
10,895
14.2
Asian
3413
11.4
5,958
7.7
Other
544
1.8
-
-
Not US born
7935
26.4
21,299
27.7
Not married at time of birth
5323
17.7
26,146
34.0
Had gestational diabetes mellitus
1240
4.1
3,086
4.0
Cesarean delivery
9700
32.4
26,240
34.3
Initiated breastfeeding
25959
86.6
61,033
80.8
geographical data are often not collected or available. Census tract information from the birth certificate will allow
us to link to additional sources and examine the role of
both area-level socioeconomic indicators and measures of
the built environment on childhood obesity. While geographic information is currently only available from the
child’s place of birth, the study team is exploring data
extraction of the current residential address.
Most epidemiological studies examining risk factors for
childhood obesity have been observational and, consequently, evidence has been based on associations. There are
nearly 122,000 siblings in the Linked CENTURY. Sibling
pair methodologies will allow us to reduce confounding
by better controlling for genetic and shared environmental and familial factors [32]. Currently, only a limited number of sibling pair studies have examined early
life risk factors, including smoking during pregnancy
[35, 36], GDM [40, 44], gestational weight gain [41, 42],
and breastfeeding [34, 37–39, 43]. We are not aware of
sibling pair studies on accelerated infant weight gain
and none of the more recent risk factors such as
cesarean delivery or antibiotic use. With geographical
data, it is also possible to explore differences in neighborhood effects between siblings who moved residence
throughout childhood. Alternative methodologies to
observational studies will produce less biased estimates
and, ultimately, insights into areas for prevention. The
study team has presented on several analyses using
siblings in the Linked CENTURY Study to compare
childhood obesity outcomes within families [58–60].
There are also a number of limitations that should be
addressed. Linking datasets across institutions can be
very time-intensive. In addition to the time that is required to apply for IRB approval from each institution,
data confidentiality agreements and developing linkage
algorithms can take many years. In addition, some institutions may have never been in contact previously and it
can take time to develop these relationships.
Since some routinely-collected data are not objectively
measured, there may be potential misclassification. Child
race/ethnicity in the CENTURY Study was collected by
either the parent or clinician, but it is not possible to determine who reported it. Some of the health-related items
on the birth certificate are reported by the parent(s) or a
hospital representative. For example, a mother reports on
the average number of cigarettes she smoked during pregnancy on an average day. Maternal smoking during pregnancy is under-reported on the birth certificate compared
to information on smoking collected on confidential surveys completed postpartum [61]. A hospital representative
records yes or no in response to ‘is mother breastfeeding’,
which serves as an indicator of breastfeeding initiation. In
this case, a study in Massachusetts demonstrated a high
level of agreement between the birth certificate and hospital infant feeding records [62]. The item of maternal
total weight gained/lost is reported by the hospital at the
time of delivery, but not necessarily based on measured
weight and information on pre-pregnancy weight is not
recorded. Validation studies have found misreporting of
weight gain among women with a high body mass index
or at the extremes of gestational weight gain [63, 64], posing some challenges for examining gestational weight gain
using birth certificate data.
Attrition and selection bias in linked datasets are
threats to internal validity similar to those in prospective
cohort studies. There are two sources of missing data in
our study. First, if children leave the clinical practice,
then they will no longer be in our dataset. Second, some
Hawkins et al. BMC Pediatrics (2016) 16:32
children have simply not aged into a category, i.e., children born after 1997 had not yet reached age 11. While
28.7 % of children have data at 5 years, only 22.4 % of
children have data at 11 years. Extracting data from children’s electronic health records from 2009 onwards will
increase the sample size at these later ages. A further
limitation of clinical databases is that they often underrepresent diverse populations who have less access to
clinical care. HVMA accepted children with Medicaid
insurance from 1987 onwards, suggesting that the database is less likely to be representative in prior years.
However, using recent data, many of the maternal characteristics in the Linked CENTURY Study are similar to
those for all births in Massachusetts (Table 5). Although
the Linked CENTURY Study includes more mothers
who were white and married at the time of birth, data
specific to Eastern Massachusetts are not available.
Increasing the use of electronic health records to improve the coordination of care is an important feature
of the Patient Protection and Affordable Care Act [65].
Internationally, data linkage is an active component of
evaluating health system performance [66] and, ultimately, improving care and population health. Learning
from new data linkage projects in the US [67–69] and
more established ones in Europe [70–72] will provide
further evidence on the potential for data linkages with
electronic health records to address important public
health problems like childhood obesity.
Conclusions
Childhood obesity is prevalent, of consequence, has its origins in the earliest stages of life, and disproportionately
affects children from racial/ethnic minority groups and
from disadvantaged backgrounds. The Linked CENTURY
Study, created by incorporating clinical data with birth
certificates, is a unique dataset with nearly complete racial/ethnic and socio-demographic information from both
parents. Thus, the Linked CENTURY Study has the
potential to examine the etiology of racial/ethnic and socioeconomic disparities in childhood obesity.
Abbreviations
BMI: Body mass index; CDC: Centers for Disease Control and Prevention;
dob: date of birth; GDM: Gestational diabetes mellitus; HPHC: Harvard Pilgrim
Health Care; HVMA: Harvard Vanguard Medical Associates;
MDPH: Massachusetts Department of Public Health; WFL: Weight-for-length.
Competing interests
The authors declare that they have no competing interests.
Authors’ contributions
SSH conceived of the data linkage, participated in the study design,
coordinated the data linkage, and drafted the manuscript. SLR-S performed
the statistical analysis. KPK consulted on the statistical analysis. MWG created
the original CENTURY Study and participated in the study design. MM consulted
on the clinical aspects of the study. EMT created the original CENTURY
Study and participated in the study design. All authors read and approved the
final manuscript.
Page 9 of 11
Acknowledgements
This work was partially funded by grants from the NIH (R00 HD068506) to Dr.
Hawkins and the National Center for Chronic Disease Prevention and Health
Promotion (Contract No. 200-2008-M-26882) to Dr. Taveras. The content is
solely the responsibility of the authors and does not necessarily represent
the official views of the funders.
Author details
1
Boston College, School of Social Work, McGuinn Hall, 140 Commonwealth
Avenue, Chestnut Hill, MA, USA. 2Obesity Prevention Program, Department of
Population Medicine, Harvard Medical School and Harvard Pilgrim Health
Care Institute, Boston, MA, USA. 3Penn Center for Health Care Innovation,
Philadelphia, PA, USA. 4Division of General Academic Pediatrics, Department
of Pediatrics, Massachusetts General Hospital for Children, Boston, MA, USA.
5
Department of Nutrition, Harvard T.H. Chan School of Public Health, Boston,
MA, USA.
Received: 17 July 2015 Accepted: 29 February 2016
References
1. Ogden CL, Carroll MD, Kit BK, Flegal KM. Prevalence of childhood and adult
obesity in the United States, 2011–2012. JAMA. 2014;311(8):806–14.
2. Centers for Disease Control and Prevention. Vital signs: obesity among lowincome, preschool-aged children–United States, 2008–2011. MMWR Morb
Mortal Wkly Rep. 2013;62(31):629–34.
3. Ben-Shlomo Y, Kuh D. A life course approach to chronic disease epidemiology:
conceptual models, empirical challenges and interdisciplinary perspectives.
Int J Epidemiol. 2002;31(2):285–93.
4. Hawkins SS, Oken E, Gillman MW. Early in the life course: time for obesity
prevention. In: Halfon N, Forrest C, Lerner R, Faustman EM, editors. Handbook
of life course health development science. New York: Springer; 2015.
5. Oken E, Levitan EB, Gillman MW. Maternal smoking during pregnancy and
child overweight: systematic review and meta-analysis. Int J Obes. 2008;
32(2):201–10.
6. Weng SF, Redsell SA, Swift JA, Yang M, Glazebrook CP. Systematic review
and meta-analyses of risk factors for childhood overweight identifiable
during infancy. Arch Dis Child. 2012;97(12):1019–26.
7. Ino T. A meta-analysis of association between maternal smoking during
pregnancy and offspring obesity. Pediatr Int. 2010;52(1):94–9.
8. Lau EY, Liu J, Archer E, McDonald SM, Liu J. Maternal weight gain in
pregnancy and risk of obesity among offspring: a systematic review.
J Obes. 2014;2014:524939.
9. Mamun AA, Mannan M, Doi SA. Gestational weight gain in relation to
offspring obesity over the life course: a systematic review and bias-adjusted
meta-analysis. Obes Rev. 2014;15(4):338–47.
10. Nehring I, Lehmann S, von Kries R. Gestational weight gain in accordance to
the IOM/NRC criteria and the risk for childhood overweight: a meta-analysis.
Pediatr Obes. 2013;8(3):218–24.
11. Kim SY, England JL, Sharma JA, Njoroge T. Gestational diabetes mellitus and
risk of childhood overweight and obesity in offspring: a systematic review.
Exp Diabetes Res. 2011;2011:541308.
12. Monteiro PO, Victora CG. Rapid growth in infancy and childhood and
obesity in later life–a systematic review. Obes Rev. 2005;6(2):143–54.
13. Baird J, Fisher D, Lucas P, Kleijnen J, Roberts H, Law C. Being big or growing
fast: systematic review of size and growth in infancy and later obesity. BMJ.
2005;331(7522):929.
14. Arenz S, Ruckerl R, Koletzko B, von Kries R. Breast-feeding and childhood
obesity–a systematic review. Int J Obes Relat Metab Disord. 2004;28(10):1247–56.
15. Harder T, Bergmann R, Kallischnigg G, Plagemann A. Duration of
breastfeeding and risk of overweight: a meta-analysis. Am J Epidemiol. 2005;
162(5):397–403.
16. Owen CG, Martin RM, Whincup PH, Smith GD, Cook DG. Effect of infant
feeding on the risk of obesity across the life course: a quantitative review
of published evidence. Pediatrics. 2005;115(5):1367–77.
17. Yan J, Liu L, Zhu Y, Huang G, Wang PP. The association between
breastfeeding and childhood obesity: a meta-analysis. BMC Public
Health. 2014;14:1267.
18. Li HT, Zhou YB, Liu JM. The impact of cesarean section on offspring
overweight and obesity: a systematic review and meta-analysis. Int J Obes.
2013;37(7):893–9.
Hawkins et al. BMC Pediatrics (2016) 16:32
19. Darmasseelane K, Hyde MJ, Santhakumaran S, Gale C, Modi N. Mode of
delivery and offspring body mass index, overweight and obesity in
adult life: a systematic review and meta-analysis. PLoS One. 2014;9(2):
e87896.
20. Bailey LC, Forrest CB, Zhang P, Richards TM, Livshits A, DeRusso PA.
Association of antibiotics in infancy with early childhood obesity. JAMA
Pediatr. 2014;168(11):1063–9.
21. Saari A, Virta LJ, Sankilampi U, Dunkel L, Saxen H. Antibiotic exposure in
infancy and risk of being overweight in the first 24 months of life.
Pediatrics. 2015;135(4):617–26.
22. Grow HM, Cook AJ, Arterburn DE, Saelens BE, Drewnowski A, Lozano P.
Child obesity associated with social disadvantage of children’s neighborhoods.
Soc Sci Med. 2010;71(3):584–91.
23. Fiechtner L, Block J, Duncan DT, Gillman MW, Gortmaker SL, Melly SJ, et al.
Proximity to supermarkets associated with higher body mass index among
overweight and obese preschool-age children. Prev Med. 2013;56(3–4):218–21.
24. Lovasi GS, Schwartz-Soicher O, Quinn JW, Berger DK, Neckerman KM, Jaslow
R, et al. Neighborhood safety and green space as predictors of obesity
among preschool children from low-income families in New York City.
Prev Med. 2013;57(3):189–93.
25. Carroll-Scott A, Gilstad-Hayden K, Rosenthal L, Peters SM, McCaslin C, Joyce
R, et al. Disentangling neighborhood contextual associations with child
body mass index, diet, and physical activity: the role of built,
socioeconomic, and social environments. Soc Sci Med. 2013;95:106–14.
26. Papas MA, Alberg AJ, Ewing R, Helzlsouer KJ, Gary TL, Klassen AC. The built
environment and obesity. Epidemiol Rev. 2007;29:129–43.
27. Dunton GF, Kaplan J, Wolch J, Jerrett M, Reynolds KD. Physical
environmental correlates of childhood obesity: a systematic review.
Obes Rev. 2009;10(4):393–402.
28. Lovasi GS, Hutson MA, Guerra M, Neckerman KM. Built environments and
obesity in disadvantaged populations. Epidemiol Rev. 2009;31:7–20.
29. Rossen LM. Neighbourhood economic deprivation explains racial/ethnic
disparities in overweight and obesity among children and adolescents in
the USA. J Epidemiol Community Health. 2014;68(2):123–9.
30. Powell LM, Wada R, Krauss RC, Wang Y. Ethnic disparities in adolescent
body mass index in the United States: the role of parental socioeconomic
status and economic contextual factors. Soc Sci Med. 2012;75(3):469–76.
31. Kimbro RT, Denney JT. Neighborhood context and racial/ethnic differences
in young children’s obesity: structural barriers to interventions. Soc Sci Med.
2013;95:97–105.
32. Brion MJ. Commentary: Assessing the impact of breastfeeding on child
health: where conventional methods alone fall short for reliably establishing
causal inference. Int J Epidemiol. 2010;39(1):306–7.
33. Knopik VS. Commentary: Smoking during pregnancy–genes and environment
weigh in. Int J Epidemiol. 2010;39(5):1203–5.
34. Gillman MW, Rifas-Shiman SL, Berkey CS, Frazier AL, Rockett HR, Camargo
Jr CA, et al. Breast-feeding and overweight in adolescence: within-family
analysis [corrected]. Epidemiology. 2006;17(1):112–4.
35. Iliadou AN, Koupil I, Villamor E, Altman D, Hultman C, Langstrom N, et al.
Familial factors confound the association between maternal smoking during
pregnancy and young adult offspring overweight. Int J Epidemiol. 2010;
39(5):1193–202.
36. Gilman SE, Gardener H, Buka SL. Maternal smoking during pregnancy
and children’s cognitive and physical development: a causal risk factor?
Am J Epidemiol. 2008;168(5):522–31.
37. Metzger MW, McDade TW. Breastfeeding as obesity prevention in the
United States: a sibling difference model. Am J Hum Biol. 2010;22(3):
291–6.
38. O’Tierney PF, Barker DJ, Osmond C, Kajantie E, Eriksson JG. Duration of
breast-feeding and adiposity in adult life. J Nutr. 2009;139(2):422S–5S.
39. Nelson MC, Gordon-Larsen P, Adair LS. Are adolescents who were breast-fed
less likely to be overweight? Analyses of sibling pairs to reduce confounding.
Epidemiology. 2005;16(2):247–53.
40. Lawlor DA, Lichtenstein P, Langstrom N. Association of maternal diabetes
mellitus in pregnancy with offspring adiposity into early adulthood: sibling
study in a prospective cohort of 280,866 men from 248,293 families.
Circulation. 2011;123(3):258–65.
41. Lawlor DA, Lichtenstein P, Fraser A, Langstrom N. Does maternal weight
gain in pregnancy have long-term effects on offspring adiposity? A sibling
study in a prospective cohort of 146,894 men from 136,050 families.
Am J Clin Nutr. 2011;94(1):142–8.
Page 10 of 11
42. Branum AM, Parker JD, Keim SA, Schempf AH. Prepregnancy body mass
index and gestational weight gain in relation to child body mass index
among siblings. Am J Epidemiol. 2011;174(10):1159–65.
43. Colen CG, Ramey DM. Is breast truly best? Estimating the effects of breastfeeding
on long-term child health and wellbeing in the United States using sibling
comparisons. Soc Sci Med. 2014;109:55–65.
44. Dabelea D, Hanson RL, Lindsay RS, Pettitt DJ, Imperatore G, Gabir MM, et al.
Intrauterine exposure to diabetes conveys risks for type 2 diabetes and
obesity: a study of discordant sibships. Diabetes. 2000;49(12):2208–11.
45. Fraser A, Macdonald-Wallis C, Tilling K, Boyd A, Golding J, Davey Smith G,
et al. Cohort Profile: the Avon Longitudinal Study of Parents and Children:
ALSPAC mothers cohort. Int J Epidemiol. 2013;42(1):97–110.
46. Oken E, Baccarelli AA, Gold DR, Kleinman KP, Litonjua AA, De Meo D, et al.
Cohort profile: project viva. Int J Epidemiol. 2015;44(1):37–48.
47. Wen X, Kleinman K, Gillman MW, Rifas-Shiman SL, Taveras EM. Childhood
body mass index trajectories: modeling, characterizing, pairwise correlations
and socio-demographic predictors of trajectory characteristics. BMC Med
Res Methodol. 2012;12:38.
48. Kim J, Peterson KE, Scanlon KS, Fitzmaurice GM, Must A, Oken E, et al. Trends in
overweight from 1980 through 2001 among preschool-aged children enrolled
in a health maintenance organization. Obesity. 2006;14(7):1107–12.
49. Taveras EM, Rifas-Shiman SL, Sherry B, Oken E, Haines J, Kleinman K, et al.
Crossing growth percentiles in infancy and risk of obesity in childhood.
Arch Pediatr Adolesc Med. 2011;165(11):993–8.
50. Hazlehurst B, Sittig DF, Stevens VJ, Smith KS, Hollis JF, Vogt TM, et al. Natural
language processing in the electronic medical record: assessing clinician
adherence to tobacco treatment guidelines. Am J Prev Med. 2005;29(5):434–9.
51. Friedman C, Shagina L, Lussier Y, Hripcsak G. Automated encoding of
clinical documents based on natural language processing. J Am Med
Inform Assoc. 2004;11(5):392–402.
52. Rifas-Shiman SL, Rich-Edwards JW, Scanlon KS, Kleinman KP, Gillman MW.
Misdiagnosis of overweight and underweight children younger than 2 years
of age due to length measurement bias. Med Gen Med. 2005;7(4):56.
53. Kuczmarski RJ, Ogden CL, Guo SS, Grummer-Strawn LM, Flegal KM, Mei Z,
et al. 2000 CDC Growth Charts for the United States: methods and
development. Vital Health Stat 11. 2002;(246):1–190
54. Pickering TG, Hall JE, Appel LJ, Falkner BE, Graves J, Hill MN, et al.
Recommendations for blood pressure measurement in humans and
experimental animals: Part 1: blood pressure measurement in humans: a
statement for professionals from the Subcommittee of Professional and
Public Education of the American Heart Association Council on High
Blood Pressure Research. Hypertension. 2005;45(1):142–61.
55. National High Blood Pressure Education Program Working Group on High
Blood Pressure in Children and Adolescents. The fourth report on the
diagnosis, evaluation, and treatment of high blood pressure in children and
adolescents. Pediatrics. 2004;114(2 Suppl 4th Report):555–76.
56. Hawkins SS, Torres B, May GS, Cohen BB. Setting the standards for collecting
ethnicity data in the Commonwealth of Massachusetts. J Public Health
Manag Pract. 2011;17(6):550–3.
57. Massachusetts Department of Public Health. Massachusetts Births 2008.
Boston: Massachusetts Department of Public Health; 2010.
58. Rifas-Shiman SL, Hawkins SS, Kleinman K, Gillman MW, Taveras EM. Delivery
by caesarean section and BMI-z at age 5 years: within-family analysis. Los
Angeles: The Obesity Society; 2015.
59. Hawkins SS, Rifas-Shiman SL, Baum CF, Gillman MW, Taveras EM. Using a
sibling design to examine the association of breastfeeding with early
childhood obesity. Miami: Epidemiology Congress of the Americas; 2016.
60. Rifas-Shiman S, Hawkins SS, Gillman MW, Taveras EM. Smoking during
pregnancy and BMI-z at age 5 years: within-family analysis. Miami:
Epidemiology Congress of the Americas; 2016.
61. Allen AM, Dietz PM, Tong VT, England L, Prince CB. Prenatal smoking prevalence
ascertained from two population-based data sources: birth certificates and
PRAMS questionnaires, 2004. Public Health Rep. 2008;123(5):586–92.
62. Navidi T, Chaudhuri J, Merewood A. Accuracy of breastfeeding data on the
Massachusetts birth certificate. J Hum Lact. 2009;25(2):151–6.
63. Bodnar LM, Abrams B, Bertolet M, Gernand AD, Parisi SM, Himes KP, et al.
Validity of birth certificate-derived maternal weight data. Paediatr Perinat
Epidemiol. 2014;28(3):203–12.
64. Wright CS, Weiner M, Localio R, Song L, Chen P, Rubin D. Misreport of
gestational weight gain (GWG) in birth certificate data. Matern Child Health
J. 2012;16(1):197–202.
Hawkins et al. BMC Pediatrics (2016) 16:32
Page 11 of 11
65. U.S. Department of Health & Human Services. Key features of the Affordable
Care Act by year. Accessed 6 March 2015.
66. EuroReach Health Data Navigator: Data linkage. lthdatanavigator.
eu/data-management/data-linkage. Accessed 6 March 2015.
67. Hillier TA, Pedula KL, Schmidt MM, Mullen JA, Charles MA, Pettitt DJ.
Childhood obesity and metabolic imprinting: the ongoing effects of
maternal hyperglycemia. Diabetes Care. 2007;30(9):2287–92.
68. Angier H, Gold R, Crawford C, P O’Malley J, J Tillotson C, Marino M, et al.
Linkage methods for connecting children with parents in electronic health
record and state public health insurance data. Matern Child Health J. 2014;
18(9):2025–33.
69. Heerman WJ, Bian A, Shintani A, Barkin SL. Interaction between maternal
prepregnancy body mass index and gestational weight gain shapes infant
growth. Acad Pediatr. 2014;14(5):463–70.
70. OECD. Strengthening health information infrastructure for health care quality
governance: Good practices, new opportunities and data privacy protection
challenges. Paris: OECD Health Policy Studies, OECD Publishing; 2013.
71. Baker JL, Sorensen TI. Obesity research based on the Copenhagen School
Health Records Register. Scand J Public Health. 2011;39(7 Suppl):196–200.
72. Olsen SF, Birgisdottir BE, Halldorsson TI, Brantsaeter AL, Haugen M, Torjusen
H, et al. Possibilities and considerations when merging dietary data from
the world’s two largest pregnancy cohorts: the Danish National Birth Cohort
and the Norwegian Mother and Child Cohort Study. Acta Obstet Gynecol
Scand. 2014;93(11):1131–40.
Submit your next manuscript to BioMed Central
and we will help you at every step:
• We accept pre-submission inquiries
• Our selector tool helps you to find the most relevant journal
• We provide round the clock customer support
• Convenient online submission
• Thorough peer review
• Inclusion in PubMed and all major indexing services
• Maximum visibility for your research
Submit your manuscript at
www.biomedcentral.com/submit