Multidisciplinary care of obese children and adolescents for one year reduces ectopic fat content in liver and skeletal muscle
Bạn đang xem bản rút gọn của tài liệu. Xem và tải ngay bản đầy đủ của tài liệu tại đây (593.17 KB, 9 trang )
Fonvig et al. BMC Pediatrics (2015) 15:196
DOI 10.1186/s12887-015-0513-6
RESEARCH ARTICLE
Open Access
Multidisciplinary care of obese children and
adolescents for one year reduces ectopic
fat content in liver and skeletal muscle
Cilius Esmann Fonvig1,2*, Elizaveta Chabanova3, Johanne Dam Ohrt1, Louise Aas Nielsen1, Oluf Pedersen2,
Torben Hansen2, Henrik S. Thomsen3,4 and Jens-Christian Holm1,4
Abstract
Background: Ectopic fat deposition in liver and skeletal muscle tissue is related to cardiovascular disease risk and is
a common metabolic complication in obese children. We evaluated the hypotheses of ectopic fat in these organs
could be diminished following 1 year of multidisciplinary care specialized in childhood obesity, and whether this
reduction would associate with changes in other markers of metabolic function.
Methods: This observational longitudinal study evaluated 40 overweight children and adolescents enrolled in a
multidisciplinary treatment protocol at the Children’s Obesity Clinic, Holbæk, Denmark. The participants were assessed
by anthropometry, fasting blood samples (HbA1c, glucose, insulin, lipids, and biochemical variables of liver function),
and liver and muscle fat content assessed by magnetic resonance spectroscopy at enrollment and following an
average of 12.2 months of care. Univariate linear regression models adjusted for age, sex, treatment duration,
baseline degree of obesity, and pubertal developmental stage were used for investigating possible associations.
Results: The standard deviation score (SDS) of baseline median body mass index (BMI) was 2.80 (range: 1.49–3.85) and
the median age was 14 years (10–17). At the end of the observational period, the 40 children and adolescents (21 girls)
significantly decreased their BMI SDS, liver fat, muscle fat, and visceral adipose tissue volume. The prevalence of
hepatic steatosis changed from 28 to 20 % (p = 0.26) and the prevalence of muscular steatosis decreased from 75
to 45 % (p = 0.007).
Changes in liver and muscle fat were independent of changes in BMI SDS, baseline degree of obesity, duration of
treatment, age, sex, and pubertal developmental stage.
Conclusions: A 1-year multidisciplinary intervention program in the setting of a childhood obesity outpatient clinic
confers a biologically important reduction in liver and muscle fat; metabolic improvements that are independent of the
magnitude of concurrent weight loss.
Trial registration: ClinicalTrials.gov registration number: NCT00928473, the Danish Childhood Obesity Biobank.
Registered June 25, 2009.
Keywords: Pediatric Obesity, Magnetic Resonance Spectroscopy, Skeletal Muscle, Non-alcoholic Fatty Liver Disease,
Dyslipidemia, Glucose Metabolic Disorders, Child, Adolescent
* Correspondence:
1
The Children’s Obesity Clinic, Department of Pediatrics, Copenhagen
University Hospital Holbæk, 4300 Holbæk, Denmark
2
The Novo Nordisk Foundation Center for Basic Metabolic Research, Section
of Metabolic Genetics, Faculty of Medical and Health Sciences, University of
Copenhagen, 2100 Copenhagen Ø, Denmark
Full list of author information is available at the end of the article
© 2015 Fonvig et al. Open Access This article is distributed under the terms of the Creative Commons Attribution 4.0
International License ( which permits unrestricted use, distribution, and
reproduction in any medium, provided you give appropriate credit to the original author(s) and the source, provide a link to
the Creative Commons license, and indicate if changes were made. The Creative Commons Public Domain Dedication waiver
( applies to the data made available in this article, unless otherwise stated.
Fonvig et al. BMC Pediatrics (2015) 15:196
Background
Hepatic and muscular steatosis are common metabolic
abnormalities in obese children [1, 2]. Childhood onset
accumulation of ectopic fat in liver and skeletal muscle
indicates an increased cardiovascular disease risk including dyslipidemia and insulin resistance [3–8], the latter
being a metabolic abnormality that precedes the development of type 2 diabetes [9].
Several methods can assess the content of ectopic
lipid accumulation, including computed tomography,
ultrasound, tissue biopsies, proton magnetic resonance
spectroscopy (MRS), and magnetic resonance imaging
(MRI) [10]. The non-invasive and non-ionizing MRS is
considered gold standard in muscle lipid quantification
[10] and may in the future replace liver biopsies as the
gold standard in the quantification of liver fat, although
it is not providing information regarding histological alterations [10–12].
Studies on treatment of ectopic fat accumulation in
childhood mainly address hepatic steatosis and the existing literature proposes lifestyle intervention and weight
loss as the therapeutics of choice [13, 14]. Despite the
increasing prevalence in pediatric hepatic steatosis, a targeted treatment strategy of this condition has yet to be
established, and the potential future increase in a broad
array of liver and muscular steatosis-related morbidities calls for further progress in this field of research
[13, 14].
The outlined multidisciplinary care protocol to combat
obesity has previously been reported to associate with
reduction of body mass index (BMI) standard deviation
score (SDS) in a study of 492 overweight and obese children and youths [15] and with improved fasting serum
lipid profiles in a study of 240 overweight and obese
children and youths [16].
The objective of this 1-year observational study was to
investigate the impact of the multidisciplinary care protocol practiced in our outpatient clinic of childhood obesity
with a focus on changes in ectopic deposition of fat in
the liver and skeletal muscles. We hypothesized that ectopic fat in these organs could be reduced following 1
year of childhood obesity treatment, and that this reduction would associate with changes in other markers
of metabolic function.
Methods
Study population
From August 2009 to October 2014, 1406 overweight
children and adolescents were enrolled in treatment at
The Children’s Obesity Clinic, Department of Pediatrics,
Copenhagen University Hospital Holbæk, Denmark [15].
Of these, 398 were offered an MR-scan at the time of
treatment start, and hereof 92 were subsequently offered
a follow-up MR-scan after 1 year of treatment. The
Page 2 of 9
inclusion criteria were i) 8–18 years of age at enrollment, ii) enrollment in childhood obesity treatment, iii)
each of the two MR assessments of liver and muscle
lipid accumulation (at baseline and at follow-up) should
have concomitant anthropometric and biochemical measures within a 60 days period, and iv) a baseline BMI
SDS above 1.28, which corresponds to the 90th percentile according to Danish age- and sex-adjusted references
[17]. The exclusion criteria were i) a body weight above
135 kg, which was the maximum capacity of the MR
scanner, ii) inability to remain quiet in the MR machine
during the 45 minutes scan time, iii) presence of other
liver diseases, iv) development of type 2 diabetes mellitus
during the treatment period, or v) an alcohol consumption of more than 140 g/week.
Treatment
The Children’s Obesity Clinic is a chronic care, multidisciplinary, best-practice, hospital-based, outpatient, childhood obesity treatment center involving a staff core
of pediatricians, dieticians, nurses, psychologists, social
workers, secretaries, and research technicians [15]. Some
baseline examinations are performed as in-patient admissions. Children and adolescents are referred for treatment
from their general practitioners, school- and community based doctors, or pediatricians (at hospitals or private practices) from all over Denmark. At inclusion, a
pediatrician sees the child and family for 1 hour, where
the medical history and a physical examination of the
child are performed. At this visit the child and family
are introduced to the treatment protocol, which is a
family-centered approach involving behavior-modifying
techniques, where the child and family receive an individually tailored and thorough plan of lifestyle advices
[15]. This plan addresses sugar and fat intake, sources of
nutrition, activity, inactivity, psychosocial capabilities,
disturbed eating behaviors, sleeping disorders, hygiene,
allowances, and more [15]. The child and family are
scheduled to consult a pediatrician on an annual basis
and a pediatric nurse, dietician, and/or psychologist as
needed. The treatment plan is evaluated at every visit.
Each family is on average seen in the clinic every
6.5 weeks, with a mean of 5.4 hours of health professional time spent on each patient per year [15].
The treatment protocol for the Children’s Obesity
Clinic is described in detail by Holm et al. [15], and the
appendix “Information to the readers” is furthermore
available from the authors.
Anthropometry
Body weight was measured to the nearest 0.1 kg on a
Tanita digital medical scale (WB-100 MA; Tanita Corp.,
Tokyo, Japan). Height was measured to the nearest 1 mm
by a stadiometer. Weight and height were measured with
Fonvig et al. BMC Pediatrics (2015) 15:196
bare feet in underwear or light indoor clothing. BMI was
calculated as weight divided by height squared (kg/m2).
The BMI SDS was calculated by the LMS method by converting BMI into a normal distribution by sex and age
using the median coefficient of variation and a measure of
the skewness [18] based on the Box-Cox power plot based
on Danish BMI charts [17].
Pubertal development
The pubertal stage was determined at baseline by a trained
pediatrician using the classification of Tanner [19]. In
boys, the developmental stages of pubic hair and genitals
were determined, and testes size was determined by an
orchidometer. In girls, the developmental stages of breasts
and pubic hair were determined.
MR spectroscopy and imaging
MR measurements were performed on a 3.0 T MR imaging system (Achieva, Philips Medical Systems, Best,
The Netherlands) using a SENSE cardiac coil and the
data post processing was performed by an experienced
MR physicist. The participants were examined in the supine position. Liver fat content (LFC) and muscle fat
content (MFC) were measured by MRS. MFC was measured in the psoas muscle. Visceral adipose tissue (VAT)
and subcutaneous adipose tissue (SAT) volumes were
measured by MRI, assessed from a transverse slice of
10 mm thickness at the level of the third lumbar vertebra. The details of the applied methodology of MRI and
MRS have previously been described [1, 2].
Hepatic steatosis was defined as an LFC >5 % [20] and
muscular steatosis was defined as an MFC >5 % [2].
Blood sampling
Blood samples were drawn from an antecubital vein between 7 a.m. and 9 a.m. after an overnight fast. If required, an anesthetic cream was applied one hour before
venipuncture. The biochemical analyses of plasma concentrations of glucose and serum concentrations of
triglycerides, total cholesterol, high density lipoprotein
(HDL) cholesterol, alanine transaminase, and gammaglutamyl transferase were performed on a Dimension
Vista® 1500 analyzer (Siemens, Munich, Germany).
Plasma glucose samples and the serum samples of triglycerides, cholesterol fractions, and biochemical variables of liver function were stored at room temperature
for less than 30 min after sampling before being centrifuged at four degrees Celsius. Plasma glucose samples
were collected in tubes containing fluoride. The biochemical analyses of serum insulin concentrations were
performed on a Cobas® 6000 analyzer (F. Hoffmann-La
Roche Ltd, Basel, Switzerland) and stored at room
temperature for 30–60 min after sampling before being
centrifuged at four degrees Celsius. Analyses of all
Page 3 of 9
plasma and serum samples were performed immediately after being centrifuged. Insulin samples were collected in a tube containing serum separating gel. The
biochemical analyses of whole blood glycosylated
hemoglobin (HbA1c) were performed on a Tosoh highperformance liquid chromatography G8 analyzer (Tosoh
Corporation, Tokyo, Japan). The low density lipoprotein
(LDL) cholesterol concentration was calculated as: Total
cholesterol – (triglycerides × 0.45) + HDL cholesterol. The
Non-HDL cholesterol concentration was calculated as:
Total cholesterol – HDL cholesterol.
Statistical analysis
Wilcoxon signed rank test was used to analyze differences in continuous variables between groups and to
analyze estimations of differences from baseline to followup and the corresponding nonparametric confidence intervals (CI). The differences in fractions of steatosis were
analyzed by McNemar’s Test for paired categorical data.
Associations were investigated by univariate linear regression models adjusted for age, sex, treatment duration,
baseline degree of obesity, and pubertal developmental
stage. The linear regression analyses were based on the
logarithmically transformed baseline and follow-up values.
P-values were not adjusted for multiple hypothesis testing
and the level of significance was set at p <0.05. Statistical
analyses were performed using “R” statistical software version 3.1.2 ().
Ethical aspects
Informed written consent was obtained from the parents
of patients younger than 18 years and from patients of
18 years of age. The study was approved by the Ethics
Committee of Region Zealand, Denmark (SJ-104) and
the Danish Data Protection Agency (REG-06-2014) and
is registered at ClinicalTrials.gov (NCT00928473). This
study has been reported in line with the STROBE guidelines (Additional file 1).
Results
Of the 92 who were offered two MRS assessments, 40
overweight and obese children and adolescents fulfilled
the inclusion criteria. Beside these, five patients were excluded because they had a body weight >135 kg, one patient was excluded from the study because of the
development of type 2 diabetes mellitus during the study
period, and 46 children and adolescents fulfilled all criteria except for having blood samples drawn within the
60 days period of the MR assessment. None were excluded due to an inability to stay quiet during the scan
time, other liver diseases, or an alcohol consumption of
more than 140 g/week. The group not complying with
the blood sample criterion were comparable to the 40
included children and adolescents in regards to BMI
Fonvig et al. BMC Pediatrics (2015) 15:196
Page 4 of 9
SDS, VAT, SAT, and liver fat content before and after
treatment (data not shown). The 40 overweight/obese
children and adolescents (21 girls) had a baseline median
BMI SDS of 2.80 (range 1.49–3.85) and a median age of
13.7 years (10.0–16.8). MRS, MRI, and concomitant anthropometric and biochemical measures were performed
on all study participants at baseline and after a median
of 12 months of follow-up (Table 1). The time between
the MR scan and the biochemical measures was a median of 10 days (range: 0–58) at baseline and 10 days
(1–59) at follow-up. Blood samples were performed
within 30 days from the anthropometric measures (median: 12 days), and the time between the MR scan and
the anthropometric measures was a median of 14 days
(range: 0–56) at baseline and 17 days (1–53) at follow-up.
The 1406 children and adolescents included in treatment were 1.5 years younger (95 % CI: 0.6–2.5, p =
0.001) than the 40 included children and adolescents,
but comparable in baseline BMI-SDS (difference: 0.1, CI
95 %: −0.1–0.3, p = 0.23).
Treatment
The characteristics of the 40 overweight and obese children and adolescents at baseline and follow-up are shown
in Table 1. After an average of 12.2 months (95 % CI:
11.9–13.1) of treatment, BMI SDS was reduced by 0.23
(95 % CI: 0.10–0.44, p = 0.001) accompanied by reductions
in liver fat percentage (1.0, 95 % CI: 0.3–3.6, p = 0.01),
muscle fat percentage (2.4, 95 % CI: 0.7–4.0, p = 0.01),
and VAT volume (14 cm3, 95 % CI: 3–27, p = 0.01). Furthermore, we observed reductions in concentrations of
whole blood HbA1c by 1.0 mmol/mol (95 % CI: 0.0–
2.0, p = 0.04), fasting serum levels of LDL cholesterol by
0.2 mmol/l (95 % CI: 0.0–0.4, p = 0.02), and non-HDL
cholesterol by 0.2 mmol/l (95 % CI: 0.0–0.4, p = 0.02),
and an increase in fasting serum HDL cholesterol concentration of 0.1 mmol/l (95 % CI: 0.0–0.2, p = 0.03).
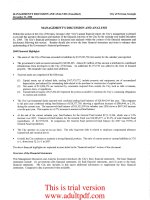
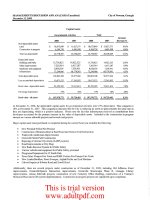
The individual treatment responses on levels of liver
and muscle fat are shown in the Figs. 1 and 2, respectively. At baseline, the prevalence of hepatic steatosis was
28 %; a fraction that was 20 % at follow-up (p = 0.26)
(Table 1). Two of the 29 (7 %) study patients without
hepatic steatosis at baseline exhibited hepatic steatosis
at follow-up, while five of the 11 (45 %) with hepatic
steatosis at baseline exhibited no hepatic steatosis at
follow-up. Muscular steatosis was reduced from 75 % at
baseline to 45 % at follow-up (p = 0.007) (Table 1). Four
of the ten (40 %) patients without muscular steatosis at
baseline exhibited muscular steatosis at follow-up, while
16 of the 30 (53 %) with muscular steatosis at baseline exhibited no muscular steatosis at follow-up.
We observed no significant changes in fasting concentrations of plasma triglyceride, plasma glucose, serum insulin, or biochemical variables of liver function (Table 1).
Table 1 Characteristics of the 40 (21 girls) overweight children and adolescents
Baseline
Follow-up
p
Age, years
13.7 (10.0–16.8)
14.6 (10.9–17.8)
<0.0001***
BMI SDS
2.80 (1.49–3.85)
2.56 (0.18–4.68)
0.001**
3
VAT, cm
83 (21–361)
73 (15–396)
0.01*
SAT, cm3
282 (97–518)
262 (74–527)
0.14
LFC, %
3.0 (0.5–67.0)
3.0 (0.5–32.0)
0.01*
Hepatic steatosis, fraction
28 % (11/40)
20 % (8/40)
0.26
MFC, %
7.4 (1.2–26.3)
4.8 (0.5–39.6)
0.01*
Muscle steatosis, fraction
75 % (30/40)
45 % (18/40)
0.007**
Triglyceride, mmol/l
0.9 (0.2–2.3)
1.0 (0.3–2.0)
0.78
HDL cholesterol, mmol/l
1.2 (0.7–1.7)
1.2 (0.8–2.1)
0.03*
LDL cholesterol, mmol/l
2.3 (1.1–4.2)
2.4 (1.0–3.8)
0.02*
Non-HDL cholesterol, mmol/l
2.8 (1.2–4.7)
2.8 (1.2–4.4)
0.02*
Plasma glucose, mmol/l
5.1 (4.2–6.2)
5.1 (4.4–5.9)
0.42
Serum insulin, pmol/l
83 (11–271)
87 (14–226)
0.99
HbA1c, mmol/l
35 (28–42)
34 (26–40)
0.04*
ALT, U/l
22 (11–126)
22 (10–69)
0.67
GGT, U/l
18 (5–134)
16 (9–33)
0.72
Data are medians (range) due to a non-normal distribution
ALT alanine transaminase; BMI body mass index; GGT gamma-glutamyl transferase; HDL high density lipoprotein; HbA1c glycosylated hemoglobin; IMCL intramyocellular lipid content; LDL low density lipoprotein; LFC liver fat content; MFC muscle fat content; SAT subcutaneous adipose tissue volume; SDS standard deviation
score; VAT visceral adipose tissue volume
P value for group differences: *** p <0.001; ** p <0.01; * p <0.05
Fonvig et al. BMC Pediatrics (2015) 15:196
Page 5 of 9
Fig. 1 Liver Fat Development during Treatment. The development of liver fat content for the individual study participants during an average
follow-up of 12.2 months
Changes in liver fat content
Changes in LFC, adjusted for the baseline level of LFC,
age, sex, treatment duration, baseline degree of obesity,
and pubertal developmental stage, associated positively
with changes in MFC (p = 0.045) and inversely with baseline levels of liver fat (p = 0.001). Changes in LFC were not
significantly associated with baseline levels of or changes
in BMI SDS (p = 0.30, p = 0.57), VAT (p = 0.47, p = 0.45),
SAT (p = 0.27, p = 0.21), or fasting concentrations of triglycerides (p = 0.49, p = 0.78), HDL cholesterol (p = 0.83,
p = 0.62), LDL cholesterol (p = 0.67, p = 0.06), non-HDL
cholesterol (p = 0.63, p = 0.07), plasma glucose (p = 0.66,
p = 0.67), serum insulin (p = 0.07, p = 0.12), HbA1c (p =
0.61, p = 0.50), alanine transaminase (p = 0.87, p = 0.16),
or gamma-glutamyl transferase (p = 0.83, p = 0.16).
While the group not exhibiting hepatic steatosis at baseline maintained the degree of LFC (median change: −0.1 %,
(interquartile range: −0.7; 0.5)), the group exhibiting hepatic steatosis decreased the LFC by a median −7.8 %
(−22.0; −3.4) (p-value for difference: p = 0.0003).
Changes in muscle fat content
Changes in MFC, adjusted for the baseline level of MFC,
age, sex, treatment duration, baseline degree of obesity,
and pubertal developmental stage, associated positively
with changes in VAT (p = 0.001) and inversely with baseline levels of MFC (p = 0.0005). Changes in MFC were
not significantly associated with baseline levels of or
changes in BMI SDS (p = 0.17, p = 0.36), LFC (p = 0.25,
p = 0.47), SAT (p = 0.15, p = 0.57), or fasting concentrations of triglycerides (p = 0.11, p = 0.86), HDL cholesterol (p = 0.85, p = 0.45), LDL cholesterol (p = 0.11, p =
0.28), non-HDL cholesterol (p = 0.07, p = 0.24), plasma
Fonvig et al. BMC Pediatrics (2015) 15:196
Page 6 of 9
Fig. 2 Muscle Fat Development during Treatment. The development of muscle fat content for the individual study participants during an average
follow-up of 12.2 months
glucose (p = 0.66, p = 0.37), serum insulin (p = 0.53, p =
0.21), or HbA1c (p = 0.06, p = 0.52).
While the group not exhibiting muscular steatosis at
baseline tended to increase the degree of MFC (median
change: 2.1 %, (interquartile range: −0.5; 3.6)), the group
exhibiting muscular steatosis decreased the MFC by a median −3.4 % (−7.0; −1.6) (p-value for difference: p = 0.74).
Only the inverse associations between the change in
and the baseline level of both LFC and MFC remained
significant after adjusting for multiple testing ad modum
Benjamini & Hochberg (data not shown).
Discussion
This 1-year multidisciplinary intervention program associated with a biologically important reduction in liver
and muscle fat as assessed by magnetic resonance measures. Comparable findings of concomitant reductions in
BMI SDS, MRI-measured liver fat, and waist circumference (as a surrogate measure of visceral fat) have been
reported in a 1-year nutrition-behavior intervention
study of 26 obese children with an age of 6–14 years
[21]. The present study extends these findings by reporting reductions in ectopic fat content in liver and muscle
independent of the magnitude of weight loss. In a 12week exercise intervention study of 15 obese and 14 lean
post-pubertal adolescents, van der Heijden et al. [22] observed reductions in MRS-measured liver fat, but without reductions in intramyocellular lipids (IMCL) or BMI
SDS suggesting the beneficial effect of longer treatment
periods, as observed in the present study.
In two multidisciplinary childhood obesity treatment
programs of 6 and 12 months duration, respectively, Koot
et al. [23] in a study of 144 children and adolescents and
Reinehr et al. [24] in a study of 109 children and
Fonvig et al. BMC Pediatrics (2015) 15:196
adolescents reported reductions in ultrasound-measured
LFC and BMI SDS. Compared to MRS, ultrasonographic
longitudinal studies have some limitations since they provide less precise and reproducible quantitative information
and have great inter- and intraobserver variability [25]. Although both studies used a single experienced observer,
Koot et al. [23] still reported an intraobserver agreement
as low as 57 %, whereas Reinehr et al. [24] did not report
observer variability.
A study on seven adults reported a reduction in MRSmeasured IMCL during 9 weeks of dietary weight loss
intervention [26], while a 12-week dietary weight loss
intervention of 13 non-diabetic obese adults found no
reductions in MRS-measured IMCL [27]. These differences might reflect a considerable variability in the accumulation of fat in muscle tissue, which is also suggested
in the 40 % of the present study participants who shifted
from no muscular steatosis to muscular steatosis, although
we observed a significant majority of the patients shifting
from muscular steatosis to no steatosis (Fig. 2). Furthermore, in ten obese adults, a 6 months weight loss intervention reduced MRS-measured IMCL in the mainly
glycolytic tibialis muscle [28], but not in the mainly oxidative soleus muscle, despite that glycolytic muscles, including the psoas muscle, generally contain lower amounts of
fat as compared to oxidative muscles [29, 30].
Glucose metabolism
Associations between the accumulation of fat in skeletal
muscle and dysregulation of the glucose metabolism have
been reported in both cross-sectional [31] and longitudinal studies [26].
In a weight loss study of seven overweight adults
undergoing dietary intervention alone compared to nine
overweight adults undergoing combined dietary and exercise intervention, Toledo et al. reported comparable
changes in weight loss and insulin sensitivity in the two
groups, while biopsy-proven IMCL was reduced only in
the dietary intervention group [32]. This suggests that
muscle lipid accumulation is independent of insulin sensitivity, which is also suggested in the study by van der
Heijden et al. where insulin sensitivity improved without
reductions in IMCL [22].
The relationship between fatty liver and elevated fasting circulating levels of glucose and insulin has been
reported in cross-sectional studies [4, 5]. In the aforementioned intervention study by van der Heijden et al,
reductions in liver and visceral fat correlated with reductions in circulating insulin concentrations in the
group of obese adolescents [22]. Several longitudinal
studies of reductions in LFC assessed by ultrasound
have shown concomitant improvements in glucose metabolism in 144, 84, 71, and 20 children and adolescents, respectively [23, 33–35], suggesting a positive
Page 7 of 9
association between LFC and insulin resistance. In contrast, Pozzato et al. [21] and Reinehr et al. [24] did not
observe any associations between changes in liver fat
and changes in fasting glucose or insulin levels, despite
comparable sample sizes. In the present study, no reductions were seen in either fasting insulin or glucose,
despite improvements in a range of other metabolic
markers. This is most likely due to a majority of study
participants undergoing puberty during the treatment
period, and the transitory physiological insulin resistance (worsening glucose metabolism) in the pubertal
period that potentially overshadows any improvements
resulting from the treatment [36]. Nonetheless, we did
observe reductions in HbA1c in the present study.
Lipid metabolism
Cross-sectional studies in children and adolescents have
reported positive associations between serum lipid profiles and steatosis in liver [37] and muscle [38]. Longitudinal pediatric studies have shown relationships between
lipid profiles and hepatic steatosis [23] and liver fibrosis
[33] - a complication to hepatic steatosis - although
none of these associations remained significant in
multivariate analyses [23, 33]. In two longitudinal studies on concomitant changes in MFC and serum lipid
variables in adults, no significant associations have been
reported [26, 27]. Although improvements in the general serum lipid profile were observed in the present
study, no significant association to ectopic fat in liver
and muscle were observed.
Relationship between the ectopic fat depots
The deposition of lipids in the ectopic fat depots is
thought to take place when the capacity of the subcutaneous adipose tissue is exceeded [3]. Positive correlations have previously been reported between LFC and
VAT [1, 27, 28], MFC and VAT [2], and between LFC
and MFC [5], suggesting that storage and mobilization
of lipids in these ectopic depots are interconnected.
These findings are in line with results in the present
study, except for the lack of association between LFC
and VAT. In the present study, we furthermore observed
that the changes in ectopic fat content in liver and muscle
were inversely associated with their respective baseline
levels, suggesting that individuals with a higher level of ectopic tissue fat at the baseline exhibited greater reductions
in ectopic fat content during treatment. This observation
may be (partly) explained by the phenomenon ‘regression
towards the mean’.
Biochemical markers of liver function
Changes in LFC have been positively associated with
changes in alanine transaminase and gamma-glutamyl
transferase in childhood obesity treatment [39] of a
Fonvig et al. BMC Pediatrics (2015) 15:196
comparable sample size to the present study. Even
though childhood obesity has been linked to fatty liver
[40] and elevated concentrations of liver enzymes [41],
the measures of variables serving as proxies for liver
function may deviate from and potentially underestimate
pathological histological alterations in the liver [42]. In
line with the latter, we observed no relationships between liver fat changes and baseline or follow-up levels
of liver function markers.
Strengths and limitations
A strength of the present protocol is the relatively high
number of participants with simultaneous MRS-assessed
fat content in liver and muscle and concomitant measures of anthropometrics and pertinent fasting biochemical blood variables measured before and after a 1-year
treatment period in a best-practice based multidisciplinary regimen focused at combating childhood obesity.
One of the major limitations of our study is that not
all measures of biochemistry were assessed on the same
day as the MR scan, hereby allowing natural day-to-day
biological variations to affect the results. Additionally,
most of the MR scans were performed after the start of
intervention, which may have caused an underestimation
of the ectopic fat reducing effect of treatment.
Furthermore, a large part of the children and adolescents assessed by MRS twice were excluded due to
the 60 days limit criterion, why the presented data
might be subject to a selection bias; e.g. that the
study participants might have been more compliant
to the treatment protocol than the excluded children
and adolescents. Unfortunately, such exclusion is difficult to avoid in a study based on data from clinical
practice, and the proposed time limit is important in
order to justify concomitant changes within the data.
Since the two groups were comparable in body composition both before and after treatment, we considered this selection bias acceptable.
Other limitations include that the sample size and the
small changes in LFC may cause associations in regression analyses to be missed, and that the analyses of associations were made without adjusting for multiple testing,
which increases the chance of type I errors. Furthermore,
pubertal developmental stage was only assessed at baseline
and not at follow-up.
Conclusions
Reductions in magnetic resonance spectroscopy measured
liver and muscle fat are attainable in multidisciplinary
childhood obesity treatment, independent of the magnitude of weight loss and with concomitant improvements
in lipid and glucose metabolism.
Page 8 of 9
Additional file
Additional file 1: STROBE statement for observational studies.
(DOC 85 kb)
Abbreviations
BMI: body mass index; CI: confidence interval; HbA1c: glycosylated
hemoglobin; HDL: high density lipoprotein; IMCL: intramyocellular lipids;
MFC: muscle fat content; MR: magnetic resonance; MRI: magnetic resonance
imaging; MRS: magnetic resonance spectroscopy; SAT: subcutaneous adipose
tissue; SDS: standard deviation score; VAT: visceral adipose tissue.
Competing interests
None of the authors have any financial relationships relevant to this article to
disclose and all authors disclose no conflicts of interests.
Authors’ contributions
CEF (MD) drafted the initial manuscript, contributed to the collection, analysis,
and interpretation of the data, and approved the final manuscript as submitted.
EC (PhD) contributed to the collection and interpretation of the data, critically
revised the manuscript, and approved the final manuscript as submitted. JDO
(MS) and LAN (MS) contributed to the drafting and revisions of the manuscript,
contributed to the analysis and interpretation of the data, and approved the
final manuscript as submitted. Professor OP (MD, DMSc) and Professor TH (MD,
PhD) contributed to the analysis and interpretation of the data, critically revised
the manuscript, and approved the final manuscript as submitted. Professor HST
(MD, DMSc) was responsible for the design of the study, contributed to the
interpretation of the data, critically revised the manuscript, and approved the
final manuscript as submitted. J-CH (MD, PhD) conceptualized the study,
was responsible for the design of the study, established The Children’s
Obesity Clinic, contributed to the collection and the interpretation of the
data, critically revised the manuscript, and approved the final manuscript
as submitted. J-CH, TH, and OP established The Danish Childhood Obesity
Biobank. All authors agreed to be accountable for all aspects of the work.
Acknowledgements
This study was funded by The Region Zealand Health and Medical Research
Foundation and the Danish Innovation Foundation (grant 0603-00484B) and
was part of the research activities of the Danish Childhood Obesity Biobank,
as well as of the TARGET research initiative (The impact of our genomes on
individual treatment response in obese children) />research-project-sites/target/, and BIOCHILD (Genetics and systems biology of
childhood obesity in India and Denmark) The authors
wish to thank Mrs Oda Troest and Mrs Birgitte Holløse for expert technical
assistance, Michael Gamborg for statistical support, and all the participating children and adolescents including their families.
Author details
1
The Children’s Obesity Clinic, Department of Pediatrics, Copenhagen
University Hospital Holbæk, 4300 Holbæk, Denmark. 2The Novo Nordisk
Foundation Center for Basic Metabolic Research, Section of Metabolic
Genetics, Faculty of Medical and Health Sciences, University of Copenhagen,
2100 Copenhagen Ø, Denmark. 3Department of Diagnostic Radiology,
Copenhagen University Hospital Herlev, 2730 Herlev, Denmark. 4University of
Copenhagen, Faculty of Medical and Health Sciences, 2200 Copenhagen N,
Denmark.
Received: 10 March 2015 Accepted: 24 November 2015
References
1. Bille DS, Chabanova E, Gamborg M, Fonvig CE, Nielsen TRH, Thisted E, et al.
Liver fat content investigated by magnetic resonance spectroscopy in
obese children and youths included in multidisciplinary treatment. Clin
Obes. 2012;2:41–9.
2. Fonvig CE, Bille DS, Chabanova E, Nielsen TRH, Thomsen HS, Holm JC.
Muscle fat content and abdominal adipose tissue distribution investigated
by magnetic resonance spectroscopy and imaging in obese children and
youths. Pediatr Rep. 2012;4:e11.
Fonvig et al. BMC Pediatrics (2015) 15:196
3.
4.
5.
6.
7.
8.
9.
10.
11.
12.
13.
14.
15.
16.
17.
18.
19.
20.
21.
22.
23.
24.
25.
26.
27.
Lionetti L, Mollica MP, Lombardi A, Cavaliere G, Gifuni G, Barletta A. From
chronic overnutrition to insulin resistance: the role of fat-storing capacity
and inflammation. Nutr Metab Cardiovasc Dis. 2009;19:146–52.
Schwimmer JB, Pardee PE, Lavine JE, Blumkin AK, Cook S. Cardiovascular risk
factors and the metabolic syndrome in pediatric nonalcoholic fatty liver
disease. Circulation. 2008;118:277–83.
Larson-Meyer DE, Newcomer BR, Ravussin E, Volaufova J, Bennett B, Chalew
S, et al. Intrahepatic and intramyocellular lipids are determinants of insulin
resistance in prepubertal children. Diabetologia. 2011;54:869–75.
Feldstein AE, Charatcharoenwitthaya P, Treeprasertsuk S, Benson JT, Enders
FB, Angulo P. The natural history of non-alcoholic fatty liver disease in
children: a follow-up study for up to 20 years. Gut. 2009;58:1538–44.
Sinha R, Dufour S, Petersen KF, LeBon V, Enoksson S, Ma Y-Z, et al. Assessment
of skeletal muscle triglyceride content by (1)H nuclear magnetic resonance
spectroscopy in lean and obese adolescents: relationships to insulin sensitivity,
total body fat, and central adiposity. Diabetes. 2002;51:1022–7.
Pan DA, Lillioja S, Kriketos AD, Milner MR, Baur LA, Bogardus C, et al. Skeletal
muscle triglyceride levels are inversely related to insulin action. Diabetes.
1997;46:983–8.
Reaven GM. Role of insulin resistance in human disease. Diabetes. 1988;37:
1595–607.
Thomas EL, Fitzpatrick JA, Malik SJ, Taylor-Robinson SD, Bell JD. Whole body
fat: Content and distribution. Prog Nucl Magn Reson Spectrosc. 2013;73:56–80.
Ligabue G, Besutti G, Scaglioni R, Stentarelli C, Guaraldi G. MR quantitative
biomarkers of non-alcoholic fatty liver disease: technical evolutions and
future trends. Quant Imaging Med Surg. 2013;3:192–5.
El-Badry AM, Breitenstein S, Jochum W, Washington K, Paradis V, RubbiaBrandt L, et al. Assessment of hepatic steatosis by expert pathologists: the
end of a gold standard. Ann Surg. 2009;250:691–7.
Alisi A, Locatelli M, Nobili V. Nonalcoholic fatty liver disease in children. Curr
Opin Clin Nutr Metab Care. 2010;13:397–402.
Mitchel EB, Lavine JE. Review article: the management of paediatric
nonalcoholic fatty liver disease. Aliment Pharmacol Ther. 2014;40:1155–70.
Holm J-C, Gamborg M, Bille DS, Grønbæk HN, Ward LC, Færk J. Chronic care
treatment of obese children and adolescents. Int J Pediatr Obes. 2011;6:188–96.
Nielsen TRH, Gamborg M, Fonvig CE, Kloppenborg J, Hvidt KN, Ibsen H,
et al. Changes in lipidemia during chronic care treatment of childhood
obesity. Child Obes. 2012;8:533–41.
Nysom K, Mølgaard C, Hutchings B, Michaelsen KF. Body mass index of 0 to
45-y-old Danes: reference values and comparison with published European
reference values. Int J Obes Relat Metab Disord. 2001;25:177–84.
Cole TJ, Green PJ. Smoothing reference centile curves: the LMS method and
penalized likelihood. Stat Med. 1992;11:1305–19.
Tanner JM. Growth and maturation during adolescence. Nutr Rev. 1981;39:
43–55.
Schwimmer JB, Deutsch R, Kahen T, Lavine JE, Stanley C, Behling C.
Prevalence of fatty liver in children and adolescents. Pediatrics. 2006;118:
1388–93.
Pozzato C, Verduci E, Scaglioni S, Radaelli G, Salvioni M, Rovere A, et al. Liver
fat change in obese children after a 1-year nutrition-behavior intervention. J
Pediatr Gastroenterol Nutr. 2010;51:331–5.
Van der Heijden G-J, Wang ZJ, Chu ZD, Sauer PJJ, Haymond MW, Rodriguez
LM, et al. A 12-week aerobic exercise program reduces hepatic fat
accumulation and insulin resistance in obese, Hispanic adolescents. Obesity
(Silver Spring). 2010;18:384–90.
Koot BGP, van der Baan-Slootweg OH, Tamminga-Smeulders CLJ, Rijcken
THP, Korevaar JC, van Aalderen WM, et al. Lifestyle intervention for nonalcoholic fatty liver disease: prospective cohort study of its efficacy and
factors related to improvement. Arch Dis Child. 2011;96:669–74.
Reinehr T, Schmidt C, Toschke AM, Andler W. Lifestyle intervention in obese
children with non-alcoholic fatty liver disease: 2-year follow-up study. Arch
Dis Child. 2009;94:437–42.
Schwenzer NF, Springer F, Schraml C, Stefan N, Machann J, Schick F. Noninvasive assessment and quantification of liver steatosis by ultrasound,
computed tomography and magnetic resonance. J Hepatol. 2009;51:433–45.
Petersen KF, Dufour S, Morino K, Yoo PS, Cline GW, Shulman GI. Reversal of
muscle insulin resistance by weight reduction in young, lean, insulinresistant offspring of parents with type 2 diabetes. Proc Natl Acad Sci. 2012;
109:8236–40.
Sato F, Tamura Y, Watada H, Kumashiro N, Igarashi Y, Uchino H, et al. Brief
report: Effects of diet-induced moderate weight reduction on intrahepatic
Page 9 of 9
28.
29.
30.
31.
32.
33.
34.
35.
36.
37.
38.
39.
40.
41.
42.
and intramyocellular triglycerides and glucose metabolism in obese
subjects. J Clin Endocrinol Metab. 2007;92:3326–9.
Thomas EL, Brynes AE, Hamilton G, Patel N, Spong A, Goldin RD, et al. Effect
of nutritional counselling on hepatic, muscle and adipose tissue fat content
and distribution in non-alcoholic fatty liver disease. World J Gastroenterol.
2006;12:5813–9.
Alasnier C, Rémignon H, Gandemer G. Lipid characteristics associated with
oxidative and glycolytic fibres in rabbit muscles. Meat Sci. 1996;43:213–24.
Malenfant P, Joanisse DR, Thériault R, Goodpaster BH, Kelley DE, Simoneau
JA. Fat content in individual muscle fibers of lean and obese subjects. Int J
Obes Relat Metab Disord. 2001;25:1316–21.
Weiss R, Dufour S, Taksali SE, Tamborlane WV, Petersen KF, Bonadonna RC,
et al. Prediabetes in obese youth: a syndrome of impaired glucose
tolerance, severe insulin resistance, and altered myocellular and abdominal
fat partitioning. Lancet. 2003;362:951–7.
Toledo FGS, Menshikova EV, Azuma K, Radiková Z, Kelley CA, Ritov VB, et al.
Mitochondrial capacity in skeletal muscle is not stimulated by weight loss
despite increases in insulin action and decreases in intramyocellular lipid
content. Diabetes. 2008;57:987–94.
Nobili V, Marcellini M, Devito R, Ciampalini P, Piemonte F, Comparcola D,
et al. NAFLD in children: A prospective clinical-pathological study and effect
of lifestyle advice. Hepatology. 2006;44:458–65.
Grønbæk H, Lange A, Birkebæk NH, Holland-Fischer P, Solvig J, Hørlyck A,
et al. Effect of a 10-week Weight Loss Camp on Fatty Liver Disease and
Insulin Sensitivity in Obese Danish Children. J Pediatr Gastroenterol Nutr.
2012;54:223–8.
Tang Q, Ruan H, Tao Y, Zheng X, Shen X, Cai W. Effects of a summer
program for weight management in obese children and adolescents in
Shanghai. Asia Pac J Clin Nutr. 2014;23:459–64.
Moran A, Jacobs DR, Steinberger J, Hong CP, Prineas R, Luepker R, et al.
Insulin resistance during puberty: Results from clamp studies in 357
children. Diabetes. 1999;48:2039–44.
Papandreou D, Karabouta Z, Rousso I. Are dietary cholesterol intake and
serum cholesterol levels related to nonalcoholic fatty liver disease in obese
children? Cholesterol 2012. doi:10.1155/2012/572820.
Brumbaugh DE, Crume TL, Nadeau K, Scherzinger A, Dabelea D.
Intramyocellular lipid is associated with visceral adiposity, markers of insulin
resistance, and cardiovascular risk in prepubertal children: the EPOCH study.
J Clin Endocrinol Metab. 2012;97:E1099–1105.
Verduci E, Pozzato C, Banderali G, Radaelli G, Arrizza C, Rovere A, et al.
Changes of liver fat content and transaminases in obese children after 12months nutritional intervention. World J Hepatol. 2013;5:505–12.
Fonvig CE, Chabanova E, Andersson EA, Ohrt JD, Pedersen O, Hansen T,
et al. 1H-MRS Measured Ectopic Fat in Liver and Muscle in Danish Lean and
Obese Children and Adolescents. PLoS One. 2015;10:e0135018.
Strauss RS, Barlow SE, Dietz WH. Prevalence of abnormal serum
aminotransferase values in overweight and obese adolescents. J Pediatr.
2000;136:727–33.
Molleston JP, Schwimmer JB, Yates KP, Murray KF, Cummings OW, Lavine JE,
et al. Histological abnormalities in children with nonalcoholic fatty liver
disease and normal or mildly elevated alanine aminotransferase levels. J
Pediatr. 2014;164:707–713.e3.
Submit your next manuscript to BioMed Central
and we will help you at every step:
• We accept pre-submission inquiries
• Our selector tool helps you to find the most relevant journal
• We provide round the clock customer support
• Convenient online submission
• Thorough peer review
• Inclusion in PubMed and all major indexing services
• Maximum visibility for your research
Submit your manuscript at
www.biomedcentral.com/submit