Dose of early intervention treatment during children’s first 36 months of life is associated with developmental outcomes: An observational cohort study in three low/low-middle income
Bạn đang xem bản rút gọn của tài liệu. Xem và tải ngay bản đầy đủ của tài liệu tại đây (460.59 KB, 11 trang )
Wallander et al. BMC Pediatrics 2014, 14:281
/>
RESEARCH ARTICLE
Open Access
Dose of early intervention treatment during
children’s first 36 months of life is associated with
developmental outcomes: an observational
cohort study in three low/low-middle income
countries
Jan L Wallander1*, Fred J Biasini2, Vanessa Thorsten3, Sangappa M Dhaded4, Desiree M de Jong5, Elwyn Chomba6,
Omrana Pasha7, Shivaprasad Goudar4, Dennis Wallace3, Hrishikesh Chakraborty8, Linda L Wright9,
Elizabeth McClure3 and Waldemar A Carlo10
Abstract
Background: The positive effects of early developmental intervention (EDI) on early child development have been
reported in numerous controlled trials in a variety of countries. An important aspect to determining the efficacy of
EDI is the degree to which dosage is linked to outcomes. However, few studies of EDI have conducted such analyses.
This observational cohort study examined the association between treatment dose and children’s development when
EDI was implemented in three low and low-middle income countries as well as demographic and child health factors
associated with treatment dose.
Methods: Infants (78 males, 67 females) born in rural communities in India, Pakistan, and Zambia received a
parent-implemented EDI delivered through biweekly home visits by trainers during the first 36 months of life.
Outcome was measured at age 36 months with the Mental (MDI) and Psychomotor (PDI) Development Indices of the
Bayley Scales of Infant Development-II. Treatment dose was measured by number of home visits completed and
parent-reported implementation of assigned developmental stimulation activities between visits. Sociodemographic,
prenatal, perinatal, and child health variables were measures as correlates.
Results: Average home visits dose exceeded 91% and mothers engaged the children in activities on average
62.5% of days. Higher home visits dose was significantly associated with higher MDI (mean for dose quintiles 1–2
combined = 97.8, quintiles 3–5 combined = 103.4, p = 0.0017). Higher treatment dose was also generally associated
with greater mean PDI, but the relationships were non-linear. Location, sociodemographic, and child health variables
were associated with treatment dose.
Conclusions: Receiving a higher dose of EDI during the first 36 months of life is generally associated with better
developmental outcomes. The higher benefit appears when receiving ≥91% of biweekly home visits and program
activities on ≥67% of days over 3 years. It is important to ensure that EDI is implemented with a sufficiently high dose
to achieve desired effect. To this end groups at risk for receiving lower dose can be identified and may require special
attention to ensure adequate effect.
Keywords: Treatment dose, Early developmental intervention, Neurodevelopmental disability, Birth asphyxia,
Developing countries
* Correspondence:
1
Psychological Sciences and Health Sciences Research Institute, University of
California, Merced, CA, USA
Full list of author information is available at the end of the article
© 2014 Wallander et al.; licensee BioMed Central Ltd. This is an Open Access article distributed under the terms of the Creative
Commons Attribution License ( which permits unrestricted use, distribution, and
reproduction in any medium, provided the original work is properly credited. The Creative Commons Public Domain
Dedication waiver ( applies to the data made available in this article,
unless otherwise stated.
Wallander et al. BMC Pediatrics 2014, 14:281
/>
Background
Programs of early developmental intervention (EDI)
implemented in the first years of life in children born
with, or at risk for, neurodevelopmental disability have
been shown to improve cognitive developmental outcomes and consequently, their quality of life. EDI
includes various activities designed to enhance a young
child’s development, directly via structured experiences
and/or indirectly through influencing the care giving
environment [1]. The positive effects of EDI on early
child development have been reported in numerous
controlled trials in high-income countries [2,3], which
have been confirmed through meta-analyses [4,5] and
expert reviews [6-8]. Several trials of EDI with risk
groups of infants and young children have also been
conducted in low or low-middle income countries
(L/LMIC), which have also documented positive effects
on child development, by itself or in combination with
nutritional supplementation [9-16].
The involvement of parents in EDI is critical for
achieving positive outcomes [1,17-19], which can be
optimized by implementing EDI through home visits by
a parent trainer. This modality also matches well the
circumstances of many L/LMIC where families often live
far away from or have other barriers to reach providers
that could implement EDI [20]. An important aspect to
determining the efficacy of EDI is the degree to which
dosage impacts outcomes, and what constitutes “sufficient
dosage” [21]. Sufficient dosage with regard to EDI refers
to a participant receiving adequate exposure to the
intervention for it to be efficacious. Program intensity,
or dosage, typically is measured by the quantity and
quality the intervention actually achieved when implemented [21,22], although it ideally should be determined based on the needs of the population at hand
[23]. Common indicators of dosage for EDI include
amount of time spent in a child development center,
number of home visits completed by a specialist training a
parent and/or engaging the child, or some indication of
parent engagement in the EDI.
Whereas there is more information linking outcomes
with treatment dose for pre-school programs [21,22],
despite its importance few studies of EDI implemented
in the first three years of life have conducted such
analyses. A few previous studies generally indicate that
children who receive more exposure to EDI display
greater improvements in their cognitive development
compared to those who receive less, even when differences in exposure were modest. Specifically, children
who received EDI (home and center based) for more
than 400 days, through age 3, exhibited significant
improvements in cognitive development, while smaller
but similar effects were evident among children who
received treatment between 350 and 400 days [24].
Page 2 of 11
Another study reported that optimal cognitive development of children in EDI was not associated with their
background characteristics, such as birth weight or maternal education, but with three aspects related to treatment
dosage: number of home visits received, days attending
child care, and number of parent meetings attended [18].
However these studies as well as the broader discussions of implementation quality have focused on programs conducted in the United States [21,22]. The
applicability of this information to L/LMIC contexts is
unclear at present. The only EDI treatment dose study
conducted in a L/LMIC that we are aware of showed
that, as the frequency of home visits increased from
none, through monthly, biweekly, and weekly, developmental gains at 30 months of age increased as well [25].
Given the potential for EDI to significantly impact the
development of children, and therefore the economic
development of nations in the long-term [26], it will be
important more broadly to examine treatment dose in
L/LMIC to inform the implementation of such efforts
on a larger scale.
Parents may vary in their level of participation in
home visit EDI programs due to a variety of factors.
Previous research has indicated higher treatment dose
among families participating in EDI who have better
financial and social resources [20,27-30]. Perinatal, neonatal, and other child health characteristics might also
predict treatment dose for an intervention intending to
promote the child’s development. Yet, studies that have
examined both social and health predictors of EDI treatment dose are rare and have not considered a broad range
of possible predictors [15]. It is important to examine
various such factors in L/LMIC because they can identify processes that may influence parents’ adherence
with EDI and those who may need additional support.
In light of these gaps in our understanding, the aim
of the current study was to determine (1) whether there
is a dose effect in a home visiting EDI implemented
in three L/LMIC and (2) what sociodemographic and
health factors are associated with variation in treatment
dose. We examined two indicators of dose of EDI. As
in previous studies, the number of home visits completed over the course of the EDI was measured.
Another important treatment element is the extent to
which parents implement the assigned developmental
activities with the child during the time between home
visits, which we refer to as the program implementation dose. Despite its logical importance to the success
of home visiting EDI, we are not aware that parent program implementation dose has been examined in EDI.
We hypothesize that increased dose as measured by
either indicator will be associated with better developmental outcomes from EDI when implemented in three
L/LMIC.
Wallander et al. BMC Pediatrics 2014, 14:281
/>
Methods
Data used to examine the association between treatment
adherence and developmental outcomes are from one
of the conditions of the Brain Research to Ameliorate
Impaired Neurodevelopment - Home-based Intervention
Trial (BRAIN-HIT), a randomized controlled trial (RCT)
detailed elsewhere (clinicaltrials.gov ID# NCT00639184)
[31,32]. Implemented in rural communities of India,
Pakistan, and Zambia, the overall aim of BRAIN-HIT
was to evaluate the efficacy of an EDI program on the
development of children in L/LMIC who are at-risk for
neurodevelopmental disability due to birth asphyxia that
required resuscitation. A group of children who did not
require resuscitation at birth was evaluated using the
same protocol to compare the efficacy of the EDI in
those with and without birth asphyxia.
As detailed elsewhere [32,33], mental development at
36 months of age was better in children with birth
asphyxia who had received the EDI compared with those
in the control condition (effect size = 4.6 points on the
standardized scale from the Bayley Scales of Infant
Development, see below), but there was no difference
between trial conditions in the children without birth
asphyxia. Psychomotor development was likewise higher
in the EDI group, in this case for both the children with
(effect size = 5.4) and without (effect size = 6.1) birth
asphyxia, compared to those in the control condition.
The issue of the effect of treatment dose on development is only relevant for the active EDI condition, and
not the comparison condition, which intended to control
for placebo, observation, and time effects and lacked a
theoretically based developmental intervention. Therefore, only data from those randomized to receive EDI
were analyzed in the present research, making this an
observational study of that cohort. BRAIN-HIT was
approved by the Institutional Review Board at each site
and was conducted in accord with prevailing ethical
principles.
Page 3 of 11
planning to stay in the study area for the next three
years. Birth asphyxia was defined as the inability to
initiate or sustain spontaneous breathing at birth using
WHO definition (biochemical evidence of birth asphyxia
could not be obtained in these settings) [36]. A list of
potential enrollees was distributed to the investigators
in each country to obtain written consent for the study,
which was obtained during the second week after birth
and before randomization to intervention conditions of
the BRAIN-HIT.
Intervention procedures
Investigators at each research site selected EDI parent
trainers who were trained in an initial 5-day workshop,
which was led by the same experts at each research site.
A second workshop was conducted before participating
children began to reach 18 months of age to adapt the
approach to children up to 36 months, again conducted
by the same experts at each site. To maintain quality of
implementation, the trainers were supervised with observations during actual home visits and constructive feedback was provided on a regular basis.
Each parent–child pair was assigned to the same trainer
throughout the trial whenever possible, who was scheduled
to make a home visit every two weeks over the 36-month
trial period. As elaborated elsewhere [31,32], the trainer
presented one or two playful learning activities during
each visit targeting developmentally appropriate milestones. These activities cover a spectrum of abilities
across the cognitive, social and self-help, gross and fine
motor, and language domains. The parent practiced the
activity in the presence of the trainer who provided
feedback. Cards depicting the activities were then left with
the parent, who was encouraged to apply the activities in
daily life with the child until the next home visit. The
trainer introduced new activities in subsequent visits to
enhance the child’s developmental competencies.
Treatment dose indicators
Study population
Infants with birth asphyxia (resuscitated) and infants
without birth asphyxia or other perinatal complications
(non-resuscitated), born from January 2007 through June
2008 in rural communities in three sites in India, Pakistan
and Zambia, were matched for country and chronological
time and randomly selected from those enrolled in the
First Breath Trial [34]. Infants were screened for enrollment into the BRAIN-HIT during the 7-day follow-up
visit after birth [31], and were ineligible if: (1) birth weight
was less than 1500 grams, (2) neurological examination at
seven days of age (grade III by Ellis classification) [35],
was severely abnormal (because they were not expected to
benefit from EDI), (3) mother was less than 15 years old
or unable/unwilling to participate, or (4) mother was not
Two indicators of treatment dose were calculated. Home
visit dose was measured based on each parent trainer
keeping a record of visit dates. Following the first visit,
visits were scheduled to occur every two weeks until the
completion of the trial. A home visit was completed on
schedule if it occurred within its assigned two week
window following the preceding visit. We calculated the
percentage of scheduled home visits completed for each
participant for the full 36-month trial. The reason for
each missed visit was coded as due to illness, weather,
death in family, refusal, child or mother unavailable for
another reason, parent trainer schedule conflict, and
other reasons.
Program implementation dose was measured based on
maternal report obtained by the trainer at each home
Wallander et al. BMC Pediatrics 2014, 14:281
/>
visit of the proportion of days the assigned activities had
been implemented since the previous visit. First, the
number of days between subsequent completed visits
was calculated (Yn). If the time between two home visits
extended beyond 30 days, a maximum of 30 days was
used. Program implementation credits were assigned for
the time period between visits based on the mother’s
report of implementation of activities, as follows: “not at
all” (creditn = 1), “about one-quarter of days or less”
(creditn = Yn*.25), “about one-half of days” (creditn =
Yn*.50), “about three-quarters of days” (creditn = Yn*.75),
and “almost every day or more” (creditn = Yn). The
credits were then added together over the trial period,
divided by the number of possible credits, and multiplied by 100. Thus, this score estimates the percent of
days between each home visit that the mother reported
implementing child stimulation activities. As an additional descriptive measure of treatment dose, the parent trainer was surveyed at the conclusion of the study
to estimate how often the activities had been implemented between the home visits, using a five-point scale
(from “never” to “always”).
Developmental outcome measures
The Bayley Scales of Infant Development – II (BSID) [37]
was selected as the main outcome measure for this trial
because it has been used extensively in various L/LMIC.
The BSID underwent pilot-testing at each site to verify
validity in the local context and a few items were
slightly modified to make it more culturally appropriate
(e.g., image of a sandal instead of a shoe). Evaluators
across the sites were trained to standards in joint 4-day
workshops conducted by experts before each yearly
evaluation. The BSID was administered directly to each
child by certified study evaluators, who were masked to
the children’s birth history and randomization, in the
appropriate language with standard material. Both the
Mental Developmental Index (MDI) and Psychomotor
Developmental Index (PDI) were used to measure
developmental outcomes. Scores from the 36-month
assessment, obtained just after the completion of the
EDI, were used in this analysis as an indicator of treatment outcome.
Health and sociodemographic measures
Perinatal and neonatal health variables were obtained from
records kept by the FIRST BREATH Trial [34]: child gender, birth weight (1500 g-2499 g, 2500 g-2999 g, 3000 + g),
gestational age (28–36 weeks, 37+ weeks), number of prenatal visits (0, 1–3, 4+), and parity. Additional child health
variables obtained as part of this trial at 12 months of
age included weight for age/sex (<5th, 5th-14th, 15th +
percentile) and complete immunization status.
Page 4 of 11
Family demographic variables were obtained at enrollment in BRAIN-HIT using a structured parent interview:
maternal age, education (none and illiterate, none but
literate or primary, literate with some secondary), family
assets and home living standard. The presence of 11
family assets (e.g., radio, refrigerator, bicycle) were tallied
as a Family Resources Index and classified into three levels
(0–1, 2–4, 5+). A Home Living Standard Index was
calculated based on seven indicators (e.g., home building
material, water source, type of toilet) and classified into
three levels (0–4, 5–7, 8+). A socio-economic status (SES)
measure was used to classify participants into three groups
(quintile 1–3, 4, 5) [38].
Statistical analysis
Descriptive statistics were computed for child health and
family demographic characteristics, treatment dose indicators (home visits dose and protocol implementation
dose), and developmental outcomes (MDI and PDI at
36-months) for all individuals randomized to receive
EDI. Child health and demographic characteristics were
summarized separately for those randomized to receive
EDI and included in the treatment dose analysis and
those who were excluded from this analysis, and differences in mean values for continuous variables were
tested using t-tests and categorical measures were tested
using chi-square and Fisher exact tests. A Pearson correlation statistic was computed between the treatment
dose characteristics.
Aim 1
In the absence of established criteria for adequate treatment dose for EDI and to determine where the effectiveness of the intervention may plateau, both treatment
dose indicators were divided into quintiles. Those in
quintile 1 had lowest dose and those in quintile 5 had
the highest dose of the indicator in question. Descriptive
statistics for the 36-month MDI and PDI were calculated
for each quintile. General linear models were used to
evaluate the associations of treatment dose quintile
with 36-month MDI and PDI. In addition to the treatment dose indicator in question, covariates of interest
included resuscitation status at birth, 12-month MDI
or PDI, and site. If the omnibus 4-degree of freedom
test for either MDI or PDI provided evidence of significant differences across quintiles of treatment dose,
step-down tests were used to evaluate where those
differences occurred.
Aim 2
To evaluate associations with treatment dose, initially all
sociodemographic and child health variables and trial
location were entered into linear regression models
separately to predict both treatment dose variables.
Wallander et al. BMC Pediatrics 2014, 14:281
/>
Page 5 of 11
Selected for entry in multivariable models were variables that demonstrated P ≤ 0.20 in univariate association with the adherence variable in question when
either adjusted by location alone or location and the
variable by location interaction. We employed backward elimination with an alpha of 0.20 to choose the
final models.
Results
Study sample composition
The sample size was determined to provide adequate
power to test EDI treatment efficacy, the primary aim
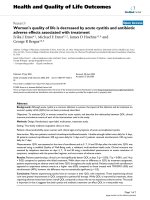
of BRAIN-HIT. As outlined in Figure 1, of 540 births
screened from January 2007 through June 2008, 438
(81% of screened) were eligible. Only 3 infants were
ineligible due to low birth weight or neurological exam,
with the remaining 99 being due to mothers not being
able to commit to staying in the study communities or
could not be reached for screening within 7 days of
birth. Informed consent was obtained for 407 (93% of
eligible; 165 resuscitated, 242 not resuscitated) who
were randomized into either EDI or a control intervention
[20]. The 204 assigned to receive EDI (50.1% of those
randomized) are relevant for this study, of whom 145
(71.1% of those assigned to EDI) were included in this
analysis (Table 1). These participants had mean = 36.8
(range = 35-41) months of age at the time of the developmental assessment.
540 Screened
102 Ineligible
82 mothers not staying in the study communities
17 mothers not contacted within 7 days of birth
3 babies <1500 grams
438 Eligible
407 Consented and Randomized
203 Randomized to control group
204 Randomized to
Early Developmental Intervention
19 Drop outs
7 deaths
6 withdrawals
5 lost to follow-up
1 child’s mother nursing husband out of town
185 Evaluations at 36m
39 BSID-II Incomplete
146 BSID-II Completed
1 missing home visit information
145 provided data for
treatment dose analysis
Figure 1 Study flow chart.
Wallander et al. BMC Pediatrics 2014, 14:281
/>
Page 6 of 11
Table 1 Child health and family demographic characteristics of study sample
Characteristica
Inclusion in analysis - n (%)
Total
p-valueb
–
Yes
No
145
59
204
78/141 (55.3)
34/59 (57.6)
112/200 (56.0)
0.7643
139
59
198
0.1109
1500 - 2499
30 (21.6)
13 (22.0)
43 (21.7)
2500 - 2999
51 (36.7)
30 (50.8)
81 (40.9)
Enrolled - N
Male gender- n/N (%)
Birth weight (grams) - N
≥ 3000
58 (41.7)
16 (27.1)
74 (37.4)
37.9 (2.0)
37.8 (1.9)
37.9 (2.0)
0.7804
Preterm (<37 mos.) - n/N (%)
40/142 (28.2)
16/59 (27.1)
56/201 (27.9)
0.8798
Resuscitated - n/N (%)
59/145 (40.7)
19/59 (32.2)
78/204 (38.2)
0.2581
0.0151
Gestational age-mean (std)
Prenatal care visits-N
0
145
59
204
35 (24.1)
4 (6.8)
39 (19.1)
1-3
48 (33.1)
22 (37.3)
70 (34.3)
4 or more
62 (42.8)
33 (55.9)
95 (46.6)
Weight for age and sex at 12 mos-N
137
43
180
<5th % tile for age in months
40 (29.2)
20 (46.5)
60 (33.3)
5th-14th % tile for age in months
16 (11.7)
7 (16.3)
23 (12.8)
> = 15th % tile for age in months
81 (59.1)
16 (37.2)
97 (53.9)
106/142 (74.6)
41/43 (95.3)
147/185 (79.5)
0.0032
25.5 (5.7)
24.3 (4.0)
25.1 (5.3)
0.0844
0.5144
Immunization complete 12 mos-n/N (%)
Maternal Age (Years)- Mean (Std)
Maternal schooling completed-N
None and illiterate
136
58
194
68 (50.0)
25 (43.1)
93 (47.9)
0.0407
Literate or primary schooling
36 (26.5)
20 (34.5)
56 (28.9)
Literate and some secondary schooling
32 (23.5)
13 (22.4)
45 (23.2)
3.1 (2.2)
2.4 (1.3)
2.9 (2.0)
0.0110
145
59
204
<.0001
0-1
55 (37.9)
11 (18.6)
66 (32.4)
2-4
49 (33.8)
40 (67.8)
89 (43.6)
5+
41 (28.3)
8 (13.6)
49 (24.0)
Parity (including child enrolled in study) - Mean (Sd)
Family Resources Index (# items present in home) - N
a
Measured at enrollment unless otherwise indicated.
b
Differences in mean values for continuous variables were tested using t-tests and categorical measures were tested using chi-square and Fisher exact tests;
bold indicates significant p < .05.
Exclusions from this analysis were due to death (n = 7),
withdrawal (n = 6), loss to follow up (n = 5), incomplete
36-month BSID-II (n = 39) due to administration errors,
home-visit data unavailable (n = 1), or another reason
(n = 1). Three children were included in the analysis
who completed the 36-month evaluation but discontinued the EDI prior to the end of the study (two because
the family had insufficient time to fulfill study requirements and one because the family moved). When compared to those who were included in the analysis
(Table 1), children excluded (n = 59) were significantly
(p < .05) more likely to have been less than the 5th percentile in weight and completed all immunizations at
12-months of age, and their mothers to have had prenatal care, lower parity, and more family resources.
Description of developmental outcomes and treatment
dose
The sample had an unadjusted mean (SD) MDI = 101.2
(10.4) and PDI = 106.8 (14.1) at 36-months. Average
home visits dose was 91.4% over 36 months, when 8,990
visits out of 9,841 were completed on schedule every
two weeks, and 95% of the participants achieved 80% or
greater home visits dose. The most common reason for
a missed visit was the inability to locate the mother and
child at home at the scheduled time (40.3%), for example
because the family was travelling away from the home
or had moved temporarily. However, the second most
common reason was those related to the parent trainer,
such as being ill or having a conflict with another meeting
(23.9%). Child or mother unavailable for other reasons
Wallander et al. BMC Pediatrics 2014, 14:281
/>
Page 7 of 11
(15.3%), for example because the mother was working or
baby was sleeping, and weather (10.0%) were the only
other reasons accounting for at least 10% of the missed
visits. Mother or family directly refusing the home visit at
the scheduled time was rare (2.5%).
Mothers reported engaging the child in the assigned
activities on an average of 62.5% of days throughout the
36 month period. This protocol implementation dose
equates to practicing the intervention activities 4.4 days
per week or 674 days over the 36 month trial period.
Home visits dose was modestly correlated with protocol
implementation dose (r = 0.35). Parent trainers estimated at the end of the trial that 66.2% of families practiced the intervention “always” or “almost always”
throughout the 36 months.
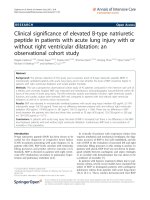
Associations between treatment dose and developmental
outcomes
Higher home visits dose was associated with higher MDI
at 36-months (Figure 2). Specifically, quintiles 1–2 mean
MDI = 98, while quintiles 3–5 mean MDI = 103 (Table 2).
General linear models of MDI supported this relationship when home visits dose was entered as a primary
A
B
MDI by home visits dose quintiles
120
120
99.0
101.0
97.8
100
105.0
103.5
105.0
103.5
103.1
103.0
97.9
80
100
105.0
108.5
102.9
102.6
Median
60
109.0
108.7
Mean
Median
60
1
2
3
4
Home Visits Dose Quintiles
40
5
1
2
3
4
5
Home Visits Dose Quintiles
D
MDI by program implementation dose quintiles
MDI
140
PDI by program implementation dose quintiles
PDI
140
120
120
112.0
101.0
100.0
100
103.0
99.0
98.0
101.2
105.0
104.4
105.0
102.2
80
107.4
100
109.6
105.4
104.0
105.0
103.6
109.0
108.1
109.0
80
Mean
Median
60
40
112.0
111.4
109.0
108.5
80
Mean
C
PDI by home visits dose quintiles
PDI
140
MDI
140
40
predictor and site, resuscitation status at birth, and 12month MDI were entered as covariates (Table 2). Most
notably, in the model with only home visits dose (Model
1) and the model which included site (Model 2), mean
MDI for quintiles 1 and 2 was significantly lower than
quintiles 3–5. A step-down test comparing mean MDI
for those with home visit dose below the 40th percentile
(quintiles 1 and 2) to those with home visit dose above
the 40th percentile (quintiles 3–5), provided estimates of
97.8 and 103.4 (p = 0.0017), respectively . Adjusting by
site increased the magnitude of the difference by at least
25% (96.8 vs. 103.9, p = 0.0005). When adjusting for 12month MDI and the interaction between dose and 12month MDI (Model 5), the adjusted mean scores for the
dose quintiles mirrored unadjusted scores, with quintiles
1–2 consistently lower than quintiles 3–5 (p <0.0001).
The lower limit for quintile 3 includes those receiving a
minimum of 91% of all the planned home visits.
Based on the same general linear model analysis
(Table 2), home visit dose was not significantly associated with PDI at 36 months when considered by itself
(Model 1) or when adjusted by site, resuscitation status,
and 12-month PDI (Models 2–4). However, there was a
Mean
Median
60
1
2
3
4
Program Implementation Dose Quintiles
5
40
1
2
3
4
Program Implementation Dose Quintiles
Figure 2 Mental (MDI) and Psychomotor (PDI) Development Index by treatment dose quintiles.
5
Wallander et al. BMC Pediatrics 2014, 14:281
/>
Page 8 of 11
Table 2 Treatment dose modeling results and mean mental (MDI) and psychomotor (PDI) developmental index by
quintiles
Outcome
MDI
Dose indicator
Home Visits Dose
Model
number
Covariates
p-values
Dosea
Home Visits Dose
Program Implemen-tation Dose
Program Implemen-tation Dose
Q3
Q4
Q5
97.9
103.5
103.5
103.1
0.0443
2
Site
0.0150
0.2159
96.3
97.0
103.3
104.4
104.2
3
Resuscitation
0.0802
0.5155
98.1
98.1
103.5
103.4
103.2
4
12 Mo MDI
0.0296
<0.0001
98.3
97.6
102.8
103.8
103.4
5
12 Mo MDI
<0.0001
<0.0001
98.6
97.4
103.4
103.6
103.1
1
–
0.0669
102.9
102.6
108.5
111.4
108.7
2
Site
0.0823
0.1692
102.9
102.2
109.0
112.2
108.7
3
Resuscitation
0.1160
0.5346
103.3
102.9
108.5
111.3
108.7
4
12 Mo PDI
0.2588
0.0024
104.2
103.0
108.4
110.2
108.1
5
12 Mo PDI
0.0030
0.0421
106.5
103.3
108.5
111.0
109.4
1
–
0.1901
100.0
98.0
101.2
104.4
102.2
2
Site
0.2016
0.8523
100.0
98.0
101.8
104.5
102.0
3
Resuscitation
0.2225
0.2338
100.1
98.4
101.5
104.6
102.4
4
12 Mo MDI
0.2661
<0.0001
100.3
98.4
100.9
103.5
103.0
5
12 Mo MDI
0.0434
0.0005
100.1
98.3
100.9
105.0
103.1
1
–
0.5182
107.4
105.4
103.6
109.6
108.1
2
Site
0.8002
0.3009
107.1
105.8
105.1
109.5
108.0
3
Resuscitation
0.5907
0.2590
107.5
105.9
104.0
109.7
108.2
4
12 Mo PDI
0.7654
0.0007
108.2
105.3
104.7
108.7
107.3
5
12 Mo PDI
0.3491
0.0011
108.6
105.3
105.5
109.6
107.2
<0.0001
0.0135
Interaction
PDI
Q2
97.8
–
Interaction
MDI
Q1
1
Interaction
PDI
Least squares means for quintiles
Covariate
Interaction
0.0641
0.4095
a
Bold indicate significant p < .05 for the relationship between the treatment dose indicator and the developmental outcome.
positive association between home visits dose and 36month PDI when adjusting for the 12-month PDI and
its interaction with dose (Model 5). Here again, a home
visit dose above the 40th percentile (quintiles 3–5) resulted in higher estimated PDI (108.5 – 111.0) compared
with below this percentile (103.3 – 106.5)
Higher program implementation dose was associated
with slightly higher MDI at 36-months compared to
those with a lesser dose. Quintiles 1–2 had a mean MDI
of 100 or lower, while quintiles 4–5 has a mean MDI of
102 or higher (Table 2), and the difference appears larger
when considering the medians of these quintiles. In a
general linear model of 36-month MDI (Table 2), program
implementation dose was not a significant predictor by itself (Model 1). However, prediction of program implementation dose when adjusting for 12-month MDI and its
interaction with dose (Model 5) indicated that greater
dose was associated with higher MDI (adjusted mean
Q1 = 100.1 vs. Q5 = 103.1, p = 0.0434). PDI at 36 months
was not linearly associated with program implementation
dose (Table 2). Rather, mean PDI across quintiles followed
a U-shape with the highest mean scores for quintiles 1, 4
and 5. The lower limit for quintile 4 includes those implementing activities on 67% of days on average over the trial
period.
Factors associated with treatment dose
The following variables were associated with home visits
dose at P ≤ 0.20 when either adjusted by location or by
the location by variable interaction: maternal education,
parity, family resources, prenatal visits, birth attendant,
1 minute Apgar, preterm birth, and child’s weight at 36months. These variables were entered into a generalized
linear model along with those interaction terms with location that were significant. After backward elimination,
the final model (R2 = .19) included parity (82.9 ± 3.0 [adjusted mean ± standard error] with 1 child, 79.7 ± 2.8
with 2–3 children, and 90.8 ± 3.5 with 4+ children [p =
0.0382]), 1 minute Apgar (86.9 ± 2.6 for <9 and 82.0 ±
2.6 for 9+ [p = 0.1754]), location (adjusted mean ranged
Wallander et al. BMC Pediatrics 2014, 14:281
/>
from 75.6 - 94.1, [p = 0.0019]), preterm [(p = 0.4571) and
preterm by location interaction(p = 0.0020). There was a
substantial difference in relationship to home visits dose
by prematurity across location. Location A had higher
dose for term children (65.8 ± 6.3 for preterm and 85.3 ±
4.0 for term). Location B had essentially the same dose between groups (92.8 ± 5.9 for preterm and 95.4 ± 2.9 for
term). Location C had considerably higher dose in preterm children (90.5 ± 4.6 for preterm and 76.9 ± 3.5 for
term).
The following variables were associated with program
implementation dose at P ≤ 0.20 when either adjusted by
location or by the location by variable interaction: home
visit adherence rate, maternal education, parity, family
resources, living standard index, prenatal care, 1 minute
Apgar, preterm birth, and weight at birth, 12, 24, and
36 months. These variables were entered into a model
along with those interaction terms with location that
were significant. After backward elimination and adjusting for location, the final model (R2 = .25) included home
visit adherence rate (a one percent increase in home visit
adherence resulted in a 0.64 ± 0.18 percent increase in
program implementation adherence, p = 0.0004), maternal
education (70.0 ± 2.8 for secondary/university and 60.9 ±
2.4 for none/illiterate [p = 0.0400]), prenatal care (71.0 ±
2.9 for 5+ visits and 65.3 ± 3.5 for no care [p = 0.0170]),
weight at 12 months (66.7 ± 1.7 for >85th percentile and
61.1 ± 2.2 for <5th percentile [p = 0.0917]), and location
(adjusted mean ranged from 59.5 - 69.1, [p = 0.0019]).
None of the interaction terms were retained in the final
model.
Discussion
Consistent with our hypothesis, receiving a higher dose
of EDI during the first 36 months of life, as indicated by
number of home visits by a parent trainer and reported
implementation of program activities between these
home visits, is generally associated with better developmental outcomes at 36 months of age. This benefit is
confirmed more consistently for mental compared to
psychomotor development, and appears to some extent
to be moderated by developmental status at 12 months.
The higher benefit from treatment appears for those receiving at least 91% of the biweekly home visits and program activities on at least 67% of days on the average or
716 days over 36 months. In the context of a general developmental benefit demonstrated to be due to this program of EDI [32,33], the difference in benefit from those
receiving smaller vs. larger treatment doses is modest,
about three to six points on a standardized developmental measure (M = 100, SD = 15). Variation in treatment
dose was associated with child health and family sociodemographic factors as well as by trial location. In particular, more frequent use of the stimulation activities
Page 9 of 11
was reported by better educated mothers who had
already engaged in a schedule of prenatal care and had
infants who reached a higher weight in the first year.
Limitations with this research include that results may
not be generalizable to other L/LMIC or to other types
of EDI programs. Moreover, we do not have independent
observations of the implementation of the program activities at home, either in terms of quantity or quality.
Program implementation dose was measured exclusively
by self-report, which might have been susceptible, for
example, to recall and acquiescence biases. Direct observation, though challenging to use in this context, should
be less biased. Even though this trial of EDI enrolled one
of the largest samples reported in L/LMIC, the sample
size is still modest. This EDI was not intended for severely impaired infants. There was a 29% loss at followup, which included a higher proportion of parents with
better resources. Power to detect significant associations
with treatment dose was quite limited despite that this
trial of EDI enrolled one of the largest samples reported
in L/LMIC. Although a broad range of health factors
were examined for associations with treatment dose, it
would be useful to learn from mothers what other factors possibly influenced their use of the stimulation activities, such as motivation, belief in their efficacy, and
family support. Treatment dose had a limited effect on
psychomotor development, which may reflect that the
EDI was not as successful in addressing development in
these domains or be due to children reaching ceiling effects of the BSID at 36 months of age.
Only a few studies had previously examined whether
dose of EDI during the first three years of life is associated with developmental outcomes. Our findings are
consistent with prior studies that have generally reported
that children who receive more exposure to EDI, however measured, display greater improvements in their
cognitive development [18,21,24,25]. Although only one
of these studies was conducted in a L/LMIC, this too reported modest differences on developmental outcomes
associated with varying home visit dose [19]. Program implementation dose was not examined. Given the differences between the EDI programs for which treatment
dose has been evaluated, countries where implemented,
populations targeted, and how treatment dose has been
operationalized, it is difficult to generalize from this small
body of research. It is impossible yet to establish a minimum effective dose. Given the importance of determining
the efficacy of EDI in L/LMIC, which depends in part on
information about sufficient dose, further research on the
relationship between dose and outcome is much needed.
Evaluations of EDI need to include such analysis to inform
setting minimal targets for effective implementation.
EDI provided via home visiting has quite consistently
shown to promote development in children in L/LMIC
Wallander et al. BMC Pediatrics 2014, 14:281
/>
Page 10 of 11
e.g., [9-16]. Our research has added to this literature by
showing that the same program can do so across quite
different cultures, represented here by India, Pakistan,
and Zambia [32]. Whereas the identical program was
used, for example in terms of the same basic structure
and developmental activities, the social process transpiring in the home visits would naturally vary as a function
of the specific people engaged and their local culture.
One strength of home visiting EDI is that in this manner
it can be both programmatically structured yet culturally
flexible.
of the final manuscript, but had no influence on the analysis and
interpretation of the data or the decision to submit the manuscript.
Conclusions
The body of research in which the current study is embedded quite consistently establishes that within an effective EDI, a higher dose is generally associated with
better developmental outcomes. A large body of research
indicates that EDI can improve early development of
children in L/LMIC. Therefore EDI should be one approach used in L/LMIC to lay the foundation for improving longer-term outcomes of its population and
interrupting intergenerational transmission of poverty
[26]. Yet, for this to be successful, efforts to implement
EDI for children need to ensure that program elements
reach the children at the intended intensity. Groups of
children at risk for receiving lower treatment dose may
require special attention to ensure adequate effect.
Received: 7 October 2014 Accepted: 16 October 2014
Published: 25 October 2014
Competing interests
The authors declare that they have no competing interests.
Authors’ contributions
JW participated in the design of the study, research aims and hypothesis, and
data collection instruments and preparing the initial drafts of the manuscript.
FB participated in the design of the study, research aims and hypothesis, and
data collection instruments and preparing the initial drafts of the manuscript.
SD participated in developing the research aims and hypothesis and data
collection instruments and completed assessments. DD participated in
developing the research aims and hypothesis and preparing the initial drafts of
the manuscript. EB participated in the design of the study and data collection
instruments and monitored data collection at one site. OP participated in the
design of the study and data collection instruments and monitored data
collection at one site. VT managed the data collection and carried out the
analysis. DW and HC conceptualized and carried out the analysis. SG
participated in the design of the study and data collection instruments and
monitored data collection at one site. LW participated in the design of the
study and data collection instruments. EM participated in the design of the
study and data collection instruments and managed the data collection. WC, as
principal investigator, conceptualized and designed the overall study. All
authors critically reviewed and approved the final manuscript.
Acknowledgements
This research were funded in part by grants from the Eunice Kennedy Shriver
National Institute of Child Health and Human Development (NICHD) Global
Network for Women’s and Children’s Health Research (HD034216), the
National Institute of Neurological Disorders and Stroke and NICHD (HD43464,
HD42372, HD40607, and HD40636), the Fogarty International Center
(TW006703), the Children’s of Alabama Centennial Scholar Fund, and the
Perinatal Health and Human Development Research Program and the
Children’s of Alabama Centennial Scholar Fund of the University of Alabama
at Birmingham. The content is solely the responsibility of the authors and
does not necessarily represent the official views of the National Institutes of
Health (NIH); NIH staff contributed to the design of the study and approved
Author details
1
Psychological Sciences and Health Sciences Research Institute, University of
California, Merced, CA, USA. 2Sparks Clinics and Department of Psychology,
University of Alabama at Birmingham, Birmingham, AL, USA. 3Department of
Statistics and Epidemiology, RTI International, Durham, NC, USA. 4KLE
Jawaharlal Nehru Medical College, Belgaum, India. 5University of
Massachusetts Amherst, Amherst, MA, USA. 6University of Zambia, Lusaka,
Zambia. 7Aga Kahn University Medical College, Karachi, Pakistan. 8University
of South Carolina, Columbia, SC, USA. 9the Eunice Kennedy Shriver National
Institute of Child Health and Human Development (NICHD), Bethesda, MD,
USA. 10Department of Pediatrics, University of Alabama at Birmingham,
Birmingham, AL, USA.
References
1. Ramey CT, Ramey SL: Early intervention and early experience. Am Psychol
1998, 53:109–120.
2. Brooks-Gunn J, McCarton CM, Casey PH, McCormick MC, Bauer CR,
Bernbaum JC, Tyson J, Swanson M, Bennet FC, Scott DT, Tonascia J, Meinert
CL: Early intervention in low-birth-weight premature infants. results
through age 5 years from the infant health and development program.
JAMA 1994, 272:1257–1262.
3. Reynolds AJ: Effects of a preschool plus follow-on intervention for
children at risk. Dev Psychol 1994, 30:787–804.
4. Casto G, Mastropieri MA: The efficacy of early intervention programs: a
meta-analysis. Except Child 1986, 52:417–424.
5. Shonkoff JP, Hauser-Cram P: Early intervention for disabled infants and
their families: a quantitative analysis. Pediatr 1987, 80:650.
6. Bennett FC, Guralnick MJ: Effectiveness of developmental intervention in
the first five years of life. Pediatr Clin North Am 1991, 38(6):1513–1528.
7. Spittle AJ, Orton J, Doyle LW, Boyd R: Early developmental intervention
programs post hospital discharge to prevent motor and cognitive
impairments in preterm infants. Cochrane Database Syst Rev 2007, 2, CD005495.
8. Avellar S, Paulsell D, Sama-Miller E, Del Grosso P: Home Visiting Evidence of
Effectiveness Review: Executive Summary. Office of Planning, Research and
Evaluation, Administration for Children and Families, U.S. Department of Health
and Human Services. Washington, DC: 2013. .
9. Bao X, Sun J, Wei S: Early intervention promotes intellectual development
of premature infants: a preliminary report. Early intervention of premature
infants cooperative research group. Chin Med J 1999, 112:520–523.
10. Gardner JM, Walker SP, Powell CA, Grantham-McGregor SM: A randomized
controlled trial of a home-visiting intervention on cognition and behavior
in term low birth weight infants. J Pediatr 2003, 143:634–639.
11. Walker SP, Chang SM, Powell CA, Grantham-McGregor SM: Psychosocial
intervention improves the development of term low-birth-weight
infants. J Nutr 2004, 134:1417.
12. Grantham-McGregor SM, Powel CA, Walker SP, Himes JH: Nutritional
supplementation, psychosocial stimulation and mental development of
stunted children: the Jamaican study. Lancet 1991, 338:1–5.
13. Meeks Gardner JM, Grantham-McGregor SM, Chang SM, Himes JH, Powell
CA: Activity and behavioral development in stunted and nonstunted
children and response to nutritional supplementation. Child Dev 1995,
66:1785–1797.
14. Meeks Gardner JM, Grantham-McGregor SM, Himes J, Chang S: Behaviour
and development of stunted and nonstunted Jamaican children. J Child
Psychol Psychiat 1999, 40:819–827.
15. Walker SP, Chang SM, Powell CA, Grantham-McGregor SM: Effects of early
childhood psychosocial stimulation and nutritional supplementation on
cognition and education in growth-stunted Jamaican children: prospective
cohort study. Lancet 2005, 366(9499):1804–1807.
16. Walker SP, Chang SM, Powell CA, Simonoff E, Grantham-McGregor SM:
Effects of psychosocial stimulation and dietary supplementation in early
childhood on psychosocial functioning in late adolescence: follow-up of
randomised controlled trial. Br Med J 2006, 333:472.
17. Ramey CT, Bryant DM, Wasik BH, Sparling JJ, Fendt KH, La Vange LM: Infant
health and development program for low birth weight, premature
Wallander et al. BMC Pediatrics 2014, 14:281
/>
18.
19.
20.
21.
22.
23.
24.
25.
26.
27.
28.
29.
30.
31.
32.
33.
34.
35.
infants: program elements, family participation, and child intelligence.
Pediatr 1992, 89:454–465.
Blair C, Ramey CT, Hardin JM: Early intervention for low birthweight,
premature infants: participation and intellectual development. Am J Ment
Retard 1995, 99:542–554.
Mahoney G, Boyce G, Fewell RR, Spker D, Wheeden CA: The relationship of
parent–child interaction to the effectiveness of early intervention
services for at-risk children and children with disabilities. Topics Early
Childh Spec Educ 1998, 18:5–17.
de Souza N, Sardessai V, Joshi K, Joshi V, Hughes M: The determinants of
compliance with an early intervention programme for high-risk babies in
India. Child Care Health Dev 2006, 32:63–72.
Wasik BA, Mattera SK, Lloyd CM, Boller K: Intervention dosage in early
childhood care and education: It’s complicated (OPRE Research Brief OPRE
2013–15). Washington, DC: Office of Planning, Research and Evaluation,
Administration for Children and Families, U.S. Department of Health and
Human Services; 2013. />dosage_brief_final_001_0.pdf.
Zaslow M, Anderson R, Redd Z, Wessel J, Tarullo L, Burchinal M: Quality
Dosage, Thresholds, and Features in Early Childhood Settings: A Review of the
Literature, OPRE 2011–5. Washington, DC: Office of Planning, Research and
Evaluation, Administration for Children and Families, U.S. Department of
Health and Human Services; 2010. />opre/quality_review_0.pdf.
Nation M, Crusto C, Wandersman A, Kumpfer KL, Seybolt D, Morrissey-Kane
E, Davino K: What works in prevention: principles of effective prevention
programs. Am Psychol 2003, 58:449–456.
Hill JL, Brooks-Gunn J, Waldfogel J: Sustained effects of high participation
in an early intervention for low-birth-weight premature infants. Dev
Psychol 2003, 39:730–744.
Powell C, Grantham-McGregor S: Home visiting of varying frequency and
child development. Pediatr 1989, 84:157–164.
Grantham-McGregor S, Cheung YB, Cueto S, Glewwe P, Richter L, Strupp B,
the International Child Development Steering group: Child development in
developing countries 1: developmental potential in the first 5 years for
children in developing countries. Lancet 2007, 369:60–70.
Drotar D, Bonner MS: Influences on adherence to pediatric asthma
treatment: a review of correlates and predictors. J Dev Beh Pediatr 2009,
30:574–582.
Dunst CJ, Leet HE, Trivette CM: Family resources, personal well-being, and
early intervention. J Spec Educ 1988, 22:108–116.
Kuchler-O’Shea R, Kritikos EP, Kahn JV: Factors influencing attendance of
children in an early intervention program. Inf-Tod Interv 1999, 9:61–68.
Shin JY, Nhan NV, Lee S-B, Crittenden KS, Flory M, Hong HTD: The effects of
a home-based intervention for young children with intellectual disabilities
in Vietnam. J Intell Disab Res 2009, 53:339–352.
Wallander JL, McClure E, Biasini F, Goudar SS, Pasha O, Chomba E, Shearer
D, Wright L, Thorsten V, Chakraborty H, Dhaded SM, Mahantshetti NS, Bellad
RM, Abbasi Z, Carlo W for the BRAIN-HIT Investigators: Brain Research to
Ameliorate Impaired Neurodevelopment – Home-based Intervention
Trial (BRAIN-HIT). BMC Pediatr 2010, 10:27. />1471-2431/10/27.
Carlo WA, Goudar SS, Pasha O, Chomba E, Wallander JL, Biasini FJ, McClure
EM, Thorsten V, Chakraborty H, Wallace D, Shearer D, Wright L, the Brain
Research to Ameliorate Impaired Neurodevelopment-Home-Based Intervention
Trial Committee, the National Institute of Child Health and Human
Development Global Network for Women’s and Children’s Health
Research Investigators: Randomized trial of early developmental
intervention on outcomes in children after birth asphyxia in
developing countries. J Pediatr 2013, 162:705–712.
Wallander JL, Bann CM, Biasini FJ, Goudar SS, Pasha O, Chomba E, McClure
E, Carlo WA: Development of children at risk for adverse outcomes
participating in early intervention in developing countries: a randomized
controlled trial. J Child Psychol Psychiatry 2014. doi:10.1111/jcpp.12247.
Carlo WA, Goudar SS, Jehan I, Chomba E, Tshefu A, Garces A, Sailajanandan
P, Althabe F, McClure EM, Derman RJ, Goldenberg RL, Bose C, Krebs NF,
Panigrahi P, Buekens P, Chakraborty H, Hartwell TD, Wright LL, First Breath
Study Group: Newborn-care training and perinatal mortality in
developing countries. N Engl J Med 2010, 362:614–623.
Ellis M, Manandhar DS, Manandhar N, Wyatt J, Bolam AJ, Costello AM:
Stillbirths and neonatal encephalopathy in Kathmandu, Nepal: an
Page 11 of 11
estimate of the contribution of birth asphyxia to perinatal mortality in a
low-income urban population. Paediatr Perinat Epidemiol 2000, 14:39–52.
36. WHO: Basic Newborn Resuscitation: A Practical Guide. Geneva: World Health
Organization; 1997.
37. Bayley N: Bayley Scales of Infant Development: Manual. New York:
Psychological Corporation; 1993.
38. The World Bank HNP/Poverty Thematic Group: Socio-Economic Differences in
Health, Nutrition and Poverty. Washington DC: The World Bank; 2000.
doi:10.1186/1471-2431-14-281
Cite this article as: Wallander et al.: Dose of early intervention treatment
during children’s first 36 months of life is associated with
developmental outcomes: an observational cohort study in three low/
low-middle income countries. BMC Pediatrics 2014 14:281.
Submit your next manuscript to BioMed Central
and take full advantage of:
• Convenient online submission
• Thorough peer review
• No space constraints or color figure charges
• Immediate publication on acceptance
• Inclusion in PubMed, CAS, Scopus and Google Scholar
• Research which is freely available for redistribution
Submit your manuscript at
www.biomedcentral.com/submit