Infant and child feeding index reflects feeding practices, nutritional status of urban slum children
Bạn đang xem bản rút gọn của tài liệu. Xem và tải ngay bản đầy đủ của tài liệu tại đây (997.28 KB, 11 trang )
Lohia and Udipi BMC Pediatrics 2014, 14:290
/>
RESEARCH ARTICLE
Open Access
Infant and child feeding index reflects feeding
practices, nutritional status of urban slum children
Neha Lohia* and Shobha A Udipi
Abstract
Background: Infant and child feeding index (ICFI) an age-specific index, can be used to assess child feeding
practices. We used the ICFI to assess feeding practices for urban slum children and the association between ICFI
and child nutritional status.
Methods: 446 children aged 6 to 24 months from urban slums of Mumbai, India were studied. We used the
24-hour diet recall to study dietary diversity and a food frequency questionnaire for consumption of food groups
during the preceding week. ICFI was computed using five components, namely, breastfeeding, use of bottle, dietary
diversity score (DDS), food group frequency score (FGFS) and feeding frequency scores (FFS). Weight, height and
Mid-Upper Arm Circumference (MUAC) were measured, and z scores were calculated. Association between ICFI
scores and nutritional status was examined.
Results: The mean total ICFI score for all was 5.9 ± 1.9. Among the five components, FGFS and FFS differed
between children <12 months of age and >12 months and by breast feeding status. In contrast, there were no
differences vis-à-vis dietary diversity scores (DDS), breast feeding, and use of bottle. Non-breastfed children had
significantly higher DDS scores than did breastfed children. The mean feeding frequency score (FFS) for
children <12 months of age was slightly but not significantly lower than scores for children >12 months of age.
Mother’s age and child’s age were significant determinants of ICFI. Multivariate analysis indicated that ICFI was
significantly associated with Length-for-Age z scores (LAZ) and BMI-for-Age z scores (BAZ). Sensitivity of ICFI was
lower than its specificity.
Conclusions: The results of the present study confirmed that the ICFI can be used to collect information on key
components of young child feeding practices and be incorporated into public-health programmes. Further, it
could be used to determine the influence of complementary feeding practices on nutritional status of children.
Keywords: Infant and child feeding index, Dietary diversity, Complementary feeding practices, Nutritional status,
Urban slums, India
Background
Globally, more than one-third of child deaths occur due
to undernutrition, which is more prevalent in low- and
lower-middle-income countries [1,2]. In India, the third
National and Family Health Survey [3] indicated that
46% of children under three years were underweight,
38% were stunted and 19% were wasted. Infants and
young children upto two years of age are considered to
be the most vulnerable because of their higher requirements of energy- and nutrient- dense foods to support
* Correspondence:
Department of Food Science and Nutrition, SNDT Women’s University, Sir
Vithaldas Vidyavihar, Juhu, Mumbai 400 049, India
their growth and physical and mental development [4].
Hence, infant and young child feeding practices (IYCF)
during this period play a critical role. Faulty breastfeeding and poor complementary feeding can lead to undernutrition [5-7].
In the Indian context, most of the reports in the literature have focused on specific feeding behaviours such as
breastfeeding, age at introduction of complementary foods
[3,8-10]. However, all these studies have not captured the
multidimensionality of feeding practices including dietary
diversity and have not examined their influence on child
nutritional status.
© 2014 Lohia and Udipi; licensee BioMed Central Ltd. This is an Open Access article distributed under the terms of the
Creative Commons Attribution License ( which permits unrestricted use,
distribution, and reproduction in any medium, provided the original work is properly credited. The Creative Commons Public
Domain Dedication waiver ( applies to the data made available in this
article, unless otherwise stated.
Lohia and Udipi BMC Pediatrics 2014, 14:290
/>
IYCF practices are multidimensional and age-specific.
Ruel and Menon developed a composite feeding index
to identify nutritionally vulnerable children [11]. This
index is based on an age-specific scoring system that
gives points for positive practices such as breastfeeding,
avoiding use of bottle for feeding, meal frequency and
dietary diversity. Efforts to measure and quantify IYCF
practices using ICFI and to determine its association
with nutritional status have been reported by various investigators in different countries [7,12-16]. Many investigators [5-7,13,15,16] have shown a positive association
between ICFI and nutritional status. While none of the
studies indicated a significant association between all the
three indicators of nutritional status i.e. weight-for-age
(WAZ), weight-for-length (WLZ) and length-for-age
(LAZ), most investigators have found an association with
LAZ [6,7,13,15,16]. In India, only two groups of investigators have used a scoring system for complementary
feeding practices to determine the association with nutritional status of young children [5,6]. Therefore we
used the index developed by Ruel and Menon [11] to assess feeding behaviours and to identify which of the ICFI
components may require attention in nutrition education interventions in Indian slums. The data reported
herein is the baseline data which was part of a longitudinal intervention on feeding practices of young children
aged 6 to 24 months. Feeding practices were examined
using the ICFI. The association between ICFI and child
nutritional status was studied. We also calculated the
specificity and sensitivity of the ICFI in order to determine whether it can serve to identify undernourished
children.
Methods
Study site and sample selection
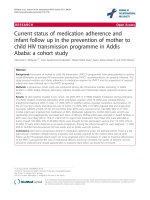
This study was conducted in six slums adopted by two
non-governmental organizations- Committed Communities Development Trust (CCDT) and Centre for the
Study of Social Change (CSSC). The slums are located in
three western suburbs of Mumbai city indicated in the
map (Figure 1). Each slum had a population of approximately 1000 families. A little less than half of the families
(47.9%) had houses made of asbestos/tin. One-fourth of
the families (26.9%) lived in houses constructed from
brick/stone wall and RCC roof and the remaining families
were either residing in transit camp (12.6%) or in a semi –
pucca house with brick walls and tin roofs (12.6%). Almost
three-fourths of the families were Hindu (75.8%) and the
remaining 24.2% were Muslim. The mean number of
family members was 6.1 ± 3.1. Mean total family income
was Rs. 8067 ± 6836 and mean per capita income was Rs.
1436 ± 974/ month. More than two – thirds of mothers
(69.3%) were literate.
Page 2 of 11
The data reported in this study is part of the baseline
data collected during a longitudinal study. The main
study aimed to compare the impact of nutrition education with and without ready – to – use food supplement
on growth, feeding and nutrient intakes of young children through improvement of complementary feeding
practices of mothers.
Using 90% power, the number of mother – child pairs
required was 150 in each intervention group. Hence, it
was decided to recruit at least 200 mother – child pairs
in each group, taking into account possible dropouts.
All mothers in the selected slums who had children aged
6 to 24 months were included in the study based on the
following criteria: willingness of mother to participate in
the study, child should not be exclusively breastfed and it
should not have any congenital anomalies or disease or
any kind of food allergy. Four hundred and forty six
mother-child pairs aged 6 to 24 months who met the
inclusion criteria were included in the study.
Data collection
Information about mother/caregiver education, age, family
income and about child characteristics such as age, ordinal
position and gender was obtained by interviewing mothers.
Anthropometric measurements of children were taken
thrice and the average of three readings was calculated.
Weight was measured using a Salter scale calibrated to the
nearest 100 g with a maximum capacity of 25 kg. Length
was measured using an infantometer to the nearest 0.1 cm.
Mid-upper arm circumference (MUAC) was measured to
the nearest 0.1 cm using a flexible, non-stretchable measuring tape standardized against a stadiometer.
Mother’s height and weight were measured twice.
Weight was measured using an Equinox digital weighing
balance accurate to 100 g and height was measured
using a non-stretchable measuring tape standardized
against a stadiometer. BMI was calculated.
Infant and Child Feeding Index (ICFI)
The ICFI was constructed as described by Arimond and
Ruel and Moursi et al. [14,17]. The variables and scoring
system used are shown in Table 1 [14]. Mothers were
interviewed about infant feeding practices and consumption of food groups during the week preceding the survey.
Dietary diversity scores were calculated with the use of a
24-hr dietary recall. Food frequency questionnaire (FFQ)
was used to assess food group frequency score (FGFS).
For each child, one – day 24-hour semi-quantitative
recall was taken using the multiple pass method. The FFQ
consisted of 50 items belonging to 9 food groups – i)Tea/
milk, ii) Cereal preparations, iii) Pulse preparations, iv)
Cereal and pulse combinations, v) Vegetables, vi) Fruits,
vii) Biscuits, viii) Non vegetarian items and ix) Other foods
such as sago, sugar, ice-cream, commercial weaning foods.
Lohia and Udipi BMC Pediatrics 2014, 14:290
/>
Page 3 of 11
Figure 1 Locations of the slums selected for the study.
Dietary diversity score was calculated by adding the
number of food groups [14] consumed on the previous
day of the survey. The food group frequency score, was
assessed separately by using food frequency questionnaire;
each food group was scored 0 if not consumed during previous week, +1 if consumed on 1–3 days and +2 if consumed on ≥4 days. The distribution of feeding frequency
scores was assessed for each age range, a score of +1 was
given to children who met the recommendation of feeding
2 times/day for 6–8 months, 3 times/day for 9 months or
more, and a score of +2 was given when children who met
recommendation of feeding ≥3 times/day for 6–8 months
and ≥4 times/day for >9 months. Older children, who
were fed for ≥5 times /day, were assigned a score of +3.
The ICFI score was calculated by adding up the scores
obtained, giving a range of 0–9. Further, the ICFI scores
were categorised as: low = a score of 0–5, medium = 6-7
and high = 8-9 [14].
Ethics
The study protocol was reviewed and approved by the Intersystem Biomedical Ethics Committee. Informed written
consent was taken from all the mothers who participated
in the study.
Data analysis
Data was analyzed using the SPSS software (version
20.0). Standard deviation/ Z scores were calculated using
the WHO Anthro software (2009) for weight for age
(WAZ), length for age (LAZ), weight for length (WLZ),
MUAC for age (MUACZ) and body mass index (BMI)
for age (BAZ) values. Also children were classified into
various grades of nutritional status based on the WHO
criteria [18]. For examining association of ICFI scores
with age, children were divided into four age groups 6 –
8.99, 9 – 11.99, 12 – 17.99 and 18 – 24 months.
Lohia and Udipi BMC Pediatrics 2014, 14:290
/>
Page 4 of 11
Table 1 Variables and scoring system used to construct the infant & child feeding index
Variables
6 – 8 Mo
9 – 11 Mo
12 – 24 Mo
Breastfeeding
Yes – 2
Yes – 2
Yes – 1
No – 0
No – 0
No – 0
Bottle feeding
Yes – 0
Yes – 0
Yes – 0
No – 1
No – 1
No – 1
0– 1 food group – 0
0– 2 food group – 0
0– 2 food group – 0
2 food groups – 1
3 food groups – 1
3 food groups – 1
≥3 food groups – 2
≥4 food groups – 2
≥4 food groups – 2
0 – 2 food groups – 0
0 ���������������������������������������������������������������������������������������������������������������������������������������������������������������������������������������������������������������������������������������������������������������������������������������������������������������������������������������������������������������������������������������������������������������������������������������������������������������������������������������������������������������������������������������������������������������������������������������������������������������������������������������������������������������������������������������������������������������������������������������������������������������������������������������������������������������������������������������������������������������������������������������������������������������������������������������������������������������������������������������������������������������������������������������������������������������������������������������������������������������������������������������������������������������������������������������������������������������������������������������������������������������������������������������������������������������������������������������������������������������������������������������������������������������������������������������������������������������������������������������������������������������������������������������������������������������������������������������������������������������������������������������������������������������������������������������������������������������������������������������������������������������������������������������������������������������������������������������������������������������������������������������������������������������������������������������������������������������������������������������������������������������������������������������������������������������������������������������������������������������������������������������������������������������������������������������������������������������������������������������������������������������������������������������������������������������������������������������������������������������������������������������������������������������������������������������������������������������������������������������������������������������������������������������������������������������������������������������������������������������������������������������������������������������������������������������������������������������������������������������������������������������������������������������������������������������������������������������������������������������������������������������������������������������������������������������������������������������������������������������������������������������������������������������������������������������������������������������������������������������������������������������������������������������������������������������������������������������������������������������������������������������������������������������������������������������������������������������������������������������������������������������������������������������������������������������������������������������������������������������������������������������������������������������������������������������������������������������������������������������������������������������������������������������������������������������������������������������������������������������������������������������������������������������������������������������������������������������������������������������������������������������������������������������������������������������������������������������������������������������������������������������������������������������������������������������������������������������������������������������������������������������������������������������������������������������������������������������������������������������������������������������������������������������������������������������������������������������������������������������������������������������������������������������������������������������������������������������������������������������������������������������������������������������������������������������������������������������������������������������������������������������������������������������������������������������������������������������������������������������������������������������������������������������������������������������������������������������������������������������������������������������������������������������������������������������������������������������������������������������������������������������������������������������������������������������������������������������������������������������������������������������������������������������������������������������������������������������������������������������������������������������������������������������������������������������������������������������������������������������������������������������������������������������������������������������������������������������������������������������������������������������������������������������������������������������������������������������������������������������������������������������������������������������������������������������������������������������������������������������������������������������������������������������������������������������������������������������������������������������������������������������������������������������������������������������������������������������������������������������������������������������������������������������������������������������������������������������������������������������������������������������������������������������������������������������������������������������������������������������������������������������������������������������������������������������������������������������������������������������������������������������������������������������������������������������������������������������������������������������������������������������������������������������������������������������������������������������������������������������������������������������������������������������������������������������������������������������������������������������������������������������������������������������������������������������������������������������������������������������������������������������������������������������������������������������������������������������������������������������������������������������������������������������������������������������������������������������������������������������������������������������������������������������������������������������������������������������������������������������������������������������������������������������������������������������������������������������������������������������������������������������������������������������������������������������������������������������������������������������������������������������������������������������������������������������������������������������������������������������������������������������������������������������������������������������������������������������������������������������������������������������������������������������������������������������������������������������������������������������������������������������������������������������������������������������������������������������������������������������������������������������������������������������������������������������������������������������������������������������������������������������������������������������������������������������������������������������������������������������������������������������������������������������������������������������������������������������������������������������������������������������������������������������������������������������������������������������������������������������������������������������������������������ntly higher for nonbreastfed (0.95 ± 0.7) than breastfed children (0.74 ± 0.8,
F value = 4.230, p = 0.040). DDS was examined in relation to gender but no significant association was observed, although among children <12 months, females
Table 2 Mean total ICFI Scores by gender and age categories
Age categories
Breastfed
Non–breastfed
(n = 381)
All children
(n = 65)
(n = 446)
Male
Female
Total
Male
Female
Total
Male
Female
Total
(n = 95)
(n = 95)
(n = 190)
(n = 124)
(n = 132)
(n = 256)
(n = 219)
(n = 227)
(n = 446)
6 – 8.99 mos (n = 100)
7.1 ± 1.7
6.0 ± 1.8
6.5 ± 1.8
5.3 ± 0.9
5.0
5.2 ± 0.8
6.9 ± 1.7
6.0 ± 1.7
6.5 ± 1.8
9 – 11.99 mos (n = 90)
6.3 ± 1.7
5.8 ± 1.8
6.1 ± 1.8
4.3 ± 1.5
4.6 ± 1.7
4.4 ± 1.5
6.2 ± 1.8
5.6 ± 1.8
5.9 ± 1.8
12 – 17.99 mos (n = 196)
5.4 ± 2.2
5.6 ± 2.0
5.5 ± 2.1
5.6 ± 0.9
6.1 ± 1.9
5.9 ± 1.6
5.5 ± 2.0
5.7 ± 2.0
5.6 ± 2.0
18 – 24 mos (n = 60)
6.1 ± 1.9
6.4 ± 2.0
6.3 ± 1.9
5.1 ± 1.9
4.7 ± 1.2
4.9 ± 1.7
5.8 ± 1.9
5.8 ± 1.9
5.9 ± 1.9
All children
6.1 ± 2.0
5.8 ± 1.9
5.9 ± 1.9
5.3 ± 1.4
5.6 ± 1.8
5.4 ± 1.6
6.0 ± 1.9
5.8 ± 1.9
5.9 ± 1.9
Mean values ± standard deviation.
Lohia and Udipi BMC Pediatrics 2014, 14:290
/>
Page 6 of 11
Table 3 Mean scores for components of icfi by gender and by age categories
ICFI components
Male (n = 219)
Female (n = 227)
All children (n = 446)
F value, p (by gender)
6 – 8.99 mos
1.9 ± 0.5
2.0 ± 0.3
1.9 ± 0.4
15.174,0.000
9 – 11.99 mos
1.9 ± 0.5
1.8 ± 0.6
1.8 ± 0.6
Breastfeeding
12 – 17.99 mos
0.9 ± 0.4
0.8 ± 0.4
0.8 ± 0.4
18 – 24 mos
0.7 ± 0.5
0.8 ± 0.4
0.7 ± 0.4
F value, p (by age category)
161.758,0.000
Bottle-feeding
6 – 8.99 mos
1.0 ± 0.2
1.0 ± 0.1
1.0 ± 0.2
9 – 11.99 mos
1.0 ± 0.2
1.0 ± 0.2
1.0 ± 0.2
12 – 17.99 mos
1.0 ± 0.1
1.0 ± 0.1
1.0 ± 0.1
18 – 24 mos
0.9 ± 0.2
1.0 ± 0.2
1.0 ± 0.2
F value, p (by age category)
1.228,0.299
1.388,0.239
Dietary diversity scores
6 – 8.99 mos
1.0 ± 0.8
0.7 ± 0.7
0.9 ± 0.8
9 – 11.99 mos
0.7 ± 0.7
0.5 ± 0.7
0.6 ± 0.7
12 – 17.99 mos
0.8 ± 0.8
0.8 ± 0.8
0.8 ± 0.8
18 – 24 mos
0.8 ± 0.8
0.9 ± 0.8
0.9 ± 0.8
F value, p (by age category)
3.035,0.029
0.145,0.703
Food group frequency scores
6 – 8.99 mos
1.5 ± 0.6
1.3 ± 0.8
1.4 ± 0.7
9 – 11.99 mos
1.8 ± 0.5
1.6 ± 0.7
1.7 ± 0.6
12 – 17.99 mos
1.7 ± 0.5
1.8 ± 0.5
1.7 ± 0.5
18 – 24 mos
1.8 ± 0.4
1.9 ± 0.3
1.9 ± 0.4
F value, p (by age category)
3.796,0.010
0.275,0.600
Feeding frequency scores
6 – 8.99 mos
1.6 ± 0.7
1.1 ± 0.9
1.3 ± 0.8
9 – 11.99 mos
0.9 ± 0.9
0.8 ± 1.0
0.9 ± 0.9
12 – 17.99 mos
1.1 ± 1.1
1.3 ± 1.3
1.2 ± 1.2
18 – 24 mos
1.5 ± 1.1
1.4 ± 1.2
1.5 ± 1.1
F value, p (by age category)
1.267,0.285
0.059,0.807
Mean values ± standard deviation.
tended to be worse off as 49% of 6 – 8.99 month old
girls and 61.4% of the 9 – 11.99 month old had low
DDS scores compared to 26.5% and 50% of boys in the
same age categories. A little less than one-fourth of
male children (<12 months) had a high DDS compared
to only 13.7% females. When the <12 month age group
was sub-divided further into 6 – 8.99 months and 9 –
11.99 months, girls in the 6 – 8.99 month age group
were worse off as only 15.7% had high DDS compared
to almost twice the percentage of boys (30.6%). Among
the 9 – 11.99 month old children, a slightly lower percentage of girls had high DDS than did boys. In the
older age group (>12 months), there was no significant
difference between the two sexes.
About three fourths of the children had high FGFS
scores (score of 2) and about one – fifth had medium
scores (score of 1). The percentage of children with high
FGFS scores increased with age (Table 4), with the lowest percentage being in the 6 – 8.99 months age group.
Comparison between age groups within gender showed
that there was no significant difference in the distribution
for boys (χ2 = 10.051, p = 0.123). However, girls below
12 months of age were worse off compared to girls above
12 months of age (χ2 = 28.550, p = 0.000).
A little more than half of males (54.8%) <12 months of
age had a higher feeding frequency score compared to
one-third of females (32.7%) in the same age category.
However, among children aged >12 months, there was
Lohia and Udipi BMC Pediatrics 2014, 14:290
/>
Page 7 of 11
Table 4 Percent distribution of ICFI components by age and gender
6 – 8.99 mos
9 – 11.99 mos
12 – 17.99 mos
18 – 24 mos
All children
Male
Female
Male
Female
Male
Female
Male
Female
Male
Female
Total
Yes
93.8
98.0
93.5
88.6
85.9
81.7
68.8
78.6
86.7
86.3
86.6
χ2, p (by age)
2.224,0.329
1.567,0.457
0.612,0.434
No
95.9
95.7
97.8
97.8
97.1
χ , p (by age)
0.386,0.534
ICFI components
Breastfeeding
0.737,0.391
0.022,0.989
93.8
96.3
Bottle-feeding
2
98.0
97.7
98.1
0.301,0.584
0.015,0.901
96.4
0.226,0.635
0.829,0.363
Dietary diversity score
Low (0)
26.5
49.0
50.0
61.4
45.7
42.3
43.8
32.1
42.0
46.3
44.2
Medium (1)
42.9
35.3
34.8
27.3
32.6
34.6
28.1
42.9
34.7
34.4
34.5
High (2)
30.6
15.7
15.2
11.4
23.3
19.4
21.3
χ2, p (by age)
6.113,0.047
8.4
6.7
21.7
1.181,0.554
0.222,0.895
4.3
4.3
1.506,0.471
1.257,0.534
3.1
5.0
Food group frequency score
Low (0)
8.2
17.6
11.4
4.8
0.0
Medium (1)
32.7
37.3
15.2
18.2
19.6
15.4
9.4
7.1
20.1
19.8
20.0
High (2)
59.2
45.1
80.4
70.5
76.1
79.8
87.5
92.9
74.9
71.8
73.3
χ2, p (by age)
2.834,0.242
1.838,0.399
0.601,0.740
1.012,0.603
2.005,0.367
Feeding frequency score
Low (0)
12.2
31.4
45.7
52.3
39.1
37.5
25.0
32.1
32.4
38.3
35.4
Medium (1)
18.4
31.4
15.2
20.5
23.9
20.2
25.0
17.9
21.0
22.5
21.7
High (2/3)*
69.3
37.3
39.1
27.2
37.0
42.3
50.0
50.0
46.6
39.2
42.8
χ2, p (by age)
10.882,0.012
4.584,0.205
5.186,0.159
0.774,0.856
11.435,0.010
*2 for 6 to 11.99 month old age group and 3 for 12 to 24 month age group. Absolute numbers (%).
no significant association between feeding frequency
score (FFS) and gender of the child. When the four age
categories were compared, the gender difference became
more pronounced for the 6 – 8.99 month age group
(Table 4). A much higher percentage of males (69.3%) had
high FFS compared to 37.3% of females. Further, the percentage of children with high FFS was lowest in the 9 –
11.99 month age group followed by the 12 – 17.99 month
old age group. Even among children above 18 months of
age, about one – fourth to one – third of the children had
low FFS, although it was lower compared to children aged
9 – 17.99 months indicating that a substantial proportion
of the children were under – fed.
Step – wise regression analysis was done using the
scores of the five individual components as independent
variables and total ICFI score as the dependent variable.
The variables were entered in the model in following
order: DDS, FFS, breastfeeding score, FGFS and bottle
feeding score. Overall the model was significant (F value =
2.055E + 16, p = 0.000). All the five components were
found to be significant, with DDS (Beta = 0.405, p = 0.000)
and FFS (Beta = 0.561, p = 0.000) contributing the most to
the total ICFI score followed by breastfeeding score (Beta
= 0.354, p = 0.000), FGFS (Beta = 0.311, p = 0.000) and
bottle feeding score (Beta = 0.088, p = 0.000).
Association of ICFI with nutritional status of children
The mean z scores by age categories and ICFI categories
were examined (Table 5). There was no significant
difference between mean z scores for WLZ, WAZ, LAZ,
BAZ and MUACZ in the low, medium and high
categories of ICFI.
Multivariate regression analysis was carried out to determine whether selected maternal and child characteristics
were associated with ICFI. The variables entered in the
equation were maternal age, BMI, education, family income, child’s age, sex and ordinal position. The model was
significant (R2 (R2 Adj) = 0.046(0.028); F value = 2.617, p =
0.008). Among these maternal age was positively and
significantly associated (Beta = 0.153, p = 0.006), whereas
child’s age was negatively and significantly associated
(Beta = −0.015, p = 0.026) with ICFI score.
Further, multivariate regression analysis was performed
to determine if there was significant association between
ICFI and nutritional status after controlling for other
confounding variables namely - child characteristics (age,
Lohia and Udipi BMC Pediatrics 2014, 14:290
/>
Page 8 of 11
Table 5 Mean Z scores and distribution of children (%) with Z scores < −2SD by ICFI categories
Age category
ICFI category
n
WLZ
LAZ
WAZ
BAZ
MUACZ
6 – 8.99 mos (n = 100)
Low (0–5)
37
−1.0 ± 2.6
−0.6 ± 2.5
−1.3 ± 1.7
−1.3 ± 2.4
−0.3 ± 1.2
Medium (6–7)
25
−0.9 ± 2.5
−0.7 ± 2.1
−1.2 ± 1.8
−1.1 ± 2.5
−0.7 ± 0.9
High (8–9)
37
−0.6 ± 2.1
−0.4 ± 2.4
−0.9 ± 1.5
−0.8 ± 2.0
−0.4 ± 1.3
Low (0–5)
45
−1.0 ± 2.4
−1.1 ± 2.3
−1.5 ± 1.4
−1.1 ± 2.3
−0.3 ± 0.9
Medium (6–7)
23
−0.7 ± 2.9
−1.6 ± 2.2
−1.5 ± 1.7
−0.7 ± 2.9
−0.8 ± 1.1
High (8–9)
22
−1.4 ± 1.9
−2.2 ± 1.9
−2.2 ± 1.5
−1.4 ± 1.9
−0.5 ± 1.3
Low (0–5)
100
−0.1 ± 2.0
−3.1 ± 2.3
−1.8 ± 1.3
0.2 ± 1.9
−0.8 ± 1.2
9 – 11.99 mos (n = 90)
12 – 17.99 mos (n = 196)
18 – 24 mos (n = 60)
Medium (6–7)
53
0.2 ± 2.5
−2.1 ± 2.2
−1.2 ± 1.4
0.1 ± 2.7
−0.4 ± 1.3
High (8–9)
43
−0.9 ± 2.0
−2.5 ± 2.2
−2.0 ± 1.3
−0.7 ± 2.1
−0.5 ± 1.3
Low (0–5)
25
−0.2 ± 1.7
−4.7 ± 2.0
−2.7 ± 1.2
0.5 ± 1.7
−1.4 ± 1.4
Medium (6–7)
18
−0.8 ± 2.8
−4.3 ± 2.5
−2.9 ± 1.7
−0.2 ± 3.0
−1.5 ± 0.7
High (8–9)
16
−0.5 ± 2.2
−4.3 ± 1.8
−2.7 ± 1.2
0.2 ± 2.4
−1.1 ± 1.1
0.502,0.605
0.245,0.783
0.681,0.506
0.447,0.640
0.934,0.394
F value, p (by ICFI categories)
Percent children with Z scores < −2 SD
6-8.99 mos
-
100
29.4
9.6
15.1
32.8
6.0
9-11.99 mos
-
90
26.1
14.8
21.5
28.6
5.5
12-17.99 mos
-
196
36.1
52.8
39.8
32.8
15.3
18-24 mos
-
59
8.4
22.7
23.7
5.9
31.6
Mean values ± standard deviation.
gender and ordinal position), maternal characteristics (age,
BMI and education) and household characteristics (per
capita income). In the multivariate model (Table 6), ICFI
was significantly associated with LAZ and BAZ scores, but
not with WLZ, WAZ and MUACZ. Other variables that
had significant impact on nutritional status were: BMI of
mother and mothers completing secondary schooling for
WLZ and BAZ, age of the mother for MUACZ, gender of
the child for WAZ and LAZ. Age of the child had the
most significant impact on all indicators of nutritional
status except WLZ.
Sensitivity and specificity of ICFI were also calculated.
The sensitivity and specificity of the indicators of nutritional status are presented in Table 7. The sensitivity i.e.
ability of the index to correctly identify children as undernourished ranged from 16 to 54% and specificity (ability of
Table 6 Multivariate regression analysis of determinants of nutritional status
Parameters
WLZ
WAZ
LAZ
BAZ
MUACZ
Beta
Sig
Beta
Sig
Beta
Sig
Beta
Sig
Beta
Sig
Age (yrs)
0.050
0.368
0.093
0.083
1.001
0.317
0.684
0.494
3.008
0.003
Per capita income (Rs)
−0.038
0.448
−0.042
0.384
0.075
0.940
−0.976
0.330
0.122
0.903
BMI
0.107
0.029
0.068
0.148
−1.287
0.199
2.485
0.013
0.354
0.724
Maternal characteristics
≤SSC
0.157
0.003
0.085
0.092
−1.888
0.060
3.237
0.001
0.041
0.967
≥HSC
0.086
0.100
0.047
0.352
−1.120
0.263
1.712
0.088
−0.656
0.512
0.005
0.910
0.091
0.046
2.610
0.009
−0.163
0.871
1.198
0.231
Child characteristics
Gender
Age (months)
0.052
0.273
−0.303
0.000
−11.344
0.000
3.910
0.000
−4.397
0.000
Ordinal position
−0.024
0.679
−0.066
0.230
−0.770
0.442
−0.519
0.604
−1.595
0.111
ICFI score
−0.092
0.056
−0.010
0.827
2.034
0.043
−2.012
0.045
0.510
0.610
R2(R2Adj)
0.051(0.032)
0.115(0.096)
0.263(0.247)
0.093(0.074)
0.066(0.047)
F value = 2.622,
F value = 6.266,
F value = 17.258,
F value = 4.948,
F value = 3.415,
p = 0.006
p = 0.000
p = 0.000
p = 0.000
p = 0.000
Lohia and Udipi BMC Pediatrics 2014, 14:290
/>
Page 9 of 11
Table 7 Sensitivity and Specificity of Total ICFI Score with
Indicators of Nutritional Status
Sensitivity* (95% CI)
Specificity# (95% CI)
P value
WLZ
0.236(0.191,0.282)
0.705(0.666,0.745)
0.164
LAZ
0.545(0.494,0.597)
0.515(0.469,0.560)
0.218
WAZ
0.435(0.384,0.486)
0.599(0.554,0.644)
0.501
BAZ
0.230(0.186,0.276)
0.700 (0.662,0.741)
0.108
MUACZ
0.163 (0.127,0.198)
0.890 (0.859,0.920)
0.126
*
Ability of the index to correctly identify children as undernourished.
#
Ability of the index to correctly identify children as normal.
the index to correctly identify children as normal) ranged
from 51 to 89%. However, sensitivity was highest for LAZ
followed by WAZ but was very low for WLZ, BAZ and
MUACZ. Specificity was highest for MUACZ followed by
WLZ and BAZ.
Discussion
The present study provides data on selected quantitative
aspects of complementary feeding practices in urban
slum settings in Mumbai, India, by using the ICFI developed by Arimond and Ruel, and determining its association with five indicators of nutritional status [19]. A
significant association was found between ICFI and LAZ
and BAZ in this study sample.
The prevalence of undernutrition specifically stunting
followed by underweight and wasting was high in the
present study, which could be partly attributed to poor
complementary feeding practices, lack of knowledge
among mothers/caregivers, poor hygiene and low socioeconomic status [20-22].
In the present study, the mean ICFI score was 5.9 out
of a maximum possible score of 9 indicating that some
of the child feeding practices that are assessed in the
index were inappropriate. The five components of the
ICFI are breastfeeding, bottle feeding, dietary diversity,
food group frequency and feeding frequency. While
there was not much difference between age groups, in
the percentage of children who were breastfed or bottlefed, at least half of the 9 – 11.99 month age group had
low DDS and about half had low scores for feeding
frequency. Out of the maximum possible ICFI score of
9, almost half i.e. 4 to 5 score points are contributed
together by DDS and FFS. This trend was also observed
for older children above 12 months of age, although a
higher percentage of 9 – 11.99 month old children had
lower scores than the older age group. The relatively low
scores for these two individual components indicates
that feeding practices after 9 months require considerable attention and that between 9 to 24 months of age,
the 9 to 11.99 month period in infancy perhaps needs to
be closely focused on for interventions aimed at behaviour change and improving child nutrition. Garg and
Chadha studied rural children in a narrow age range of
6 – 12 months in Ghaziabad district, Uttar Pradesh,
North India [6]. However their index included timely
initiation of complementary feeding which is not included in the ICFI index used in this study.
In the present study, ICFI was found to be significantly
associated with LAZ but not with WAZ or WLZ. Other
reports in the literature indicate that LAZ was significantly associated with the child feeding index in several
countries including Bolivia, Colombia, Guatemala,
Nicaragua, Peru, Ethiopia and India [6,12,17]. In Burkina
Faso, Sawadago et al. used a modified ICFI and observed
a significant relationship with LAZ of children aged
6–36 months of age [13]. Garg and Chadha also found
significant association between a complementary feeding
index that they developed and LAZ in rural Indian children [6]. In Bangladesh, Khatoon et al. found a significant relationship between ICFI and LAZ, especially
among children aged 12–23 months of age. Similarly,
Bork et al. reported significant association between ICFI
and LAZ among Senegalese children below 12 months
of age [15,16]. Recently, Ma et al. reported positive association between ICFI and LAZ and WAZ among
Chinese children of 18 months of age [7]. Olabiyi [Complementary Feeding Practices and Nutritional Status of
Children 6–24 Months in Abeokuta South Local Government Area, Ogun state, Nigeria, Unpublished Project
Report, 2012] also reported a significant association between complementary feeding practices of the caregivers
and WAZ. However, this finding does not conform with
the results reported by Ntab et al. in Senegal, Moursi
et al. in Madagascar [14,23]. These investigators reported
that the index was unable to report impact on nutritional status in their multivariate model.
Black et al. reported that even with optimum breastfeeding, children will become stunted if they do not receive an
adequate quantity and quality of complementary foods
after six months of age [1]. Our findings are in line with
the report by Black et al. [1]; as DDS and FFS scores for
these children were relatively poor and both together contributed to about half of the total score. Inappropriate
feeding practices that provide inadequate amounts of important macro and micronutrients over a long period will
result in compromised growth that will reflected by poorer
LAZ scores. Malik and Mazhar [24] reported that the odds
ratio of children being malnourished was 2.54 times for
children who received complementary foods after one year
of age compared to children who were given complementary foods before the age of four months. In the present
study, stunting was higher among older children than children <12 months of age [5,25]. This needs attention since
stunting is associated not only with poor physical growth
but also affects cognitive abilities that are irreversible after
2 years of age [26].
Lohia and Udipi BMC Pediatrics 2014, 14:290
/>
The association between ICFI and nutritional status in
the multivariate model in the present study showed that
even after controlling for selected maternal, child and
household characteristics, infant and child feeding practices were important determinants for LAZ and BAZ.
These were poor diversity of complementary foods and
poor feeding frequency of the complementary foods.
Further, age and gender of child, maternal education and
BMI of mother were important factors influencing nutritional status which was also demonstrated by Arimond and
Ruel, Armar-Klemesu et al. Dewey et al. and Srivastava and
Sandhu [5,21,27,28]. Also, multivariate regression analysis
indicated that mother’s age and education are important
factors. In developing country settings, poor maternal education level and young age reflect women’s status and their
care capacity.
The findings of the present study confirm the findings
that ICFI may be able to reflect chronic malnutrition
among young children, however, the sensitivity is not very
high [5-7]. This index reflected the quality and quantity of
the complementary foods fed to the children in urban
slum setting in terms of the food frequency and dietary diversity scores and indicated that poor quality reflected by
the DD scores and low frequency of complementary foods
were major factors determining the nutritional status of
the child [5,6,15]. Thus, improvement in dietary diversity,
quality and frequency of feeding complementary foods
needs to be addressed through appropriate interventions
in order to improve feeding practices and nutritional
status of children under two years of age.
The strengths of the present study are that it is perhaps
one of the first to use the ICFI for children between 6 to
24 months in urban slum setting. We are one of the few
who have examined sensitivity and specificity of ICFI,
however a larger sample size may be worthwhile to come
to a conclusion, and further longitudinal examination of
the data is required to examine time-trend relationships.
The limitation of the study is that in the index, age of initiation of complementary foods was not considered. In the
present study, 9 to 12 month identified as the most vulnerable age period as 8% children from the same age
group did not receive complementary foods until 9 months
of age, but this needs to be confirmed with a larger sample
size. The ICFI index needs to be validated in the Indian
sample. Only a small variance was explained by the maternal and child characteristics (R2 Adj: 0.028) therefore,
other factors needs investigation which may determine
feeding practices such as influence of extended family
members e.g. mother – in – law, maternal self – efficacy,
parity, socio – economic status, standard living index, etc.
Conclusions
The results of the present study confirmed that the ICFI
index can be used to collect information on various
Page 10 of 11
components of young child feeding practices. It can be
used in public-health programmes for addressing the
issue of complementary feeding as a whole and also for
monitoring the change in feeding practices. Further, it
could be used to determine the influence of complementary feeding practices on nutritional status of children.
The study points out the need for intensive nutrition
education and improving women’s status in terms of
education and delaying age of marriage in order to improve infant and young child nutritional status.
Abbreviations
ICFI: Infant and Child Feeding Index; IYCF: Infant and young child feeding
practices; WLZ: Weight-for-length z score; WAZ: Weight-for-age z score;
LAZ: Length-for-age z score; BAZ: Body mass index- for- age z score;
MUACZ: Mid-upper arm circumference-for-age z score; MUAC: Mid-upper
arm circumference; BMI: Body mass index; DDS: Dietary diversity score;
FGFS: Food group frequency score; FFS: Feeding frequency score.
Competing interests
The authors declare that they have no competing interests.
Authors’ contributions
NL conceived the study, carried out the data collection, did statistical
analysis, and prepared the draft of the manuscript. SU conceived the study,
guided throughout the data collection and helped in data analysis and
interpretation of results and read and approved the final manuscript.
Both authors read and approved the final manuscript.
Authors’ information
Neha Lohia, MSc FSN, Ph.D. Scholar, Department of Food Science and
Nutrition, SNDT Women’s University, Mumbai, India. Dr. S. A. Udipi, Ph.D.
(Purdue University), Professor and Head, Department of Food Science and
Nutrition, SNDT Women’s University, Mumbai, India.
Acknowledgements
Corresponding author is grateful to Indian Council of Social Science Research
(ICSSR) for providing Doctoral Fellowship for a period of two years to
conduct the study as part of the doctoral thesis and to Department of
Science and Technology – CURIE for partial support. We also thank the two
NGOs (Committed Communities Development Trust and Centre for the
Study of Social Change) who permitted us for data collection in urban slums.
We thank Dr. J C Sharma and Dr. Rati Jani for helping us in statistical analysis
and interpretation.
Received: 3 April 2014 Accepted: 10 November 2014
References
1. Black RE, Allen LH, Bhutta ZA, Caulfield LE, de Onis M, Ezzati M, Mathers C,
Rivera J: Maternal and child undernutrition: global and regional
exposures and health consequences. Lancet 2008, 371:243–260.
2. UNICEF: Tracking Progress on Child and Maternal Nutrition: A Survival and
Development Priority. New York, USA: UNICEF; 2009.
3. NFHS: National Family Health Survey (NFHS-3). India: National Fact Sheet; 2006.
4. Ruel MT: Operationalizing dietary diversity: a review of measurement
issues and research priorities. J Nutr 2003, 133:3911S–3926S.
5. Srivastava DN, Sandhu A: Index for measuring child feeding practices.
Indian J Pediatr 2007, 74:363–368.
6. Garg A, Chadha R: Index for measuring the quality of complementary
feeding practices in rural India. J Health Popul Nutr 2009, 27:763–771.
7. Ma J-Q, Zhou L-L, Hu Y-Q, Liu J-R, Liu S-S, Zhang J, Sheng X-Y: A summary
index of infant and child feeding practices is associated with child
growth in urban Shanghai. BMC Public Health 2012, 12:568.
8. Arabi M, Frongillo EA, Avula R, Mangasaryan N: Infant and young child
feeding in developing countries. Child Dev 2012, 83(1):32–45.
Lohia and Udipi BMC Pediatrics 2014, 14:290
/>
9.
10.
11.
12.
13.
14.
15.
16.
17.
18.
19.
20.
21.
22.
23.
24.
25.
26.
27.
28.
IIPS and UNICEF: Comprehensive Nutrition Survey in Maharashtra (CNSM)
Report. International Institute for Population Sciences and United Nations
Children’s Fund, 2012. Mumbai: IIPS; 2013.
Dasgupta A, Naiya S, Ray S, Ghosal A, Pravakar R, Parthasarathin R:
Assessment of infant and young child feeding practices among the
mothers in a slum area of Kolkata: A cross-sectional study. Int J Biol Med
Res 2014, 5(1):3855–3861.
Ruel MT, Menon P: Creating a Child Feeding Index Using the Demographic
and Health Surveys: An Example from Latin America. Washington, DC:
International Food Policy Research Institute; 2002.
Ruel MT, Menon P: Child feeding practices Are associated with child
nutritional status in Latin America: innovative uses of the demographic
and health surveys. J Nutr 2002, 132:1180–1187.
Sawadogo PS, Martin-Prével Y, Savy M, Kameli Y, Traissac P, Traoré AS,
Delpeuch F: An infant and child feeding index is associated with the
nutritional status of 6- to 23-month-Old children in rural Burkina Faso.
J Nutr 2006, 136:656–663.
Moursi MM, Martin-Prével Y, Eymard-Duvernay S, Capon G, Trèche S, Maire
B, Delpeuch F: Assessment of child feeding practices using a summary
index: stability over time and association with child growth in urban
Madagascar. Am J Clin Nutr 2008, 87:1472–1479.
Khatoon T, Mollah MAH, Choudhury AM, Islam MM, Rahman KM:
Association between infant and child-feeding index and nutritional
status: results from a cross-sectional study among children attending an
urban hospital in Bangladesh. J Health Popul Nutr 2011, 29:349–356.
Bork K, Cames C, Barigou S, Cournil A, Diallo A: A summary index of
feeding practices is positively associated with height-for-Age, but only
marginally with linear growth, in rural Senegalese infants and toddlers.
J Nutr 2012, 142:1116–1122.
Arimond M, Ruel MT: Progress in developing an infant and child feeding
index: an example using the Ethiopia Demographic and Health Survey
2000. Food Consumption Nutr Division Discuss Paper 2002, 143:2002.
WHO: WHO Child Growth Standards. Length-for-age, weight-for-age,
weight-for-length, weight-for-height and body mass index for-age.
Methods and Development. Department of Nutrition for Health and
Development. In Geneva: World Health organization; 2006:50–221
[ />report_1/en/]
Arimond M, Ruel MT: Summary Indicators for Infant and Child Feeding Practices:
An Example from the Ethiopia Demographic and Health Survey 2000; 2002.
Kumar D, Goel NK, Mittal PC, Misra P: Influence of infant-feeding practices on
nutritional status of under-five children. Indian J Pediatr 2006, 73:417–421.
Ramji S: Impact of infant & young child feeding & caring practices on
nutritional status & health. Indian J Med Res 2009, 130:642-626.
Palwala M, Sharma S, Udipi S, Ghugre P, Kothari G, Sawardekar P:
Nutritional quality of diets fed to young children in urban slums can be
improved by intensive nutrition education. Res Article 2009, 30:317–326.
Ntab B, Simondon KB, Milet J, Cissé B, Sokhna C, Boulanger D, Simondon F:
A young child feeding index is Not associated with either height-for-Age
or height velocity in rural Senegalese children. J Nutr 2005, 135:457–464.
Malik AS, Mazhar AU: Assessment of nutritional status of children under
48 months of age. Pak Paed J 2006, 30(1):38–47.
Lutter C: Meeting the challenges to improve complementary feeding.
SCN News 2003, 27:4–9.
Martorell R, Khan LK, Schroeder DG: Reversibility of stunting:
epidemiological findings in children from developing countries. Eur J Clin
Nutr 1994, 48(Suppl 1):S45–S57.
Armar-Klemesu M, Ruel MT, Maxwell DG, Levin CE, Morris SS: Poor maternal
schooling is the main constraint to good child care practices in Accra.
J Nutr 2000, 130:1597–1607.
Dewey KG, Brown KH: Update on technical issues concerning
complementary feeding of young children in developing countries and
implications for intervention programs. Food Nutr Bull 2003, 24:5–28.
doi:10.1186/s12887-014-0290-7
Cite this article as: Lohia and Udipi: Infant and child feeding index
reflects feeding practices, nutritional status of urban slum children. BMC
Pediatrics 2014 14:290.
Page 11 of 11
Submit your next manuscript to BioMed Central
and take full advantage of:
• Convenient online submission
• Thorough peer review
• No space constraints or color figure charges
• Immediate publication on acceptance
• Inclusion in PubMed, CAS, Scopus and Google Scholar
• Research which is freely available for redistribution
Submit your manuscript at
www.biomedcentral.com/submit