The Health Initiative Program for Kids (HIP Kids): Effects of a 1-year multidisciplinary lifestyle intervention on adiposity and quality of life in obese children and adolescents - a
Bạn đang xem bản rút gọn của tài liệu. Xem và tải ngay bản đầy đủ của tài liệu tại đây (561.38 KB, 9 trang )
Bock et al. BMC Pediatrics 2014, 14:296
/>
RESEARCH ARTICLE
Open Access
The Health Initiative Program for Kids (HIP Kids):
effects of a 1-year multidisciplinary lifestyle
intervention on adiposity and quality of life in
obese children and adolescents - a longitudinal
pilot intervention study
Dirk E Bock1,3*, Tracy Robinson1, Jamie A Seabrook1,4,6, Meghan Rombeek1, Kambiz Norozi1,2,3,4, Guido Filler1,3,4,
Ralf Rauch1,5 and Cheril L Clarson1,3,4
Abstract
Background: Though recent data suggest that multidisciplinary outpatient interventions can have a positive effect
on childhood obesity, it is still unclear which program components are most beneficial and how they affect quality
of life (QoL). The aim of this study was to determine if a 1-year multidisciplinary, family-centered outpatient
intervention based on social cognitive theory would be effective in (i) preventing further increases in BMI
and BMI z-score, and (ii) improving QoL in obese children and adolescents.
Methods: Obese children and adolescents 8–17 years of age and their families participated in this 1-year longitudinal
pilot intervention study. The intervention consisted of fifteen 90-minute educational sessions led by a dietitian, exercise
specialist, and social worker. Anthropometric measures, body composition, and QoL (Pediatric Quality of Life Inventory
4.0), were assessed at baseline, 3 months, and 12 months. Laboratory values were measured at baseline and 12 months.
The primary outcome measures were change in BMI and BMI z-score, secondary outcome measures included change
in QoL and body composition. A paired sample t-test was used to assess within-group differences and 95% confidence
intervals were reported for the mean differences.
Results: 42 obese children and adolescents (21 girls) completed the 1-year intervention (mean age 12.8 ± 3.14 years).
Mean baseline BMI was 31.96 ± 5.94 kg/m2 and BMI z-score was +2.19 ± 0.34. Baseline QoL (self-assessments and
parental assessments) was impaired: mean baseline scores were 74.5 ± 16.5 and 63.7 ± 19.4 for physical functioning
and 69.0 ± 14.9 and 64.0 ± 18.3 for emotional functioning, respectively. At 12 months, BMI z-score had decreased
(−0.07 ± 0.11, 95% CI: −0.11 to −0.04). BMI (0.80 ± 1.57 kg/m2, 95% CI 0.31 to 1.29) and fat-free mass (4.02 ± 6.27 kg,
95% CI 1.90 to 6.14) increased, but % body fat and waist circumference did not. Both the parent-reported physical
(11.3 ± 19.2, 95% CI 4.7 to 17.9) and emotional (7.7 ± 15.7, 95% CI 2.3 to 13.0) functioning QoL scores and the children's
self-reported physical (5.3 ± 17.1, 95% CI 0.5 to 11.1) and emotional (7.9 ± 14.3, 95% CI 3.2 to 12.7) functioning scores
significantly improved.
(Continued on next page)
* Correspondence:
1
Department of Pediatrics, Children’s Hospital, London Health Sciences
Centre, Western University, 800 Commissioners Road East, London, ON N6A
5W9, Canada
3
Lawson Health Research Institute, 750 Base Line Road, Suite 300, London,
ON N6C 2R5, Canada
Full list of author information is available at the end of the article
© 2014 Bock et al.; licensee BioMed Central Ltd. This is an Open Access article distributed under the terms of the Creative
Commons Attribution License ( which permits unrestricted use, distribution, and
reproduction in any medium, provided the original work is properly credited. The Creative Commons Public Domain
Dedication waiver ( applies to the data made available in this article,
unless otherwise stated.
Bock et al. BMC Pediatrics 2014, 14:296
/>
Page 2 of 9
(Continued from previous page)
Conclusions: Following a 1-year intervention, the participants’ BMI z-scores and QoL improved, while other
adiposity-related measures of body composition remained unchanged.
Trial registration: UMIN Clinical Trials Registry UMIN000015622.
Keywords: Obesity, Overweight, Behavior modification, Family-centered, BMI z-score, Nutrition, Pediatric, Outpatient,
Childhood, Youth
Background
The rate of childhood obesity in North America has more
than tripled over the past 30 years: approximately 32% of
North American children are now overweight and between 11.7% and 16.9% are obese [1,2]. Many major physical and psychological comorbidities are associated with
childhood obesity, including hypertension, dyslipidemia,
impaired glucose tolerance, obstructive sleep apnea, and
depression [3-5]. Studies have also shown that quality of
life (QoL) in this population is impaired [6,7]. Moreover,
the majority of those obese during adolescence remain so
through adulthood, and this adverse metabolic profile results in sequelae that impose major health and economic
challenges on both the individual and society [8,9].
Studies implementing a comprehensive set of multidisciplinary lifestyle interventions that focus on the whole
family and incorporate changes in diet, physical activity,
and behavior have been found to reduce the degree of
obesity in affected children [10-12]. Nevertheless, the
availability and accessibility of such interventions is limited, particularly at a community level, and their effects
vary substantially, depending on the design of the intervention, the participants’ age, the level of parental involvement, and other factors [10].
In 2008, the Provincial Council for Children’s Health
(PCCH) in Ontario, Canada, identified a severe lack of
comprehensive secondary and tertiary care treatment
programs for children and adolescents with moderate or
severe obesity-related morbidities and for those who had
been unsuccessful with primary care management. In
their proposed framework, the PCCH suggested comparing an interventional model incorporating structure and
resources for effective secondary and tertiary care interventions with the anticipated long-term health consequences and related health care costs associated with
not providing such an intervention [PCCH Expert Panel
for Child and Youth Overweight and Obesity, Provincial
Council for Maternal and Child Health. A Proposed
Service Delivery Framework for Healthy Weights for
Children and Youth across the Continuum of Care:
Toronto, 2008 - unpublished data].
The Health Initiative Program for Kids (HIP Kids) was
developed both to address this report and to create such
an intervention in southwestern Ontario where, despite
being in high demand, no such interventions existed. The
program follows a pilot intervention model and merges
the gap between the needs of obese children and adolescents and their families and the medical and research
community. The aim of this research was to prospectively
evaluate whether HIP Kids, a 1-year multidisciplinary,
family-centered hospital outpatient clinic-based intervention for obese children and adolescents and their families,
would be effective in preventing further increases in body
mass index (BMI) and BMI standard deviation score (BMI
z-score, BMI-Z) and in improving QoL. We hypothesized
that the HIP Kids program will i) prevent further increases
in BMI and BMI-Z, and ii) increase standardized QoL
scores in intervention subjects over the study period.
Methods
Design and study population
Between March 2009 and January 2011, family physicians
and pediatricians in London, Ontario and surrounding
communities were invited to refer obese children and adolescents to the HIP Kids program. Eligible participants
were prospectively enrolled in the order in which they
were referred, in an effort to create a sample largely reflective of those obese children who had not experienced success through initial office-based counseling alone. Upon
referral, a pre-screening appointment was scheduled with
the team social worker to assess eligibility, family needs,
and commitment. Those aged 8–17 with primary obesity
(BMI, calculated as weight in kilograms divided by height
in meters squared, at or above the 95th percentile for
age and sex, Centers for Disease Control and Prevention
October 2000 growth charts), and who had at least one
caregiver willing to participate in the program sessions
were eligible for the study [13].
HIP Kids operated as an evening clinic to increase accessibility and provided individualized lifestyle education for
participants and their families. The core multidisciplinary
team consisted of a registered dietitian, exercise specialist,
social worker, and pediatrician. The 1-year intervention
consisted of an initial 3-month intensive phase with
bi-weekly individual counseling sessions, followed by a
9-month maintenance phase with alternating monthly
individual or group sessions. Each of the 15 sessions
was 90 minutes in length and was divided into three
30-minute educational blocks focusing on nutrition, physical activity, and psychosocial and behavioral aspects.
Bock et al. BMC Pediatrics 2014, 14:296
/>
These educational blocks were led by a dietitian, exercise
specialist, and social worker, respectively. A pediatrician
performed the medical assessments and discussed the participant’s laboratory results at the initial and exit visits,
and provided medical counseling when needed. Although
it was only mandatory for the participant and one parent
to attend, the participation of both parents, siblings, and
other caregivers was continuously encouraged. Session attendance was recorded. Family involvement was central to
the program design and included jointly developing strategies for attaining short and long-term goals, as well as
the goals themselves. The strategies and skills required for
a successful lifestyle modification which were discussed
during sessions were based on social cognitive theory discussed by Bandura and on Epstein's model of family-based
interventions, and included the following three key domains [14-16]: (i) nutrition (e.g., Canada’s Food Guide recommendations, food label reading, portion size, healthy
recipes); (ii) physical activity (e.g., how to incorporate
physical activity recommendations into daily life, make
them fun, and involve the whole family, limiting screen
time); and (iii) parenting/psychosocial factors (e.g., parenting styles, modeling and reinforcing desired behaviors,
modifying the home environment). Discussion topics and
strategies for overcoming barriers and for meeting previously set goals were all reassessed over the course of the
intervention. Struggling families were continuously encouraged and received focused support directed at guiding
them to overcome the challenges that had prevented them
from achieving their goals. An intake visit was scheduled
prior to the start of the program to review details of the
program and to perform an initial study assessment (as
described below) and a physical examination. Similarly,
the exit visit at the end of the program incorporated final
assessments and a physical exam, as well as program results, future goals, and participant feedback.
The study was approved by the University of Western
Ontario Health Sciences Research Ethics Board and written informed consent was obtained from participating
children and caregivers.
Page 3 of 9
was measured in the standing position midway between
the iliac crest and the lowest rib to the nearest 0.1 cm
using a constant tension tape. Body composition (percent body fat (BF%), fat-free mass (FFM)) was assessed
through Bioelectrical Impedance Analysis (BIA) using a
Tanita TBF-300 GS body composition analyzer (Tanita
Corporation, Tokyo, Japan) [17]. The body composition of
a subsample of patients was also measured through Dual
energy X-ray absorptiometry (DXA) using a Hologic QDR
4500 (Hologic, Inc., Bedford, USA), to assess the correlation between BIA- and DXA-derived measurements [see
Additional file 1].
Fasting glucose, insulin, LDL and HDL cholesterol, triglycerides, AST, and ALT were measured. A standard oral
glucose tolerance test (oGTT) was used to assess glucose
tolerance, with impaired glucose tolerance (IGT) defined
as a 2-hour plasma glucose between 7.8 and 11.0 mmol/L
and diabetes as a 2-hour plasma glucose ≥ 11.1 mmol/L.
The Homeostasis Model Assessment (HOMA-IR = fasting
plasma insulin (μU/mL) × fasting serum glucose (mmol/L)/
22.5) was used to determine insulin resistance, defined as
a HOMA ≥ 3.0 [18]. Hypertriglyceridemia was defined as
triglycerides ≥ 1.50 mmol/L.
Three-day food records were used to assess dietary intake
and eating patterns with “servings” defined according to
Health Canada’s “Eating Well with Canada's Food Guide”.
The Pediatric Quality of Life Inventory 4.0 (PedsQL) Child
(age 8–12) and Teen (age 13–18) Report and Parent
Reports were used to assess QoL and consisted of 23-item
validated self-report questionnaires (maximum total score
100). Reported scores [SD] for Physical and Emotional
Functioning in healthy children are 84.4 [17.3] and
80.9 [19.6] (Child Report), and 89.3 [16.4] and 82.6 [17.5]
(Parent Report), respectively [19]. The Physical Activity
Questionnaires for children and adolescents (PAQ-C,
PAQ-A, ages 8–14 and >14, respectively) were used to assess physical activity behavior from the previous 7 days
(minimum score 1, maximum score 5, indicating a low
and high physical activity level) [20,21].
Statistical analyses
Measures
All assessments were performed at the beginning and at
the end of the program (baseline and 12 months). Additional anthropometric and body composition measures
were obtained at 3 months, following the intensive phase
of the program.
Height (to the nearest 0.1 cm) and weight (to the nearest 0.1 kg) were measured using standardized and calibrated equipment (stadiometer and scale, respectively),
and were used to calculate BMI (BMI = weight/height2).
BMI-Z was calculated using the U.S. Centers for Disease
Control and Prevention reference data, which includes
data for different ethnicities. Waist circumference (WC)
Data were analyzed using IBM SPSS Statistics, version 20.0.
Continuous variables were expressed as means and standard
deviation (SD), and percentages were used to summarize categorical variables. Within-group differences were assessed
using a paired sample t-test, and the 95% confidence interval
was reported for the mean difference. Skewed continuous
variables were reported as median and range, and the
Wilcoxon signed-rank test was used to compare median differences between start and finish for skewed continuous variables. A P value < 0.05 was considered statistically significant.
An a priori sample size calculation was not performed since
this study aimed to pilot our intervention in a first sample
of children to inform a subsequent larger trial.
Bock et al. BMC Pediatrics 2014, 14:296
/>
Results
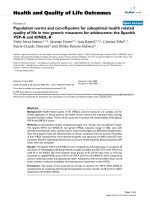
Of the 88 childern who enrolled, 82 began the intervention. 17 left the study during the first phase of the program and 23 during the second phase (Figure 1). Data
for the 42 children who completed the study (retention
rate 47.7%) were included in the final analysis. Reasons
given for leaving the intervention included: too busy (5),
lack of interest (5), program not meeting needs (4), moving (3), while 25 families did not provide a reason for
their discontinuation (Figure 1). Of those who withdrew,
multiple participants verbally stated that they have found
it challenging to build a trustful relationship with new
members of the research team following changes in staff.
Of the 42 children (21 boys) who completed the study,
mean age [SD] at baseline was 12.8 [3.14] years. 34 children
(81%) were Caucasian, two (4.8%) were African American
and Hispanic, respectively, one (2.4%) was of Aboriginal
descent, and 3 (7.1%) were of Arabic descent. Mean
Tanner Stage was 3, mean BMI [SD] was 31.96 [5.94]
kg/m2, and mean BMI-Z was [SD] 2.19 [0.34]. QoL (specifically physical and emotional functioning) was impaired
according to both the children’s and parental assessments,
with mean baseline scores [SD] of 74.5 [16.5] and 63.7
Page 4 of 9
[19.4] for physical functioning, and 69.0 [14.9] and 64.0
[18.3] for emotional functioning. 20 participants were
insulin-resistant, 1 had IGT, 10 had acanthosis nigricans,
and 11 had hypertriglyceridemia.
Mean baseline characteristics were similar between the
study population and those who withdrew. A breakdown
by gender, however, revealed that those who withdrew
were more likely to be female and were, on average,
1.2 years older and more obese (higher BMI, % body fat,
WC) than girls in the study group (Table 1).
Participants attended a mean [SD] of 75% [15.0] of all
educational sessions. Following the first, more intensive
program phase, BMI-Z slightly decreased (mean [SD] −0.04
[0.09]; 95% CI −0.07 to −0.02; P = .004), and BMI remained
largely unchanged (mean [SD] -0.07 [1.01]; 95% CI −0.39
to 0.24; P = .66). Body composition did not change in a
statistically significant way (Table 2). BMI-Z significantly decreased by the end of the 1-year program
(mean [SD] -0.07 [0.11]; 95% CI −0.11 to −0.04; P = <.001).
BMI increased (mean [SD] 0.80 [1.57]; 95% CI 0.31 to
1.29), but mean %BF and WC remained largely unchanged.
FFM significantly increased (mean [SD] 4.02 [6.27] kg;
95% CI 1.90 to 6.14; P = <.001, Table 3).
Figure 1 Flow of subject progress from point of referral until the end of the 12-month intervention.
Bock et al. BMC Pediatrics 2014, 14:296
/>
Page 5 of 9
Table 1 Baseline characteristics of the total sample (Study population and Population that withdrew), separated by sex
Study population (n = 42)
n, No. (%)
Population that withdrew (n = 46)
Total
Boys
Girls
Total
Boys
Girls
42 (100)
21 (50.0)
21 (50.0)
46 (100)
16 (34.8)
30 (65.2)
Age, mean (SD), y
12.8 (3.14)
13.5 (2.59)
12.2 (3.49)
12.7 (2.95)
11.14 (2.11)
13.43 (3.02)
Body mass index, mean (SD), kg/m2
31.96 (5.94)
32.63 (5.97)
31.29 (5.67)
32.08 (6.49)
29.17 (6.88)
33.63 (5.69)
Body mass index z -score, mean (SD)
2.19 (0.34)
2.16 (0.34)
2.22 (0.34)
2.19 (0.32)
2.08 (0.35)
2.25 (0.29)
Waist circumference, mean (SD), cm
103.10 (14.66)
107.35 (15.47)
97.84 (11.60)
102.26 (16.32)
97.09 (16.78)
104.94 (15.41)
Body fat (BIA), mean (SD), %
40.95 (7.24)
39.96 (9.01)
41.95 (4.64)
41.89 (6.86)
37.26 (7.25)
44.87 (4.95)
Fat-free mass (BIA), mean (SD), kg
48.89 (15.00)
53.61 (16.89)
44.16 (10.94)
44.55 (10.67)
38.72 (7.70)
48.55 (7.45)
Tanner Stage, mean (SD)
3 (1.66)
3 (1.62)
3 (1.70)
3 (1.73)
2 (1.39)
4 (1.54)
QoL - Physical Functioning Score,
Child report, mean (SD)
74.45 (16.47)
75.18 (13.19)
73.79 (18.93)
75.05 (15.89)
78.26 (10.84)
73.39 (17.73)
QoL - Physical Functioning Score,
Parent report, mean (SD)
63.70 (19.43)
60.20 (20.90)
67.21 (17.13)
64.17 (17.86)
70.97 (13.23)
60.21 (18.97)
QoL - Emotional Functioning Score,
Child report, mean (SD)
69.04 (14.86)
67.54 (15.00)
70.40 (14.59)
68.66 (17.16)
66.78 (16.28)
69.63 (17.52)
QoL - Emotional Functioning Score,
Parent report, mean (SD)
64.02 (18.29)
68.48 (20.65)
70.34 (15.19)
63.19 (16.66)
65.70 (14.28)
61.73 (17.74)
Physical activity score, mean (SD)
2.26 (0.76)
2.40 (0.82)
2.12 (0.67)
2.47 (0.63)
2.69 (0.61)
2.37 (0.61)
QoL parameters, expressed through the physical and
emotional functioning scores, improved over the course
of the study. Increases in both parent-reported scores
(mean [SD] 11.3 [19.2]; 95% CI 4.7 to 17.9; P = .001, and
mean [SD] 7.7 [15.7]; 95% CI 2.3 to 13.0; P = .007, respectively), and in the child-reported emotional functioning score (mean [SD] 7.9 [14.3]; 95% CI 3.2 to 12.7;
P = .002) reached statistical significance (Table 3). The
Physical Activity Score increased by 9.7%, reflecting a
trend towards improvement (P = .06).
With regard to nutrition parameters, reported daily
consumption of sugar-sweetened beverages decreased
(P = .01), as did the intake of milk and alternative products (P = .05). None of the other nutrition or laboratory
parameters assessed during the study showed any statistically significant improvements (Table 4).
Table 2 Anthropometric and body composition changes
from baseline to 3 months (end of the intensive program
phase)
Mean (SD)
difference
95% CI
1.00 (1.07)
0.66 to 1.34
P value
(n = 41)
Height, cm
< 0.01
Body mass index, kg/m
−0.07 (1.01)
−0.39 to 0.24
0.66
Body mass index z –score
−0.04 (0.09)
−0.07 to −0.02
< 0.01
2
Body fat (BIA), %
−1.39 (5.15)
−3.05 to 0.28
0.10
Fat-free mass (BIA), kg
0.99 (4.96)
−0.62 to 2.60
0.22
The total program delivery cost per participant was
$3240 (CAD), based on material costs and 836 face-toface and 418 indirect staff hours per year.
Discussion
This study assessed whether the HIP Kids program prevented further increases in participants’ BMI and BMI-Z,
and whether it improved QoL. During the initial phase of
the intervention, the participants’ BMI-Z decreased and
their BMI did not increase. During the second, less intensive 9-month maintenance phase, BMI-Z continued to decrease, but BMI increased. Participant growth may explain
this discrepancy, where absolute BMI increased in these
growing children due to an increase in absolute weight.
Our findings that only FFM (but not % BF or WC) increased over the study period support this notion. Increases in muscle mass secondary to increased levels of
physical activity may have also contributed to the observed
increase in FFM and BMI. BMI-Z, a measure adjusted for
height, age, and sex relative to a smoothed reference
distribution, seems more fitting for taking such growthrelated changes into account [22]. Additionally, although
BMI and BMI-Z are known to correlate with adiposity and have been commonly used as primary outcome measures in lifestyle interventions, they have
limitations. For example, neither parameter can differentiate between lean body mass and body fat. We included measures of body composition as secondary
outcomes in our study to address this limitation. Furthermore, since the onset of puberty varies among children,
Bock et al. BMC Pediatrics 2014, 14:296
/>
Page 6 of 9
Table 3 Changes in anthropometrics, body composition, quality of life, and physical activity from baseline to
12 months
Mean (SD) difference
P value
95% CI
(n = 42)
Height, cm
4.25 (3.07)
2
3.29 to 5.20
< 0.01
Body mass index, kg/m
0.80 (1.57)
0.31 to 1.29
< 0.01
Body mass index z-score
−0.07 (0.11)
−0.11 to −0.04
< 0.01
Waist circumference, cm
−0.31 (5.90)
−2.25 to 1.63
0.75
Body fat (BIA), %
−0.73 (5.18)
−2.48 to 1.03
0.41
Fat-free mass (BIA), kg
4.02 (6.27)
1.90 to 6.14
< 0.01
QoL - Physical Functioning Score, Child report
5.34 (17.12)
0.45 to 11.14
0.07
QoL - Physical Functioning Score, Parent report
11.34 (19.20)
4.74 to 17.94
< 0.01
QoL - Emotional Functioning Score, Child report
7.94 (14.32)
3.16 to 12.71
< 0.01
QoL - Emotional Functioning Score, Parent report
7.65 (15.69)
2.26 to 13.04
0.01
Physical Activity Score
0.22 (0.69)
−0.01 to 0.45
0.06
BMI-Z may have decreased if the majority of study
participants experienced an earlier growth spurt than
their age-matched peers in the reference population. Data
on growth spurt onset and peak growth velocity for the
CDC reference population is not available to provide a
comparison.
The BMI-Z of our study population decreased by 0.07
(mean; 95% CI −0.11 to −0.04). While this is a modest,
albeit statistically significant decrease, it is in accordance
with findings from recent meta-analyses of RCTs that
showed that when pooled together, outpatient childhood
obesity treatment programs produced a decrease in
BMI-Z of 0.06 to 0.10 compared to control or minimal
intervention groups [23,24].
Obese children and adolescents are highly at risk of
developing significant impairments in QoL. Contributing
factors include lower levels of self-esteem, self-confidence,
and physical activity, bullying, and a higher risk of depression [6,7,25]. Longitudinal studies have also indicated that pediatric obesity both precedes and predicts the
development of low self-esteem [7]. It is not surprising,
then, that the baseline QoL scores of our study population
indicated a lower QoL. This is consistent with crosssectional results from Schwimmer et al., who used the
Table 4 Changes in laboratory and nutrition parameters from baseline to 12 months (end of program)
P value
Laboratory values (n = 37)
Mean (SD) baseline
Mean (SD) 12 months
95% CI
Insulin, pmol/L
110.90 (59.15)
135.51 (79.824)
−4.83 to 54.05
0.10
Glucose (fasting), mmol/L
4.91 (0.38)
5.04 (0.37)
0.01 to 0.24
0.04
HOMA-IR
3.50 (1.91)
4.31 (2.55)
−0.15 to 1.78
0.10
HDL-cholesterol, mmol/L
1.11 (0.26)
1.14 (0.30)
−0.03 to 0.08
0.36
LDL-cholesterol, mmol/L
2.33 (0.53)
2.41 (0.60)
−0.11 to 0.25
0.42
Triglycerides, mmol/L
1.26 (0.63)
1.28 (0.52)
−0.17 to 0.19
0.90
Aspartate aminotransferase, U/L
26.46 (7.15)
24.26 (10.65)
−5.39 to 0.99
0.17
Alanine aminotransferase, U/L
30.35 (16.00)
28.26 (21.82)
−9.06 to 4.88
0.55
4.45 (2.56)
5.22 (3.20)
−1.81 to 0.27
0.14
Nutrition parameters (n = 30)
Fruit & vegetables (servings/day)
Grain products (servings/day)
6.36 (2.35)
5.75 (2.05)
−0.40 to 1.60
0.23
Milk & Alternatives (servings/day)
2.58 (1.22)
2.19 (1.16)
0.00 to 0.78
0.05
Meat & Alternatives (servings/day)
1.86 (0.86)
1.74 (1.01)
−0.27 to 0.50
0.55
Snack consumption (servings/day)
1.82 (0.77)
1.59 (0.95)
−0.14 to 0.60
0.17
0.33 (0.00 – 2.33)
0.00 (0.00 – 2.00)
0.01
0.33 (0.00 – 5.33)
0.33 (0.00 – 3.00)
0.77
Sugar-sweetened beverages (servings/day)
Juice consumption (servings/day)1
1
1
Results expressed as median (range) due to unequally distributed (skewed) values.
Bock et al. BMC Pediatrics 2014, 14:296
/>
same QoL assessment tool and found mean QoL scores
between 60.9 and 71.0 in a cohort of more obese children,
compared to scores between 80.9 and 92.5 in healthy children [26]. Our study demonstrated that the intervention
led to a statistically significant improvement in QoL, with
mean score increases ranging from 5.3 to 11.3. This adds
to the limited data showing that multidisciplinary, familycentered, outpatient lifestyle interventions may improve
QoL in obese children and adolescents [6,27,28].
With regard to effects on physical activity (PA), although the 9.7% increase in the PAQ score over the
course of the program may be interpreted as a positive
trend, it did not reach statistical significance. PAQ may
be more sensitive at capturing moderate-to-vigorous PA
and consequently less sensitive at capturing overall physical activity [21]. Measures based on self-reporting also
have limitations such as potential recall bias, reporting inaccuracies based on other factors such as feeling ashamed
for not reaching set goals or for poor adherence, or wanting to provide answers that are thought to be desired. The
emotional state of the participant when filling in the questionnaire may also play a role. Therefore, the reported
PA performed over the previous 7 days may not have
been completely accurate. On the other hand, while counseling on how to achieve a more active lifestyle was a
regular part of all educational sessions, actual moderateto-vigorous intensity PA was only provided during group
sessions. This may not have been enough to promote a
significant day-to-day increase in higher-intensity PA in
participants' daily routines.
With the exception of sugar-sweetened beverage (SSB)
and milk and alternative product consumption, no statistically significant changes were seen in the laboratory
and nutrition parameters assessed during the study. Improvements in insulin sensitivity through PA are well
documented in the literature published on this topic.
LeBlanc et al. also demonstrated a dose–response relationship between the amount of moderate-to-vigorous
PA and improvements in lipid parameters [29]. It is therefore possible that a more pronounced increase in PA
would have been necessary to produce a positive effect on
the laboratory-based outcomes. A greater reduction in BF
may have also contributed to an improved insulin sensitivity and lipid profile.
The observed decrease in SSB consumption must be
interpreted with caution. Not only were the values skewed,
but the reported intake both at baseline and especially at
12 months was much lower than values seen in the literature for this population, which may indicate underreporting [30].
Our study possesses several strengths, including a multidisciplinary, family-centered design according to evidencebased recommendations [12,31]. Program session frequency
(bi-weekly to monthly) was also consistent with findings
Page 7 of 9
from Hampl et al., whose study showed that 74% of the 24
U.S. pediatric obesity clinics and 78% of the 24 U.S.
pediatric obesity programs included in their analysis offered these session intervals [32]. Conducting the majority
of program sessions as individual sessions also allowed us
to tailor counseling and goal setting according to each
family’s needs and their specific obesity-related triggers.
There is still little data on the impact of obesity interventions on QoL in children and adolescents and a need
for more research in this area has been identified [6].
Our results add to the limited data that indicate that
multidisciplinary obesity interventions can have a positive impact on QoL and provide more detailed insight
into specific QoL domains using a validated and recognized tool.
Furthermore, given the current prevalence of childhood
obesity, generating information on related health care
costs is becoming increasingly important. Therefore, our
data on program delivery costs may assist others in determining program budgets and in calculating health care
costs for this type of study population.
This study also has several limitations. As a pilot study
designed to meet the clinical needs of our local population, this phase of HIP Kids was not designed as a controlled trial. Since an a priori sample size calculation was
not performed, non-significant findings may have been
the result of inadequate statistical power. The attrition
rate of 52% was also somewhat higher than the up to
42% reported in recent meta-analyses for RCTs examining pediatric obesity interventions and reporting dropout
rates [10]. Of note, most of the analyzed studies did not
adequately report attrition. Given that two-thirds of those
who withdrew from our study were adolescent girls, HIP
Kids may not have properly met the needs of female participants. Tailoring the program more specifically to the
different needs and expectations of adolescent boys and
girls may have reduced attrition. This would be in keeping
with data by Knöpfli et al., who demonstrated significant
gender-related differences in intervention outcomes favoring boys in a larger inpatient cohort [33]. Other potential
contributing factors may have included a lack of standardized motivational pre-screening, accepting participants
living up to 1.5 hours driving distance away, a hospitalrather than a community-based program location, and the
decreased frequency of sessions during the 9-month maintenance phase of the program. The latter may not have
been sufficient to keep participants motivated and committed. Also, staff changes during the course of the program may have affected the ability of some participants to
maintain a trustful relationship with the team and may
have contributed to the observed attrition. Still, a thorough interview process and mandatory standardized training of all newly hired personnel had been in place to
minimize the impact of staff changes on attrition.
Bock et al. BMC Pediatrics 2014, 14:296
/>
Conclusion
In an era when obesity has become one of the most prevalent health concerns for children and adolescents, there is
still a need for more data to determine the ideal design
and the effectiveness of treatment interventions for this
condition. This pilot study served to create and assess a
program based on the 2008 PCCH recommendations in
southwestern Ontario, Canada, where none existed before,
and to estimate the costs associated with providing such
an intervention.
The results of our study indicate that although the
HIP Kids multidisciplinary lifestyle intervention program
did not prevent the participants’ raw BMI score from increasing over the course of the intervention, it reduced
participants’ BMI-Z scores, improved health-related QoL
outcomes and prevented further increases in other measures of adiposity (% BF, WC). Our results also suggest
that raw BMI may not correlate strongly enough with
changes in adiposity to be a useful primary outcome parameter for determining the effectiveness of pediatric
obesity intervention studies. Future research into the development of effective intervention strategies in the studied
population should focus on the following: (i) generating
more data on health-related QoL outcomes; (ii) examining
whether a community setting is more effective than a hospital setting and if this leads to a higher retention rate; and
(iii) tailoring interventions to the gender-specific needs of
obese adolescents. Lastly, to further improve retention, interventions should include a standardized, motivational
pre-screening tool (a “Readiness to Change” assessment),
and researchers may consider defining a maximal residential radius from the program site in their inclusion criteria.
Additional file
Additional file 1: Table S1. Correlation between BIA- and DXA-derived
body composition measures at baseline and 12 months in a subsample
of participants. This data shows our correlation analysis of body composition
measures derived by BIA and DXA in a subsample of participants and
demonstrates that the two compared methods very highly correlate for
measuring fat-free mass and highly correlate for measuring body fat.
Abbreviations
BF%: Percent body fat; BMI: Body mass index; BMI-Z: BMI z-score; FFM: Fat-free
mass; IGT: Impaired glucose tolerance; oGTT: Oral glucose tolerance test;
PAQ-C/PAQ-A: Physical Activity Questionnaire for children/for adolescents;
PCCH: Provincial Council for Children’s Health; PedsQL: Pediatric Quality of Life
Inventory 4.0; QoL: Quality of Life; WC: Waist circumference.
Competing interests
The authors declare that they have no competing interests.
Authors’ contributions
DB participated in the conception of the study, in data acquisition, in
performing the statistical analysis, and drafted the manuscript. TR
participated in the conception of the study, in data acquisition, in study
administration, and assisted in drafting the manuscript. JS performed the
statistical analysis, and critically reviewed the manuscript. MR participated in
data acquisition, and critically reviewed the manuscript. KN participated in
Page 8 of 9
data acquisition, and critically reviewed the manuscript. GF participated in
the conception of the study, in data acquisition, and critically reviewed the
manuscript. RR participated in data acquisition, and critically reviewed the
manuscript. CC participated in the conception of the study, in data
acquisition, and critically reviewed the manuscript. All authors read and
approved the final manuscript.
Acknowledgements
We thank all children, their families, and all team members who participated
in the HIP Kids study. We especially thank Johanna Kaipainen, RD, for
spearheading the first clinical HIP Kids initiative in 2007, a clinical program
from which the current study was developed. We also thank Marta
Kobrzynski, research assistant to Guido Filler, for her final editing. The Quality of
Life assessment described in this study was carried out using the PedsQL™,
developed by Dr. James W. Varni. The Physical Activity Questionnaire for Older
Children (PAQ-C) and Adolescents (PAQ-A) used in this study was developed by
Dr. Kent C. Kowalski and colleagues.
Funding support for this study was provided by the Children’s Health
Foundation, London, Ontario, Canada, and Green Shield Canada.
Author details
Department of Pediatrics, Children’s Hospital, London Health Sciences
Centre, Western University, 800 Commissioners Road East, London, ON N6A
5W9, Canada. 2Division of Pediatric Cardiology and Intensive Care Medicine,
Hannover Medical School, Carl-Neuberg Str. 1, 30625 Hannover, Germany.
3
Lawson Health Research Institute, 750 Base Line Road, Suite 300, London,
ON N6C 2R5, Canada. 4Children’s Health Research Institute, 800
Commissioners Road East, London, ON N6C 2V5, Canada. 5Rems Murr
Kliniken, Department of Pediatrics, Winnender Str. 45, 71334 Waiblingen,
Germany. 6Division of Food & Nutritional Sciences, Brescia University College,
Western University, 1285 Western Rd, London, ON N6G 1H2, Canada.
1
Received: 12 June 2014 Accepted: 17 November 2014
References
1. Roberts KC, Shields M, De Groh M, Aziz A, Gilbert JA: Overweight and
obesity in children and adolescents: results from the 2009 to 2011
Canadian Health Measures Survey. Health Rep 2011, 2012(23):37–41.
2. Ogden CL, Carroll MD, Kit BK, Flegal KM: Prevalence of obesity and trends
in body mass index among US children and adolescents, 1999–2010.
JAMA 2012, 307:483–490.
3. Abrams P, Levitt Katz LE: Metabolic effects of obesity causing disease in
childhood. Curr Opin Endocrinol Diabetes Obes 2011, 18:23–27.
4. Weiss R, Caprio S: The metabolic consequences of childhood obesity.
Best Pract Res Clin Endocrinol Metab 2005, 19:405–419.
5. Luppino FS, de Wit LM, Bouvy PF, Stijnen T, Cuijpers P, Penninx BWJH,
Zitman FG: Overweight, obesity, and depression: a systematic review
and meta-analysis of longitudinal studies. Arch Gen Psychiatry 2010,
67:220–229.
6. Griffiths LJ, Parsons TJ, Hill AJ: Self-esteem and quality of life in obese
children and adolescents: a systematic review. Int J Pediatr Obes 2010,
5:282–304.
7. Wang F, Wild TC, Kipp W, Kuhle S, Veugelers PJ: The influence of
childhood obesity on the development of self-esteem. Health Rep 2009,
20:21–27.
8. Singh AS, Mulder C, Twisk JW, Van Mechelen W, Chinapaw MJ: Tracking of
childhood overweight into adulthood: a systematic review of the
literature. Obes Rev 2008, 9:474–488.
9. Herman KM, Craig CL, Gauvin L, Katzmarzyk PT: Tracking of obesity and
physical activity from childhood to adulthood: the Physical Activity
Longitudinal Study. Int J Pediatr Obes 2009, 4:281–288.
10. Oude Luttikhuis H, Baur L, Jansen H, Shrewsbury VA, O'Malley C, Stolk RP,
Summerbell CD: Interventions for treating obesity in children.
Cochrane Database Syst Rev 2009, 1, CD001872.
11. Barlow SE, the Expert committee: Expert committee recommendations
regarding the prevention, assessment, and treatment of child and
adolescent overweight and obesity: summary report. Pediatrics 2007,
120(Suppl 4):S164–S192.
Bock et al. BMC Pediatrics 2014, 14:296
/>
12. Lau DC, Douketis JD, Morrison KM, Hramiak IM, Sharma AM, Ur E: Canadian
clinical practice guidelines on the management and prevention of
obesity in adults and children [summary]. CMAJ 2006, 2007(176):S1–13.
13. Kuczmarski RJ, Odgen C, Guo S: CDC growth charts for the United States,
Methods and development. Vital Health Stat 2000, 2002(11):1–190.
14. Bandura A: Health promotion by social cognitive means. Health Educ
Behav 2004, 31:143–164.
15. Epstein LH, Roemmich JN, Raynor HA: Behavioral therapy in the treatment
of pediatric obesity. Pediatr Clin North Am 2001, 48:981–993.
16. Health Canada: Eating well with Canada's Food Guide. In HC Pubublication,
Volume No. 4651, Catalogue No. H164-38/1-2011E-PDF. Ottawa, ON: Health
Canada; 2011.
17. Nuñez C: Application of leg-to-leg bioimpedance system in children.
[ />18. Keskin M, Kurtoglu S, Kendirci M, Atabek ME, Yazici C: Homeostasis model
assessment is more reliable than the fasting glucose/insulin ratio
and quantitative insulin sensitivity check index for assessing insulin
resistance among obese children and adolescents. Pediatrics 2005,
115:e500–e503.
19. Varni JW, Seid M, Kurtin PS: PedsQL 4.0: reliability and validity of the
Pediatric Quality of Life Inventory version 4.0 generic core scales in
healthy and patient populations. Med Care 2001, 39:800–812.
20. Kowalski KC, Crocker PR, Kowalski NP: Convergent validity of the physical
activity questionnaire for adolescents. Pediatr Exerc Sci 1997, 9:342–352.
21. Kowalski KC, Crocker PR, Faulkner RA: Validation of the physical activity
questionnaire for older children. Pediatr Exerc Sci 1997, 9:174–186.
22. Flegal KM, Ogden CL: Childhood obesity: are we all speaking the same
language? Adv Nutr 2011, 2:159S–166S.
23. Sbruzzi G, Eibel B, Barbiero SM, Petkowicz RO, Ribeiro RA, Cesa CC, Martins CC,
Marobin R, Schaan CW, Souza WB, Schaan BD, Pellanda LC: Educational
interventions in childhood obesity: a systematic review with meta-analysis
of randomized clinical trials. Prev Med 2013, 56:254–264.
24. Ho M, Garnett SP, Baur L, Burrows T, Stewart L, Neve M, Collins C:
Effectiveness of lifestyle interventions in child obesity: systematic review
with meta-analysis. Pediatrics 2012, 130:e1647–e1671.
25. Madowitz J, Knatz S, Maginot T, Crow SJ, Boutelle KN: Teasing, depression
and unhealthy weight control behaviour in obese children. Pediatr Obes
2012, 7:446–452.
26. Schwimmer JB, Burwinkle TM, Varni JW: Health-related quality of life of
severely obese children and adolescents. JAMA 2003, 289:1813–1819.
27. Ravens-Sieberer U, Redegeld M, Bullinger M: Quality of life after in-patient
rehabilitation in children with obesity. Int J Obes Relat Metab Disord 2001,
25(Suppl 1):S63–S65.
28. Barnow S, Stopsack M, Bernheim D, Schröder C, Fusch C, Lauffer H,
Freyberger HJ, Grabe HJ, Spitzer C: Results of an outpatient intervention
for obese children and adolescents. Psychother Psychosom Med Psychol
2007, 57:353–358.
29. LeBlanc AG, Janssen I: Dose–response relationship between physical
activity and dyslipidemia in youth. Can J Cardiol 2010, 26:201–205.
30. Ludwig DS, Peterson KE, Gortmaker SL: Relation between consumption of
sugar-sweetened drinks and childhood obesity: a prospective, observational
analysis. Lancet 2001, 357:505–508.
31. Nowicka P, Flodmark C-E: Family in pediatric obesity management:
a literature review. Int J Pediatr Obes 2008, 3:44–50.
32. Hampl S, Paves H, Laubscher K, Eneli I: Patient engagement and attrition
in pediatric obesity clinics and programs: results and recommendations.
Pediatrics 2011, 128(Suppl 2):S59–S64.
33. Knöpfli BH, Radtke T, Lehmann M, Schätzle B, Eisenblätter J, Gachnang A,
Wiederkehr P, Hammer J, Brooks-Wildhaber J: Effects of a multidisciplinary
inpatient intervention on body composition, aerobic fitness, and quality
of life in severely obese girls and boys. J Adolesc Health 2008, 42:119–127.
Page 9 of 9
Submit your next manuscript to BioMed Central
and take full advantage of:
• Convenient online submission
doi:10.1186/s12887-014-0296-1
Cite this article as: Bock et al.: The Health Initiative Program for Kids
(HIP Kids): effects of a 1-year multidisciplinary lifestyle intervention on
adiposity and quality of life in obese children and adolescents - a
longitudinal pilot intervention study. BMC Pediatrics 2014 14:296.
• Thorough peer review
• No space constraints or color figure charges
• Immediate publication on acceptance
• Inclusion in PubMed, CAS, Scopus and Google Scholar
• Research which is freely available for redistribution
Submit your manuscript at
www.biomedcentral.com/submit