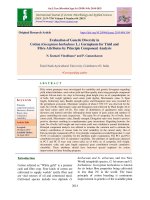
Evaluation of antioxidative responses in cotton (Gossypium hirsutum L.) genotypes imparting resistance to sucking pest attack
Bạn đang xem bản rút gọn của tài liệu. Xem và tải ngay bản đầy đủ của tài liệu tại đây (371.02 KB, 14 trang )
Int.J.Curr.Microbiol.App.Sci (2019) 8(8): 2694-2707
International Journal of Current Microbiology and Applied Sciences
ISSN: 2319-7706 Volume 8 Number 08 (2019)
Journal homepage:
Original Research Article
/>
Evaluation of Antioxidative Responses in Cotton (Gossypium hirsutum L.)
Genotypes Imparting Resistance to Sucking Pest Attack
Anju Rani, Jayanti Tokas*, Himani and H. R. Singal
Department of Biochemistry, College of Basic Sciences and Humanities, CCSHAU, Hisar 125004 (Haryana), India
*Corresponding author
ABSTRACT
Keywords
Antioxidative
enzyme, cotton,
sucking pest,
resistance, yield
Article Info
Accepted:
22 July 2019
Available Online:
10 August 2019
Present study was investigated to elucidate the role of antioxidative enzymes in
imarting resistance to sucking pest attack. Antioxidative enzymes viz. SOD, CAT,
POX, GR and APX were estimated in the leaves (2nd leaf & 6th leaf) of cotton
genotypes infected by sucking pests at 50, 60 and 68 days after sowing (DAS)
stage. The antioxidative enzyme activity before infection was maximum in 2nd &
6th leaves of G. arboreum genotypes followed by G. hirsutum resistant genotypes
and minimum in G. hirsutum susceptible genotypes. After infection, antioxidative
enzyme activity increased in all the genotypes in both the leaves. The maximum
increase in activities of enzymes viz. catalase (CAT), peroxidase (POX),
superoxide dismutase (SOD), ascorbate peroxidase (APX) and glutathione
peroxidase (GR) were observed in 6th leaves after pests infection. Maximum
increase in antioxidative enzymes was observed in HD418 of G. arboreum, H1098
of G. hirsutum (R) and H1454 genotype of G. hirsutum (S). The results suggested
that antioxidative enzymes play an important role in providing resistance to
sucking pests infection in cotton genotypes.
Introduction
Cotton is an important cash crop of India. It
belongs to the genus Gossypium and family
Malvaceae. It is grown in India in about
111.55 lakh hectares as against 92.33 lakh
hectares witnessed for the same time last year,
thereby indicating an increase of close to 21
per cent in the acreage, with annual production
of 337.25 lakh bales of 170 kg each. Crop loss
due to pest and pathogen attack is a serious
problem worldwide. The incidence of insect
pests considerably reduces both the yield and
quality of cotton production. In India sucking
pest reduces the crop yield to greater extent
(Dhawan et al., 1988). Nath et al., (2000)
reported that American cotton is more
susceptible to the attack of sucking insect
pests as well as bollworm complex than
indigenous cotton. However, interestingly, the
native cotton Gossypium arboreum and
Gossypium herbaceum appears not to be
infected with cotton leaf curl disease till the
first inception of disease (Akhtar et al., 2010,
2694
Int.J.Curr.Microbiol.App.Sci (2019) 8(8): 2694-2707
2013). Physiological, morphological, and
biochemical changes are observed in the plant
in response to sucking pest damage (Agrawal
et al., 2009). Biotic and abiotic stresses such
as drought, salinity, chilling, metal toxicity,
and UV-B radiation as well as pathogens
attack lead to enhanced generation of ROS in
plants due to disruption of cellular
homeostasis (Shah et al., 2001; Sharma and
Dubey, 2005). Whether ROS will act as
damaging or signaling molecule depends on
the delicate equilibrium between ROS
production and scavenging. Because of the
multifunctional roles of ROS, it is necessary
for the cells to control the level of ROS tightly
to avoid any oxidative injury and not to
eliminate them completely. Higher plants have
evolved a complex network of antioxidant
systems to counteract elevated ROS levels
produced in response to pest infestation. This
sophisticated machinery encompasses a wide
range of lipid and water-soluble antioxidants
(e.g., tocopherols, β-carotene, ubiquinone,
ascorbate, glutathione) and antioxidant
enzymes such as superoxide dismutase (SOD),
catalase (CAT), glutathione transferase (GST),
glutathione peroxidase (GPX), and ascorbate
peroxidase (APX) (de Carvalho et al., 2013;
Sanchez-Rodrıguez et al., 2012). Higher levels
of anti-oxidative enzymes such as SOD, CAT,
and POX along with polyphenol oxidase
(PPO) and phenylalanine ammonia lyase
(PAL) were observed in the infested cotton
plants. Detailed studies on antioxidant
enzymes are important to facilitate our
understanding of their role in insect pest
resistance. It would, therefore, be the
important aim of the cotton breeder to develop
cotton genotypes with enhanced protective
antioxidative defense system.
Materials and Methods
The present study was conducted in nine
cotton genotypes viz. HD418, HD432, HD503,
H1439, H1463, H1454, H1464, H1465 and
H1098 during kharif season at cotton field of
Department of Genetics and Plant Breeding,
CCS Haryana Agricultural University, Hisar.
Analysis of antioxidative enzymes was
performed at an interval of 50, 60 and 68 days
after sowing. Three plants were randomly
selected and 2nd & 6th leaves were taken before
and after infection of sucking pests for
estimation for biochemical constituents. The
enzymes namely superoxide dismutase,
catalase, peroxidase, ascorbate peroxidase and
glutathione reductase were assayed as per the
below mentioned methodology.
Superoxide dismutase (EC 1.15.1.1)
Superoxide dismutase was assayed by
measuring its ability to inhibit the
photochemical
reduction
of
nitroblue
tetrazolium, adopting the method of
Giannopolities and Ries (1977). The reaction
mixture (3 ml) contained 50 mM phosphate
buffer (pH 7.8), 14 mM L-methionine, 10 µM
nitroblue tetrazolium, 3 µM riboflavin, 0.1
mM EDTA and 0.1 ml of enzyme extract.
Riboflavin was added in the end. The tubes
were properly shaken and placed 30 cm below
light source consisting of two 15 Wfluorescent lamps (Phillips, India). The
absorbance was recorded at 560 nm. One
enzyme unit was defined as the amount of
enzyme which could cause 50 per cent
inhibition of the photochemical reaction.
Catalase (EC 1.11.1.6)
Catalase activity was determined by the
procedure of Sinha (1972). The reaction
mixture (1.0 ml) consisted of 0.5 ml of
phosphate buffer (pH 7.0), 0.4 ml of 0.2 M
hydrogen peroxide and 0.1 ml of properly
diluted enzyme extract. After incubating at
37C for 3 min, the reaction was terminated
by adding 3 ml mixture of 5% (w/v) potassium
dichromate and glacial acetic acid (1:3 v/v) to
the reaction mixture. The tubes were heated in
2695
Int.J.Curr.Microbiol.App.Sci (2019) 8(8): 2694-2707
boiling water bath for 10 min. Absorbance of
test and control was measured at 570 nm. One
unit of enzyme activity is defined as the
amount of enzyme which catalyzed the
oxidation of 1 µmole H2O2 per minute under
assay conditions.
Peroxidase (EC 1.11.1.7)
The enzyme activity was estimated by the
method of Shannon et al., (1966). The reaction
mixture (2.75 ml) contained 2.5 ml of 50 mM
phosphate buffer (pH 6.5), 0.1 ml of 0.5%
hydrogen peroxide, and 0.1 ml of 0.2% Odianisidine and 0.05 ml of enzyme extract.
The reaction was initiated by the addition of
0.1 ml of H2O2. The assay mixture without
H2O2 served as blank. Change in absorbance
was followed at 430 nm for 3 min. One unit of
peroxidase was defined as amount of enzyme
required to cause change in 0.1 O.D. per
minute under assay condition.
Ascorbate peroxidase (EC 1.11.1.11)
The enzyme activity was determined
following the oxidation of ascorbic acid
(Nakano and Asada, 1981). The reaction
mixture contained 2.5 ml of 100 mM
phosphate buffer (pH 7.0), 0.2 ml of 0.5 mM
ascorbate, 0.2 ml of 0.1 mM H2O2 and 0.1 ml
of enzyme extract. The reaction was initiated
by the addition of H2O2. The decrease in
absorbance at 290 nm was recorded
spectrophotometrically which corresponded to
oxidation of ascorbic acid. The enzyme
activity was calculated using the molar
extinction coefficient of 2.8 mM-1 cm-1 for
ascorbic acid. One enzyme unit was defined as
amount of enzyme required to oxidize 1 nmole
of ascorbic acid per min at 290 nm.
Glutathione reductase (EC 1.6.4.2)
Method of Halliwell and Foyer (1978) was
followed for measuring the enzyme activity.
The reaction mixture consisted of 2.7 ml of
0.1 M phosphate buffer (pH 7.5), 0.1 ml of 5
mM oxidized glutathione (GSSH), 0.1 ml of
3.5 mM NADPH and 0.1 ml enzyme extract in
final volume of 3 ml. The decrease in
absorbance at 340 nm due to oxidation of
NADPH was monitored. Non-enzymatic
oxidation of NADPH was recorded and
subtracted from it. An extinction coefficient of
6.22 mM-1 cm-1 for NADPH was used to
calculate the amount of NADPH oxidized
which corresponded to GR activity. One
enzyme unit was defined as amount of enzyme
required to oxidize 1.0 nmole of NADPH
oxidized per min.
Results and Discussion
Superoxide Dismutase (SOD)
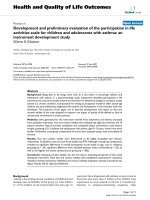
Results depicted in Fig. 1(a) and Fig. 1(b)
show the SOD activity in 2nd and 6th healthy
leaves of resistant and susceptible cotton
genotypes respectively. The activity of SOD
in 2nd leaf before infection (50 DAS) was
maximum in G. arboreum genotypes (41.1446.66 units mg-1 protein) followed by G.
hirsutum resistant genotypes (26.58-36.76
units mg-1 protein) and minimum in G.
hirsutum susceptible genotypes (18.09-20.41
units mg-1 protein). 6th leaf had maximum
activity in G. arboreum genotypes (52.2156.90 units mg-1 protein) followed by G.
hirsutum resistant genotypes (29.75-39.18
units mg-1 protein) and minimum in G.
hirsutum susceptible genotypes (20.85-23.86
units mg-1 protein). SOD activity was higher
in resistant genotypes than susceptible
genotypes. 6th leaf had more activity than 2nd
leaf in all the genotypes. All the genotypes not
differ significantly in SOD activity.
Results depicted in Fig. 1(c) show the effect of
pests infection on SOD activity in 2nd leaf of
resistant and susceptible cotton genotypes and
Fig. 1(d) shows the effect of pests infection on
2696
Int.J.Curr.Microbiol.App.Sci (2019) 8(8): 2694-2707
SOD activity in 6th leaf of resistant and
susceptible cotton genotypes. After infection
increase in SOD activity was observed in G.
hirsutum genotypes. In 2nd leaf, at 60 DAS,
increase in SOD activity was 30.56- 67.51%
in resistant genotypes and 26.34- 43.32% in
susceptible genotypes whereas at 68 DAS,
more increase in SOD activity was observed
and increase was 44.52-83.02% in resistant
genotypes and 39.06- 65.27% in susceptible
genotypes. In 6th leaf increase was 27.4453.22% in resistant genotypes and 29.0934.31% in susceptible genotypes at 60 DAS
and 68 DAS stage had 41.58- 73.16% increase
in resistant genotypes and 39.79-54.45% in
susceptible genotypes. Significant increase
was observed in all the genotypes.
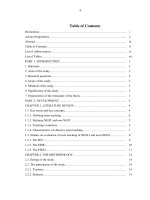
Catalase (CAT)
Fig. 2(d) shows the effect of pests infection on
CAT activity in 6th leaf of resistant and
susceptible cotton genotypes.
After infection increase in CAT activity was
observed in G. hirsutum genotypes. In 2nd leaf,
at 60 DAS, increase was 34.78-77.83% in
resistant genotypes and 2.92-16.89% in
susceptible genotypes whereas at 68 DAS,
more increase in CAT activity was observed
and increase was 78.04-155.74% in resistant
genotypes and 45.84-81.69% in susceptible
genotypes. In 6th leaf increase was 28.1039.67% in resistant genotypes and 6.0015.37% in susceptible genotypes at 60 DAS
and at 68 DAS stage increase was 46.7358.97% in resistant genotypes and 43.8757.86% in susceptible genotypes. Significant
increase was observed in all the genotypes.
Results depicted in Fig. 2(a) and Fig. 2(b)
show the CAT activity in 2nd and 6th healthy
leaves of resistant and susceptible cotton
genotypes respectively. The activity of
catalase followed similar trend as SOD
activity in both 2nd and 6th leaves before
infection. Maximum activity of CAT in 2nd
leaf was in G. arboreum genotypes (366.65422.98 units mg-1 protein) followed by G.
hirsutum resistant genotypes (267.65-366.77
units mg-1 protein) and minimum in G.
hirsutum susceptible genotypes (226.13275.29 units mg-1 protein). In 6th leaf, G.
arboreum genotypes had maximum activity
(505.43-535.11 units mg-1 protein) followed
by G. hirsutum resistant genotypes (424.99456.69 units mg-1 protein) and minimum in G.
hirsutum susceptible genotypes (258.82278.60 units mg-1 protein). 6th leaf had more
activity than 2nd leaf in all the genotypes. All
the genotypes differ significantly in CAT
activity.
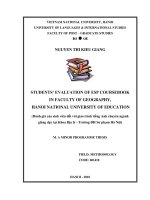
Peroxidase (POX)
Results depicted in Fig. 2(c) show the effect of
pests infection on CAT activity in 2nd leaf of
resistant and susceptible cotton genotypes and
Results depicted in Fig. 3(c) show the effect of
pests infection on POX activity in 2nd leaf of
resistant and susceptible cotton genotypes and
Results depicted in Fig. 3(a) and Fig. 3(b)
show the POX activity in 2nd and 6th healthy
leaves of resistant and susceptible cotton
genotypes respectively. In 2nd leaf POX
activity was maximum in G. arboreum
genotypes (44.91-47.16 units mg-1 protein)
followed by G. hirsutum resistant genotypes
(23.34-26.46 units mg-1 protein) and minimum
in G. hirsutum susceptible genotypes (12.1316.96). In 6th leaf, G. arboreum genotypes had
maximum activity (51.82-54.43 units mg-1
protein) followed by G. hirsutum resistant
genotypes (22.19-28.31 units mg-1 protein)
and minimum in G. hirsutum susceptible
genotypes (14.15-17.81 units mg-1 protein).
POX activity was higher in resistant genotypes
than susceptible genotypes. 6th leaf had more
activity than 2nd leaf in all the genotypes. All
the genotypes not differ significantly in POX
activity.
2697
Int.J.Curr.Microbiol.App.Sci (2019) 8(8): 2694-2707
Fig. 3(d) shows the effect of pests infection on
POX activity in 6th leaf of resistant and
susceptible cotton genotypes. After infection
increase in POX activity was observed in G.
hirsutum genotypes. In 2nd leaf, at 60 DAS,
increase in POX activity was 55.79-139.59%
in resistant genotypes and 26.11-43.59% in
susceptible genotypes whereas at 68 DAS
stage more increase in POX activity was
observed and increase was 130.85-140.13% in
resistant genotypes and 44.85-74.71% in
susceptible genotypes in 2nd leaf.
In 6th leaf increase was 52-58.82% in resistant
genotypes and 19.83-24.60% in susceptible
genotypes at 60 DAS and at 68 DAS stage,
increase was 156.71-167.54% in resistant
genotypes and 55.01-84.64% in susceptible
genotypes. Significant increase was observed
in all the genotypes.
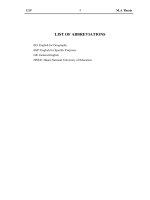
Ascorbate Peroxidase (APX)
Results depicted in Fig. 4(a) and Fig. 4(b)
show the APX activity in 2nd and 6th healthy
leaves of cotton genotypes respectively. In 2nd
leaf, APX activity was maximum in G.
arboreum genotypes (318.60-327.68 units mg1
protein) followed by G. hirsutum resistant
genotypes (201.42-223.60 units mg-1 protein)
and minimum in G. hirsutum susceptible
genotypes (134.82-147.74 units mg-1 protein).
6th leaf had maximum activity in G. arboreum
genotypes (377.62-401.42 units mg-1 protein)
followed by G. hirsutum resistant genotypes
(231.52-275.46 units mg-1 protein) and
minimum in G. hirsutum susceptible
genotypes (175.28-215.28 units mg-1 protein).
APX activity was higher in resistant genotypes
than susceptible genotypes. 6th leaf had more
activity than 2nd leaf in all the genotypes. All
the genotypes not differ significantly in APX
activity. Results depicted in Fig. 4(c) show the
effect of pests infection on APX activity in 2nd
leaf of resistant and susceptible cotton
genotypes and Fig. 4(d) shows the effect of
pests infection on APX activity in 6th leaf of
resistant and susceptible cotton genotypes. No
visible symptoms of infection were observed
in G. arboreum genotypes. After infection,
increase in APX activity was observed G.
hirsutum genotypes. In 2nd leaf, after pests
infection at 60 DAS, increase in APX activity
was 27.12-45.01% in resistant genotypes and
23.50-38.49% in susceptible genotypes
whereas at 68 DAS stage more increase in
APX activity was observed and increase was
104.77-134.60% in resistant genotypes and
84.09-95.34% in susceptible genotypes. In 6th
leaf increase was 73.67-109.31% in resistant
genotypes and 32.41-63.48% in susceptible
genotypes at 60 DAS and at 68 DAS, increase
in APX activity was 106.65-136.43% in
resistant genotypes and 96.06-115.05% in
susceptible genotypes. Significant increase in
APX activity was observed in 2nd leaf at 68
DAS, in 6th leaf at 60 DAS & 68 DAS stages
wheras non-significant increase in APX
activity was observed in 2nd leaf at 68 DAS.
Glutathione Reductase (GR)
Results depicted in Fig. 5(a) and Fig. 5(b)
show the GR activity in 2nd and 6th healthy
leaves of resistant and susceptible cotton
genotypes respectively. In 2nd leaf GR activity
was maximum in G. arboreum genotypes
(204.34-214.35 units mg-1 protein) followed
by G. hirsutum resistant genotypes (104.56141.67 units mg-1 protein) and minimum in G.
hirsutum susceptible genotypes (68.67-83.04
units mg-1 protein). In 6th leaf, G. arboreum
genotypes had maximum activity (222.35230.41 units mg-1 protein) followed by G.
hirsutum resistant genotypes (133.68-146.39
units mg-1 protein) and minimum in G.
hirsutum susceptible genotypes (86.73-88.77
units mg-1 protein). GR activity was higher in
resistant
genotypes
than
susceptible
th
genotypes. 6 leaf had more activity than 2nd
leaf in all the genotypes. All the genotypes not
differ significantly in GR activity.
2698
Int.J.Curr.Microbiol.App.Sci (2019) 8(8): 2694-2707
(a)
(b)
Fig. 1: Superoxide dismutase (units mg-1 protein) in (a) 2nd and (b) 6th healthy leaves of
resistant and susceptible cotton genotypes
In G. arboreum
1=HD 418
In G. hirsutum (R)
1=H1464
In G. hirsutum (S)
1=H1463
CD at 5%: (a) Genotypes=3.39
2=HD503
2=H1465
2=H1454
3=HD432
3=H1098
3=H1439
(b) Genotypes=0.50
(c)
(d)
Fig. 1: Effect of pests infection on Superoxide dismutase (units mg-1 protein) in (c) 2nd
and (d) 6th leaves of resistant and susceptible cotton genotypes
2H= 2nd healthy leaf
leaf
(c) H, I (60DAS)
(68DAS)
2I=2nd Infected leaf 6H=6th Healthy leaf 6I=6th
H, I (68DAS)
(d) H, I (60DAS)
Infected
H,
Genotypes=0.75
Genotypes=0.61
Genotypes=0.33
Genotypes=0.31
Treatment=0.43
Treatment=0.35
Treatment=0.19
Treatment=0.18
Genotypes × Treatment=1.06 Genotypes × Treatment=0.86 Genotypes × Treatment= 0.46 Genotypes × Treatment=0.44
2699
I
Int.J.Curr.Microbiol.App.Sci (2019) 8(8): 2694-2707
(a)
(b)
Fig. 2: Catalase activity (units mg-1 protein) in (a) 2nd and (b) 6th healthy leaves of
resistant and susceptible cotton genotypes
In G. arboreum
1=HD 418
In G. hirsutum (R)
1=H1464
In G. hirsutum (S)
1=H1463
CD at 5%: (a) Genotypes=1.25
(c)
2=HD503
2=H1465
2=H1454
3=HD432
3=H1098
3=H1439
(b) Genotypes=1.05
(d)
Fig. 2: Effect of pests infection on Catalase activity (units mg-1 protein) in (c) 2nd and (d)
6th leaves of resistant and susceptible cotton genotypes
2H= 2nd healthy leaf
6I=6th Infected leaf
(c) H, I (60DAS)
(68DAS)
Genotypes=1.02
Treatment=0.59
2I=2nd Infected leaf
H, I (68DAS)
Genotypes=0.71
Treatment=0.41
6H=6th Healthy leaf
(d) H, I (60DAS)
Genotypes=0.66
Treatment=0.38
H,
Genotypes=3.73
Treatment=2.15
Genotypes × Treatment=1.44 Genotypes × Treatment=1.01 Genotypes × Treatment=0.94 Genotypes × Treatment=5.28
2700
I
Int.J.Curr.Microbiol.App.Sci (2019) 8(8): 2694-2707
(a)
(b)
Fig. 3: Peroxidase activity (units mg-1 protein) in (a) 2nd and (b) 6th healthy leaves of
resistant and susceptible cotton genotypes
In G. arboreum
1=HD 418
In G. hirsutum(R)
1=H1464
In G. hirsutum(S)
1=H1463
CD at 5%: (a) Genotypes=4.46
(c)
2=HD503
2=H1465
2=H1454
3=HD432
3=H1098
3=H1439
(b) Genotypes=3.25
(d)
Fig. 3: Effect of pests infection on Peroxidase activity (units mg-1 protein) in (c) 2nd and
(d) 6th leaves of resistant and susceptible cotton genotypes
2H= 2nd healthy leaf
6I=6th Infected leaf
(c) H, I (60DAS)
(68DAS)
2I=2nd Infected leaf
H, I (68DAS)
6H=6th Healthy leaf
(d) H, I (60DAS)
H,
Genotypes=2.72
Genotypes=3.04
Genotypes=2.09
Genotypes=1.96
Treatment=1.57
Treatment=1.76
Treatment=1.21
Treatment=1.13
Genotypes × Treatment=3.84 Genotypes × Treatment=4.30 Genotypes × Treatment=2.96 Genotypes × Treatment=2.7
2701
I
Int.J.Curr.Microbiol.App.Sci (2019) 8(8): 2694-2707
(a)
(b)
Fig. 4: Ascorbate peroxidase activity (units mg-1 protein) in (a) 2nd and (b) 6th healthy
leaves of resistant and susceptible cotton genotypes
In G. arboreum
1=HD 418
In G. hirsutum(R)
1=H1464
In G. hirsutum(S)
1=H1463
CD at 5%: (a) Genotypes= 15.82
(c)
2=HD503
2=H1465
2=H1454
3=HD432
3=H1098
3=H1439
(b) Genotypes=11.91
(d)
Fig. 4: Effect of pests infection on Ascorbate peroxidase activity (units mg-1 protein) in
(c) 2nd and (d) 6th leaves of resistant and susceptible cotton genotypes
2H= 2nd healthy leaf
2I=2nd Infected leaf
6H=6th Healthy leaf
6I=6th Infected leaf
(c) H, I (60DAS)
H, I (68DAS)
(d) H, I (60DAS)
H, I (68DAS)
Genotypes=22.9
Genotypes=26.69
Genotypes=30.77
Genotypes=22.93
Treatment=13.25
Treatment=15.41
Treatment=17.77
Treatment=13.24
Genotypes × Treatment= N/AGenotypes × Treatment= 37.76
Genotypes × Treatment=43.52 Genotypes
Treatment=32.43
2702
×
Int.J.Curr.Microbiol.App.Sci (2019) 8(8): 2694-2707
(a)
(b)
Fig. 5: Glutathione reducatse activity (units mg-1 protein) in (a) 2nd and (b) 6th healthy
leaves of resistant and susceptible cotton genotypes
In G. arboreum
1=HD 418
2=HD503
3=HD432
In G. hirsutum (R)
1=H1464
2=H1465
3=H1098
In G. hirsutum (S)
1=H1463
2=H1454
3=H1439
CD at 5%: (a) Genotypes=11.03
(b) Genotypes=10.49
(c)
(d)
Fig. 5: Effect of pests infection on Glutathione reducatse activity (units mg-1 protein) in
(c) 2nd and (d) 6th leaves of resistant and susceptible cotton genotypes
2H= 2nd Healthy leaf
(c) H, I (60DAS)
Genotypes=7.42
Treatment=4.28
2I=2nd Infected leaf
6H=6th Healthy leaf
6I=6th Infected leaf
H, I (68DAS)
(d) H, I (60DAS)
H, I (68DAS)
Genotypes=14.90
Genotypes=4.96
Genotypes=3.75
Treatment=8.60
Treatment=2.87
Treatment=2.17
Genotypes × Treatment=10.49 Genotypes × Treatment=21.07 Genotypes × Treatment=7.02 Genotypes × Treatment=5.31
2703
Int.J.Curr.Microbiol.App.Sci (2019) 8(8): 2694-2707
Results depicted in Fig. 5(c) show the effect
of pests infection on GR activity in 2nd leaf of
resistant and susceptible cotton genotypes and
Fig. 5(d) shows the effect of pests infection
on GR activity in 6th leaf of resistant and
susceptible cotton genotypes. No visible
symptoms of infection were observed in G.
arboreum genotypes. After infection increase
in GR activity was observed in G. hirsutum
genotypes. In 2nd leaf, at 60 DAS, increase in
GR activity was 24.47-61.84% in resistant
genotypes and 10.05-20.41% in susceptible
genotypes whereas at 68 DAS stage, more
increase in GR activity was observed and
increase was 68.11-146.10% in resistant
genotypes and 77.50-68.32% in susceptible
genotypes. In 6th leaf increase was 21.5730.18.00% in resistant genotypes and 13.4922.39% in susceptible genotypes at 60 DAS
and at 68 DAS stage increase was 93.72111.03% in resistant genotypes and 84.3595.82% in susceptible genotypes. Significant
increase was observed in all the genotypes.
The activity increased in all the genotypes but
the increase was more in resistant genotypes
as compared to susceptible genotypes and all
the genotypes differ significantly in GR
activity.
Among the enzymes involved in antioxidative
defense system, superoxide dismutase (SOD)
is the first enzyme in ROS detoxifying
process. It converts.O2- to H2O2 and H2O2 so
produced is scavenged to O2 and water by the
enzymes such as APX, POX and CAT. In
present study, SOD activity increased on pests
infection and increase was more in resistant
genotypes than susceptible genotypes and in
all genotypes 6th leaf showed enhanced
activity than 2nd leaf (fig. 1c & 1d). Similarly
results were obtained in cotton plants infested
by S. litura showed induced SOD activity
(Usha Rani and Pratyusha, 2013). Similar
increase was also observed in the castor and
lima bean plants infested by herbivory
(Maffei et al., 2006). The SOD activity was
also shown to increase in strawberry leaves
infected by Mycosphaerella fragariae but the
SOD activity for the resistant cultivars was
higher than for the susceptible ones (EhsaniMoghaddam et al., 2006).
Catalase (CAT) activity increased in both 2nd
& 6th leaves after pests infection in both
resistant and susceptible genotypes (fig. 2a &
2b). Enhanced CAT activity was observed in
resistant
genotypes
than
susceptible
genotypes at both 60 DAS and 68 DAS stage
in both 2nd & 6th leaves on pests infection (fig.
2c & 2d). Similarly, a 23 fold increase in
CAT activity was observed in maize plants
inoculated with P. indica as compared to noninoculated plants (Kumar et al., 2009).
Maximum increase in CAT activity after
cotton leaf curl burewala virus inoculation
was in resistant genotypes as followed by
susceptible genotypes as compared to their
non-inoculated plants (Siddique et al., 2014).
Similar increases in foliar CAT activity were
also observed in Algerian-susceptible but not
in Algerian-Resistant barley (Hordeum
vulgare L.) leaves inoculated with Blumeria
graminis (Vanacker et al., 1998). Cotton
plants infested by S. litura showed induced
the CAT activity (Usha Rani and Pratyusha,
2013).
Peroxidases (POX) are a group of enzymes
that detoxify H2O2 by utilizing an electron
donating substrate for the oxidation of H2O2
(Dionisio-sese and Tobita, 1998). POX
activity increased in 2nd and 6th leaves of all
the cotton genotypes on pests infection and
the increase was higher in resistant genotypes
as compared to susceptible genotypes (fig 3c
& 3d). Similar to our results, many scientists
have reported higher peroxidase activity in
resistant cultivars of various crops infected
with different types of pathogens. Cotton
plants infested by S. litura induced the CAT
activity (Usha Rani and Pratyusha, 2013).
2704
Int.J.Curr.Microbiol.App.Sci (2019) 8(8): 2694-2707
Infection with plant pathogens led to an
induction in POX activity in plant tissues and
a greater increase was recorded in resistant
plants compared to the susceptible ones
(Mydlarz and Harvell, 2006). Similar increase
in POX activity has been reported in tomato
and bell pepper infected with tobacco mosaic
virus and tomato mosaic tobamovirus
(Madhusudhan et al., 2009); cucumber
mosaic virus and zucchini yellow mosaic
virus-infected Cucumis sativus and Cucurbita
pepo plants (Bauer, 2000); tobacco mosaic
virus infected tobacco plants (Kiraly et al.,
2002); tomato yellow leaf curl virus infected
tomato plants (Dieng et al., 2011) and a
number of resistant interactions involving
several plant patho systems.
Ascorbate peroxidase, a hydrogen peroxide
scavenging enzyme is a major enzyme
responsible for elimination of hydrogen
peroxide. The results of present study showed
that APX activity was substantially higher in
resistant genotypes as compared to
susceptible genotypes in healthy leaves (fig.
4a & 4b).
The APX activity increased in all genotypes
infected by pests and increase was higher in
resistant genotypes at both 60 DAS and 68
DAS stages (fig. 4c & 4d). Similar
observations have been reported for APX
activity in soybean and cotton foliage after
herbivory attack by H. zea (Bi and Felton,
1995; Bi et al., 1997). Lukasik et al., (2012)
observed more induction in APX activity in
less susceptible cultivars than more
susceptible cultivars in triticale after 24 hrs of
cereal aphid infestation and there prolonged
feeding (after 48 and 72 hrs) caused the
strongest induction of APX. Similarly, a rapid
increase was observed in more resistant
cultivar of chrysanthemum infested by
Macrosiphoniella
sanbourni
(Gillete)
indicated that the enzyme is involved in early
responses to aphid attack (He et al., 2011).
Glutathione reductase (GR) is another specific
and important enzyme of ascorbateglutathione cycle and plays a crucial role in
affording protection against oxidative damage
in many plants (Foyer et al., 1991) by
maintaining endogenous pool of reduced
glutathione (GSH). Our results showed that
GR activity increased in both 2nd and 6th
leaves of both resistant and susceptible cotton
genotypes on pests infection and increase was
more pronounced in resistant genotypes than
susceptible genotypes (fig. 5c & 5d).
Similarly, Hernández et al., (2001) found that
the GR activity in the resistant plants was
higher than in the susceptible plants of apricot
after inoculation with the Plum pox virus.
Debona et al., (2012) observed that wheat
varieties inoculated with Pyricularia oryzae
for 96 hr at vegetative stage showed increase
in GR activity in partially resistant plants
(BRS 229) and no significant change in
susceptible (BR 18) plants.
To summarize results presented here show
that leaves of resistant genotypes had less
production of ROS, higher level of ascorbic
acid and higher activities of POX, APX,
CAT, SOD and GR as compared to
susceptible genotypes of cotton. Suggesting
that these components of antioxidative
defence system play important role in
providing pest resistance in cotton genotypes
studied here.
The maximum increase in activities of
enzymes viz. CAT, POX, SOD, APX and GR
were observed in 6th leaves after pests
infection. Maximum increase in antioxidative
enzymes was observed in HD418 of G.
arboreum, H1098 of G. hirsutum (R) and
H1454 genotype of G. hirsutum (S). The
results indicated that biochemical parameters
studied in the present investigation play
important role in providing resistance to
sucking pests infection in cotton genotypes
studied in the present investigation.
2705
Int.J.Curr.Microbiol.App.Sci (2019) 8(8): 2694-2707
Acknowledgments
The authors thank Chaudhary Charan Singh
Haryana Agricultural University, Hisar,
Haryana and Indian Council of Agricultural
Research, New Delhi for providing the
necessary funding and facilities for carrying
out this research.
References
Agrawal, A.A., Fishbein, M., Jetter, R., Salminen,
J.P., Goldstein, J.B., Freitag, A.E. and
Sparks, J.P. 2009. Phylogenetic ecology of
leaf surface traits in the milkweeds
(Asclepias spp.): chemistry, ecophysiology,
and insect behavior. New Phytol. 183(3):
849-67.
Akhtar, K.P., Haidar, S., Khan, M.K.R., Ahmad,
M., Sarwar, N., Murtaza, M.A. and Aslam,
M. 2010. Evaluation of Gossypium species
for resistance to cotton leaf curl Burewala
virus. Annual Appl. Biol. 157:135-147.
Akhtar, K.P., Ullah, R., Khan, I.A., Saeed, M.,
Sarwar, N. and Mansoor, S. 2013. First
symptomatic evidence of infection of
Gossypium arboreum with cotton leaf curl
Burewala virus through grafting. Intrn. J.
Agric. Biol. 15:157-160.
Bauer, R. 2000. Role of reactive oxygen species
and antioxidant enzymes in systemic virus
infection of plants. J. Phytopathol. 148:
297-302.
Bi, J.L. and Felton, G.W. 1995. Foliar oxidative
stress and insect herbivory: Primary
compounds, secondary metabolites, and
reactive oxygen species as components of
induced resistance. J. Chem. Ecol. 21:
1511-1530.
Bi, J.L., Murphy, J.B. and Felton, G.W. 1997.
Does salicylic acid act as a signal in cotton
for induced resistance to Helicoverpa zea.
J. Chem. Ecol. 23: 1805-1818.
De Carvalho, K., de Campos, M.K., Domingues,
D.S., Pereira, L.F. and Vieira, L.G. 2013.
The accumulation of endogenous proline
induces changes in gene expression of
several antioxidant enzymes in leaves of
transgenic Swingle citrumelo. Mol Biol
Report. 40: 3269–3279.
Debona, D., Rodrigues, F.Á., Rios, J.A. and
Nascimento, K.J.T. 2012. Biochemical
changes in the leaves of wheat plants
infected
by
Pyricularia
oryzae.
Phytopathology 102:1121-1129.
Dhawan, A.K., Sidhu, A.S. and Simwat, G.S.
1988. Assessment of avoidable loss in
cotton
(Gossypium
hirusutum
and
Gossypium arboreum) due to sucking pest
and bollworms. Ind. J. Agri. Sci. 58(4):
290-292.
Dieng, H., Satho, T., Hassan, A.A., Aziz, A.T.,
Morales, R.E., Hamid, S.A., Miake, F. and
Abubakar, S. 2011. Peroxidase activity
after viral infection and whitefly infectation
in juvenile and mature leaves of Solanum
lycopersicum. J. Phytopathol. 159: 707712.
Dionisio-Sese, M.L. and Tobita, S. 1998.
Antioxidant response of rice seedling to
salinity stress. Plant Sci. 135: 1-9.
Ehsani-Moghaddam, B., Charles, M. T., Carisse,
O., and Khanizadeh, S. 2006. Superoxide
dismutase responses of strawberry cultivars
to infection by Mycosphaerella fragariae.
J. Plant Physiol. 163:147-153.
Foyer, C.H.M., Lelandais, C.G. and Kunert,
K.J. 1991. Effect of elevated cytosolic
glutathione reductase activity on the
cellular
glutathione
pool
and
photosynthesis in leaves under normal
and stress conditions. Plant Physiol. 97:
863-872.
Giannopolities, C. N. and Ries, S. K. 1977.
Superoxide dismutase. I. Occurrence in
higher plants. Plant Physiol. 59: 315-318.
Halliwell, B. and Gutteridge, J.M.C. 1989.
Protection against oxidants in biological
systems: The superoxide theory of oxygen
toxicity. In: Free Radicals in Biology and
Medicine. (Halliwell, B. and Gutteridge,
J.M.C.) (Eds.) Oxford, Clarendon. pp. 86–
123.
He, J., Chen, F., Chen, S., Lv, G., Deng, Y., Fang,
W., Liu, Z., Guan, Z. and He, C. 2011.
Chrysanthemum leaf epidermal surface
morphology and antioxidant and defense
enzyme activity in response to aphid
infestation. J. Plant Physiol. 168:687–93.
Hernández, J.A., Talavera, J.M., MartínezGómez, P., Dicenta, F., and Sevilla, F.
2706
Int.J.Curr.Microbiol.App.Sci (2019) 8(8): 2694-2707
2001. Response of antioxidative enzymes to
plum pox virus in two apricot cultivars.
Physiol. Plant. 111:313-321.
Kumar, M., Yadav, V., Tuteja, N. and Johri, A.K.
2009. Antioxidant enzyme activities in
maize plants colonized with Piriformospora
indica. Microbiology 155: 780–790.
Lukasik, I., Golawaska, S. and Wojcicka, A.
2012. Effect of cereal aphid infestation on
Ascobate and Ascorbate Peroxidase activity
in Triticales. Pol. J. Eniviron. Stud. 21:
1937-1941.
Madhusudhan, K.N., Srikanta, B.M., Shylaja,
M.D., Prakash, H.S. and Shetty, H.S. 2009.
Changes in antioxidant enzymes, hydrogen
peroxide, salicylic acid and oxidative stress
in compatible and incompatible host
tobamovirus interaction. J Plant Interact.
4:157–166.
Maffei, M.E., Mithofer, A., Arimura, G.I.,
Uchtenhagen, H., Bossi, S., Bertera, C.M.,
Cucuzaa, L.S., Novero, M., Volpe, V.,
Quadro, S. and Boland, W. 2006. Effect of
feeding of Spodoptera littoralis on Lima
bean leaves. Ш. Membrane depolarization
and involvement of hydrogen peroxide.
Plant Physiol. 140:1022-1035.
Mydlarz, L.D. and Harvell, C.D. 2006. Peroxidase
activity and inducibility in the see fan coral
exposed to a fungal pathogen. Comp
Biochem Physiol. 10:1016.
Nakano, Y. and Asada, K. 1981. Hydrogen
peroxide is scavenged by ascorbate specific
peroxidase in spinach chloroplasts. Plant
Cell Physiol. 22: 867-880.
Nath, P., Chaudhary, O.P., Sharma, P.D. and
Kaushik, H.D. 2000. The studies on the
incidence of important insect pests of
cotton with special reference to Gossypium
arborium (Desi) cotton. Indian J. Entomol.
62: 391–395.
Sanchez-Rodrıguez, E., Rubio-Wilhelmi Mdel,
M., Blasco, B., Leyva, R. and Romero, L.
2012. Antioxidant response resides in the
shoot in reciprocal grafts of droughttolerant and drought-sensitive cultivars in
tomato under water stress. Plant Sci 188–
189: 89–96.
Shah, K., Kumar, R.G., Verma, S. and Dubey,
R.S. 2001. Effect of cadmium on lipid
peroxidation, superoxide anion generation
and activities of antioxidant enzymes in
growing rice seedlings. Plant Sci. 161(6):
1135–1144.
Shannon, L. M., Key, E. and Law, J. Y. 1966.
Peroxidase isoenzyme from horse radish
roots: Isolation and physical properties. J.
Biol. Chem. 241: 2166-2172.
Sharma, P. and Dubey, R.S. 2005. Drought
induces oxidative stress and enhances the
activities of antioxidant enzymes in
growing rice seedlings. Plant Growth Reg.
46(3): 209–221.
Siddique, Z., Akhtar, K.P., Hameed, A., Sarwar,
N., Ul-Haq, I. And Khan, S.A. 2014.
Biochemical alterations in leaves of
resistant and susceptible cotton genotypes
infected systemically by cotton leaf curl
burewala virus. J.Pl.Int. 9(1): 702-711.
Sinha, A. K. 1972. Calorimetric assay of catalase.
Anal. Biochem. 47: 389-395.
Usha Rani, P. and Pratyusha, S. 2013. Defensive
role of Gossypium hirsutum L: Antioxidative enzymes and phenolic acids in
response to Spodoptera litura F. feeding. J.
Asia-Pacific Entomol. 16: 131–136.
Vanacker, H., Carver, T.L.W. and Foyer, C.H.
1998. Pathogen-induced changes in the
antioxidant status of the apoplast in barley
leaves. Plant Physiol. 117:1103–1114.
How to cite this article:
Anju Rani, Jayanti Tokas, Himani and Singal H. R. 2019. Evaluation of Antioxidative
Responses in Cotton (Gossypium hirsutum L.) Genotypes Imparting Resistance to Sucking Pest
Attack. Int.J.Curr.Microbiol.App.Sci. 8(08): 2694-2707.
doi: />
2707