Testing the sensitivity of canegro model for variability in temperature and Co2 concentration in Tarai region of Uttarakhand, India
Bạn đang xem bản rút gọn của tài liệu. Xem và tải ngay bản đầy đủ của tài liệu tại đây (187.17 KB, 5 trang )
Int.J.Curr.Microbiol.App.Sci (2019) 8(8): 2951-2955
International Journal of Current Microbiology and Applied Sciences
ISSN: 2319-7706 Volume 8 Number 08 (2019)
Journal homepage:
Original Research Article
/>
Testing the Sensitivity of Canegro Model for Variability in Temperature
and Co2 Concentration in Tarai Region of Uttarakhand, India
Neha Sharma*, Pawan Mall and A.S. Nain
Department of Agricultural Meteorology, G.B. Pant University of Agriculture and
Technology, Pantnagar-263145, India
*Corresponding author
ABSTRACT
Keywords
CANEGRO, Model
sensitivity, Dry
weight yield
Article Info
Accepted:
22 July 2019
Available Online:
10 August 2019
The present study was conducted at the Norman E. Borlaug Crop Research Centre of G.B.
Pant University of Agriculture and Technology, Pantnagar to study the impact of
increasing temperature and Carbon dioxide concentration on the dry weight yield of
sugarcane crop during the crop growing season of 2015 and 2016. The performance of the
CANEGRO model was found to be satisfactory for all the crop characteristics during the
crop growing season. The variety of sugarcane that was selected for the study was Co-Pant
5224. The model sensitivity was analyzed for parameters like maximum and minimum
temperatures (°C) and Carbon dioxide concentrations (ppm). The temperature variations
were applied from ±1 °C to ±3 °C and the CO2 concentration was raised from ±50 to ±150
ppm. The sugarcane dry weight yield increased from 8277 kg/ha to 9561 kg/ha and
decreased from 7057 kg/ha to 5954 kg/ha on increasing the temperature in 2015. While in
the year 2016, the dry weight yield increased from 7759 kg/ha to 8499 kg/ha on decreasing
the temperature while it decreased from 6938 kg/ha to 5372 kg/ha on increasing the
temperature. The dry cane yield increased from 7834 kg/ha to 7986 kg/ha on raising the
CO2 concentration from 50 ppm to 150 ppm while it decreased from 7510 kg/ha to 6318
kg/ha on decreasing the CO2 concentration in 2015. Similar was the trend found in the year
2016. The model was found to be sensitive to the effect of temperature either decreasing or
increasing it than mean temperature and CO2 concentration.
Introduction
India has the largest area under sugarcane
cultivation in the world and it is the world’s
second largest producer of sugarcane next
only to Brazil. Sugarcane accounts for the
largest value of production and holds an
enviable position among all the commercial
crops in India. The crop encounters several
changes in the yield and vegetative growth
due to any change in the temperature than the
optimum range. At higher temperatures
reversion of sucrose into fructose and glucose
may occur besides enhancement of
photorespiration thus leading to less
accumulation of sugars. Severe cold weather
inhibits bud sprouting in ratoon crop and
arrests cane growth. Temperatures lower than
2951
Int.J.Curr.Microbiol.App.Sci (2019) 8(8): 2951-2955
0°C induces freezing of less protected parts
such as young leaves and lateral buds. The
two years ratoon was planted, keeping the CoPant 5224 sugarcane variety. CANEGRO, a
crop simulation model, simulates sugarcane
growth using weather and water inputs
(Singels et al., 2008). Based on process-based
models of sugarcane growth and development
including phenology, canopy development,
tillering,
biomass
accumulation
and
partitioning, root growth, water stress, and
lodging are also simulated. CANEGRO
model was used for simulating the growth and
yield of sugarcane during the crop growth
period of 2015 and 2016. The model
performance was found to be good for
simulating the crop characteristics like LAI,
Dry cane yield, biomass etc. The model was
later tested for its sensitivity for parameters
like maximum and minimum temperatures
and CO2 concentration.
Materials and Methods
A field experiment was conducted on
“Testing the sensitivity of CANEGRO model
for variability in temperature and CO2
concentration in tarai region of Uttarakhand”
was conducted during 2015 and 2016. The
field experiments were conducted at the
Norman E. Borlaug Crop Research Centre of
Govind Ballabh Pant University of
Agriculture and Technology, Pantnagar, U.S
Nagar (Uttarakhand). Pantnagar is situated in
the Tarai belt, at latitude of 29.2°N, 79.49°E
longitude and at an altitude of 243.80 m
above the mean sea level.
The variety of Sugarcane selected for the
experiment was Co-Pant 5224. The model
performance was also evaluated over
parameters like Leaf Area Index and fresh
cane yield (kg/ha). The statistical parameters
like index of agreement (d), RMSE (%) and
coefficient of determination (R2) were
computed to test how good the model
performed in
characteristics.
simulating
different
crop
Sensitivity analysis is used to determine how
“sensitive” a model is to the changes in the
values of the parameters used in the model
and to changes in the structure of the model.
Sensitivity analysis helps to build confidence
in the model by studying the uncertainties that
are often associated with parameters. Many
parameters in the system dynamics of the
model represent quantities that are very
difficult or even impossible to measure to a
great deal of accuracy in the real world.
Sensitivity analysis allows determination of
level of accuracy for a parameter to make the
model sufficiently useful and valid. If the
tests reveal that the model is insensitive, then
it may be possible to use an estimate rather
than a value with greater precision. Sensitivity
analysis can also indicate, which parameter
values are reasonable to use in the model. If
the model behaves as expected from the real
world observations, it gives indications that
the parameter values reflect, at least in part,
the “real world” (Breierova and Choudhari,
1996).
In this study, the CANEGRO model was
applied to a growing period of 2015 and 2016
in order to determine the model sensitivity on
the changes in several meteorological
parameters such as minimum temperature
(°C), maximum temperature (°C) and CO2
concentration In the model, the temperature
variations were applied from ±1 °C to ±3 °C
and CO2 concentration changes were made
from ±50 to ±150 ppm.
Experimental results
In this study, the CANEGRO-sugarcane
model was applied to two consequent
growing seasons (2015-16 and 2016-17) in
order to determine the model sensitivity on
the changes in several factors such as
2952
Int.J.Curr.Microbiol.App.Sci (2019) 8(8): 2951-2955
maximum temperature (°C), minimum
temperature (°C) and CO2 emission
concentration (ppm). In the model,
temperature variations were applied from ±1
to ±3°C and CO2 concentration from ±50,
±100 and ±150 ppm.
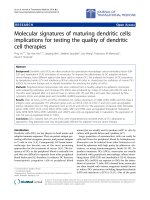
Effect of change in mean temperature (°C)
on Sugarcane Dry weight yield (kg/ha)
The effect of mean temperature and CO2
concentration have been presented in Figure 1
and figure 2 respectively.
Sugarcane dry weight yield showed a gradual
decrease while the temperature was increased
from 1 to 3°C. The sugarcane dry weight
yield increased from 7691 kg/ha to 8277
kg/ha, 8887 kg/ha and 9561 kg/ha on testing
the temperature sensitivity on the model from
+1 to +3°C respectively in the year 2015. The
dry weight yield dropped down to 7057 kg/ha,
6499 kg/ha and 5954 kg/ha when the
temperature was dropped by 1, 2 and 3 °C
respectively in the year 2016.
Sugarcane dry weight yield showed the
similar trend when the temperature variations
were applied from ±1 to ±3 °C. The yield
varied from 7759 kg/ha, 8304 kg/ha to a
maximum of 8455 kg/ha respectively on
decreasing the temperature from +1 to +3 °C.
While it deduced from 6938 kg/ha, 6103
kg/ha to a minimum of 5372 kg/ha when the
temperature was dropped from -1 to -3°C
respectively. The figure 1 clearly depicts the
trend of dry weight sugarcane yield as
impacted by temperature variations. The
similar results were also reported by Samui et
al., (2003) in his findings that Higher
maximum temperature was found detrimental
causing reduction in yield. He carried out a
study over eastern and western part of U.P.
and found an increasing trend of sugarcane
yield ranging from 30 t/ha in east UP. to 50
t/ha in west U.P. with favourable weather
condition in west and northern parts of east
D.P.
The higher maximum temperature in the
range of 36 to 40°C which was much higher
than the optimum temperature requirement <
36°C during germination to active growth
stages was one of the reason for reduction in
yield in east U.P.
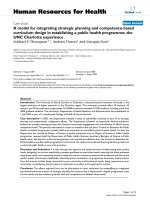
Effect of change in CO2 concentration
(ppm) on Sugarcane Dry weight yield
(kg/ha)
The model sensitivity was also tested when
further changes were made in CO2
concentrations. The CO2 variations were
made from ±50 to 150 ppm and it was found
that the sugarcane dry weight yield increased
on increasing the CO2 concentration levels.
Similar results have also been reported by
Stokes et al., in 2016. He stated that a
simulation model of CO2 effects, based purely
on changes in stomatal conductance (indirect
mechanism), showed transpiration was
reduced by 30% (initially) to 10% (closed
canopy) and yield increased by 3% even in a
well-irrigated crop.
Table.1 Effect of temperature on dry weight yield of sugarcane (kg/ha)
Dates of
Ratooning
12 March 2015
4 March 2016
At normal Tmean
(°C)
7691
7360
Simulated dry weight cane yield (kg/ha)
Average change in temperature by
+1°C
+2°C
+3°C
-1°C
-2°C
-3°C
7057
6499
5954
8277
8887
9561
6938
6103
5372
7759
8304
8455
2953
Int.J.Curr.Microbiol.App.Sci (2019) 8(8): 2951-2955
Table.2 Simulated dry weight yield values (kg/ha) at increased and decreased CO2
concentrations (ppm)
Dates of
Ratooning
12 March 2015
4 March 2016
At current CO2
conc. (ppm)
7691
7360
Simulated dry weight cane yield (kg/ha)
Average change in CO2 conc. (ppm) by
+50
+100
150
-50
-100
-150
7834
7966
7986
7510
7095
6318
7482
7481
7560
7187
6851
6174
Fig.1 Effect of Change in mean temperature (°C) on Sugarcane dry weight yield (kg/ha)
Fig.2 Effect of Change in CO2 concentration (ppm) on Sugarcane dry weight yield (kg/ha)
2954
Int.J.Curr.Microbiol.App.Sci (2019) 8(8): 2951-2955
It is clearly evident from the Figure 2 that the
Sugarcane dry weight yield increased from
7834 kg/ha, 7966 kg/ha and 7986 kg/ha
respectively on raising the CO2 concentration
levels from +50 to +150 ppm from the current
CO2 concentration levels in the year 2015,
while it decreased from 7510 kg/ha, 7095
kg/ha to a minimum of 6318 kg/ha
respectively when the CO2 concentration was
decreased from -50 to -150 ppm.
Similar trend was observed during the studies
that were made in the year 2016. The results
revealed that the cane dry weight yield
increased from 7482 kg/ha, 7481 kg/ha to a
maximum of 7560 kg/ha respectively on
raising the CO2 concentration from 50 to 150
ppm. Also, it was found that yield decreased
from 7187 kg/ha, 6851 kg/ha and 6174 kg/ha
respectively when the CO2 concentration
dropped from 50 to 150 ppm.
In conclusion, sugarcane dry weight yield
decreased with increasing mean temperature
by 3 degree Celsius and vice versa during
both the crop growing seasons. While it
increased
on
increasing
the
CO2
concentrations.
The
decreasing
CO2
concentration had downwelling impact on the
dry weight cane yield and vice versa.
As per the DSSAT crop model, it was
observed that the model is sensitive to any
changes in the parameters like mean
temperature
and
Carbon-dioxide
concentration.
References
Breierova, L. and Choudhary, M., (1996). An
introduction to sensitivity analysis.
System Dynamics in Education Project,
System Dynamics group, Sloan School
of Management, Massachussets Institute
of Technology, pp: 41-107.
Samui, R.P., John, G. and Kulkarni, M.B.
(2003). Impact of Weather on Yield of
Sugarcane at Different Growth Stages.
Jour. Agric. Physics, Vol. 3, No.1 & 2,
pp. 119-125.
Singels, A., Jones, M. and Van, D.B. (2008).
DSSAT v4.5 CANEGRO Sugarcane
Plant Module: scientific documentation,
34. Mount Edgecombe: SASRI.
Stokes, C.J., Inman, N.G., Everingham, Y.L.
and Sexton, J. (2016). Measuring and
modelling CO2 effects on sugarcane.
Environmental Modelling & Software
78 (2016) 68-78.
How to cite this article:
Neha Sharma, Pawan Mall and Nain, A.S. 2019. Testing the Sensitivity of Canegro Model for
Variability in Temperature and Co2 Concentration in Tarai Region of Uttarakhand, India.
Int.J.Curr.Microbiol.App.Sci. 8(08): 2951-2955. doi: />
2955