A study on the use of carbon quantum dots on hCG immune analysis
Bạn đang xem bản rút gọn của tài liệu. Xem và tải ngay bản đầy đủ của tài liệu tại đây (811.7 KB, 7 trang )
ISSN: 1859-2171
e-ISSN: 2615-9562
TNU Journal of Science and Technology
225(02): 58 - 64
A STUDY ON THE USE OF CARBON QUANTUM DOTS
ON hCG IMMUNE ANALYSIS
Mai Xuan Dung 1*, Nguyen Thi Quynh1,2, Ta Van Thao3,
1
Hanoi Pedagogical University 2; 2VNU - University of Science, 3Hanoi Medical University
ABSTRACT
Quantum dot – antibody conjugations are of potential materials for diverse bioanalysis, diagnosis
and medical treatment applications. Herein, we present the synthesis of human chorionic
gonadotropin (hCG) – carbon quantum dot (CQD) conjugate and its application in immune
analysis of hCG antigen. By comparing with the standard analysis procedure, it has been revealed
that hCG-CQD conjugation can be used for the analysis of hCG antigen with a detection limit of
about ng/ml.
Keywords: Carbon quantum dots; human chorionic gonadotropin; antigen; immunoassay;
photoluminescence.
Received: 30/01/2020; Revised: 27/02/2020; Published: 28/02/2020
NGHIÊN CỨU SỬ DỤNG CHẤM LƯỢNG TỬ CARBON
TRONG PHÂN TÍCH hCG
Mai Xuân Dũng1*, Nguyễn Thị Quỳnh1,2, Tạ Văn Thạo3
1
Trường Đại học Sư phạm Hà Nội 2,
Trường Đại học Khoa học Tự nhiên - Đại học Quốc gia Hà Nội, 3Trường Đại học Y Hà Nội
2
TÓM TẮT
Gắn chấm lượng tử (QDs) vào kháng thể để tạo thành vật liệu liên hợp kết hợp được tính đặc hiệu
của kháng thể và tính chất huỳnh quang của QDs có tiềm năng ứng dụng lớn trong phân tích sinh
hóa, chuẩn đoán và điều trị. Trong bài báo này, chúng tôi trình bày kết quả nghiên cứu gắn chấm
lượng tử carbon (CQD) vào kháng thể human chorionic gonadotropin (hCG) và đánh giá khả năng
ứng dụng của vật liệu liên hợp thu được (hCG-CQD) trong phân tích kháng nguyên hCG bằng
phương pháp miễn dịch huỳnh quang. So sánh kết quả phân tích trên 20 mẫu nghiên cứu với kit
chuẩn cho thấy hCG-CQD có thể được sử dụng để phân tích hCG với giới hạn phát hiện cỡ ng/ml.
Từ khóa: chấm lượng tử carbon; human chorionic gonadotropin; kháng nguyên; miễn dịch;
huỳnh quang.
Ngày nhận bài: 30/01/2020; Ngày hoàn thiện: 27/02/2020; Ngày đăng: 28/02/2020
* Corresponding author. Email:
/>; Email:
58
Mai Xuan Dung et al
TNU Journal of Science and Technology
1. Introduction
hCG is a hormone comprised of α-(93-amino
acid, 14.5 kD) and β-(145-amino acid, 22.2 kD)
subunits. While the α-subunit is common to
all members of the glycoprotein hormone
family the β-subunit is unique to hCG owing
to its C-terminal peptide [1]. hCG is produced
by trophoblast cells during early pregnancy
and represents key embryonic signals
essential for the maintenance of pregnancy.
The concentration of β-hCG increases rapidly
after implantation; its levels in serum and
urine reach maximum values after 8 to 10
weeks and then decrease gradually [2].
Therefore, analysis of β-hCG levels in a wide
range of variety provide important
information for diverse clinical situations,
such as diagnosis and monitoring of
pregnancy and pregnancy-related disorders,
prenatal screening, Down syndrome and
gynecological cancers [3]–[6].
Immunofluorescence has been used widely
for the analysis of hCG because of many
advantages, such as short acquiring time,
large range of concentrations and the fact that
the fluorescence signal is not affected by
background emission [7], [8]. In this method,
a half of couple hCG is immobilized on a
solid plate while the other half of the couple
is labelled with fluorescent agent. In our
previous study, we used Eu3+ labelled hCG
for the immunofluorescence analysis of hCG
that exhibited a LOD (limit of detection) of
11.9 ng/ml and a LOQ (limit of
quantification) of 17.9 ng/ml [8]. The
fundamental drawback of using hCG labelled
with Eu3+ complexes is the narrow
photoluminescence excitation range of the
complexes. As for example, the excitation
range
of
Eu-NTA
(2naphthoyltriluoroacetone) is 340 ±10 nm.
Additionally, the expensiveness of lanthanide
metals would raise the cost for hCG
measurements. Recently, quantum dots (QDs)
; Email:
225(02): 58 - 64
[9] and graphene oxide [10] have been
studied to replace the lanthanide complexes in
immunofluorescence assays.
Herein, we report the use of amine terminated
CQDs as fluorescent agent to synthesize
hCG-CQD conjugation and its application in
immunofluorescence analysis of hCG.
2. Experimental
2.1. Materials
Polystyrene (PS) plates, PBS (phosphate
buffer saline), sodium azide (NaN3), BSA
(Bovine Serum Albumin), (sulfosuccinimidyl
4-[N-maleimidomethyl]cyclohexane-1carboxylate) (SMCC), hCG antibody and
hCG antigen were purchased from Thermo
fisher. Other chemicals including citric acid
pentahydrate 99% (CA), 2-iminothiolane 99%
(IMTA), ethylenediamine 99,5% (EDA) and
solvents, such as acetone, dimethylsulfoxide
(DMSO), phosphate buffered saline (PBS1X) were purchased from Alladin Chemicals.
2.2. The synthesis of NH2 – terminated
carbon quantum dots
A 250 ml, three-neck flask containing 50 ml
of CA solution in glycerol was equipped with
sand bath heater, a magnetic stirrer and a
Schlenk line system. Under N2 atmosphere,
the solution was heated up 227oC and 10 ml
solution of EDA in glycerol was rapidly
injected. The amount of EDA was calculated
so that the molar -COOH/-NH2 ratio was
1/2.3. Temperature of the mixture dropped to
about 220oC and it was maintained for 30
minutes. The reaction mixture was cooled by
water. To purify CQDs, acetone was added to
the reaction mixture to precipitate CQDs
which were then collected by mean of
centrifugation at 8000 rpm for 10 minutes at
5oC. Solid CQDs were dispersed in deionized
(DI) water and precipitated again with
acetone. This process was repeated three
times to remove completely glycerol as well
as unreactive precursors. Next, solution of
CQDs in DI water was filtered through
59
Mai Xuan Dung et al
TNU Journal of Science and Technology
0.21μm PTFE membrane filters to remove
large CQD aggregates. Finally, CQDs
solution was dialyzed with a pore size cutoff
of 2000 Dalton against DI water for 24 hours
to remove small particles.
225(02): 58 - 64
calibrating to the absorbance of solution at
280 nm to be 400 µg/mL.
2.3.3. Binding hCG-SH and CQD-SMCC
Mix 1 ml of CQD-SMCC and 1 ml of hCGSH solution for 30 minutes prior to adding 6
μl of aqueous solution of NaN3 (5%) and
then the mixture was stored in dark at 4 oC
until use.
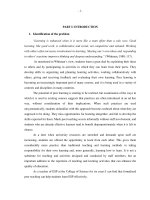
2.3. The synthesis of hCG-CQD conjugation
The stepwise synthesis of hCG-CQD
conjugation is schematically illustrated in Fig. 1.
2.3.1. The synthesis of CQDs having SMCC
binder
2.4. hCG analytic process
After adding 2.2 μl solution of SMCC in
DMSO (10 mg/ml) to 1 ml solution of CQDs
in DMSO (100 mg/ml) the mixture was
vortex mixed for 30 minutes. Unreacted
SMCC was washed out by precipitation with
ethanol. Finally, CQD-SMCC was dissolved
in PBS-1X buffer with a concentration of 4.3
mg/ml.
Standard solutions of hCG antigen with
concentrations of 10.6, 106, 1030, 5180 and
10100 ng/ml were prepared from the original
solution and PBS 0,01M. Add sequentially
150µl of PBS-1X and 25µl of the standard
hCG antigen solution into polystyrene plates
which were previously coated with hCG
antibody [8]. Next, 15µl of hCG-CQD
solution was added and the mixture was
cultured for 2 hours prior to washing three
times with PBS-1X to remove unreacted
hCG-CQD. Finally, 50µl of PBS-1X was
added and fluorescence intensity at 480 nm
was recorded under excitation at 360 nm.
The standard curve was obtained by fitting
the dependence between hCG concentration
(y) and fluorescence intensity (x) using
OriginPro 8RS.
2.4.1. Building up the standard curve
2.3.2. Functionalization of β-hCG with SH
groups
Add sequentially 42 μl solution of IMTA (10
mg/ml) and 40 μl PBS-1X into a tube
containing 8 μl hCG solution (4750 µg/ml)
and mix the mixture for 15 minutes. hCG-SH
was purified by mean of column
chromatography using silica as stationary
phase and PBS-1X as the eluent. The
concentration of hCG-SH was determined by
EDA
H 2N
OH
NH2
O
H 2N
OH
F
F
OH
HO
O
220oC
NH
H 2N
O
O
2
OH
HO
HO
CA
NH
F
2
OH
O
O
N
NaO3S
S
O
O
N
SMCC
O
NH
O
O
NH2
SH
NH
N
O
hCG
hCG-CQD
Figure 1. Procedure to prepare hCG-CQD conjugation
60
; Email:
Mai Xuan Dung et al
TNU Journal of Science and Technology
2.4.2. Analysis of hCG samples
20 hCG samples were randomly selected,
marked and divided into two parts. One was
analyzed using the procedure described in
2.4.1 the other part was analyzed using a
standard kit (DELFIA® hCG kit, Perkin
Elmer). The analysis procedure is illustrated
in Fig. 2.
Figure 2. Procedure for the analysis of hCG using
hCG-CQD conjugation.
2.5. Characterizations
UV-Vis absorption spectra of CQDs aqueous
solution was conducted on a UV-2450
(SHIMADZU). Photoluminescence (PL) and
photoluminescence excitation (PLE) spectra
of CQDs solutions were measured on a
Nanolog® (HORIBA Scientific). Infrared
(FTIR) spectra of solid CQDs were carried
out
on
JASCO
FT/IR6300.
X-ray
photoelectron (XPS) spectra of CQDs was
performed on a PHI 5000 VersaProbe II.
Transmission electron microscopy (TEM)
images of CQDs were obtained on a JEM
2100 (JEOL).
3. Results and discussion
3.1. The structure of carbon quantum dots
Characterization results of CQDs are
summarized in Fig. 3. TEM image shown in
Fig. 3a exhibits CQDs as dark spheres, which
; Email:
225(02): 58 - 64
have a diameter varying from 4.5 to 10 nm.
We rarely observed lattice fringes on CQDs,
indicating that CQDs were mostly
amorphous. Additionally, CQDs had different
degree of carbonization because their
darkness in the TEM image varied. These
observations were similar to those of CQDs
synthesized from CA and EDA by a
hydrothermal method [11]. Chemical analysis
by XPS method shown in Fig. 3b improves
that CQDs were composed of C, N and O
elements. High-resolution XPS spectrum for
C 1s shown in Fig. 3b’ confirmed that C
presented in CQDs in the forms of C-C, C-N
and C-O or C=O whose binding energies are
284.6 eV, 285.7 eV and 287.4 eV,
respectively. Additionally, XPS spectrum of
N 1s shown in Fig. 3b’’ confirms that N were
mainly in pyridinic (398.4 eV), pyrrolic
(399.5 eV) and graphitic (401.1 eV) structural
types. Vibration peaks of important groups
were observed in the FTIR spectrum and
noted in Fig. 3c including –N-H (3400 cm-1),
=C-H (3100 cm-1), -C-H (2800 – 3000 cm-1),
NC=O (1650 cm-1), O=CNH (1570 cm-1). The
existence of amide (O=C-NH) and amine (NH) groups in the absence of acidic carbonyl
(O=C-OH) groups strongly suggests that
CQDs were decorated with amine (-NH2)
groups on the surfaces together with wellknown surface fluorophores (derivative of
citrazinic acid) [11]–[13]. Based on these
characterizations, we modeled CQDs as
shown in Fig. 3d. CQDs involved a
carbogenic core that included polyaromatic
structures embedded in a hydrocarbon matrix;
surface fluorophore as shown in red and
surface polar groups shown in blue.
61
TNU Journal of Science and Technology
a)
b)
O
C
Intensity (a. u)
20 nm
Transmittance (a. u)
Mai Xuan Dung et al
N
100
200
300
400
500
600
700
225(02): 58 - 64
c)
-C-H
=C-H
N-H
O-H
O=CN-H
3500
Binding Energy (eV)
O
O-H
N-C=O
3000
2500
1500
1000
-1
Wavenumber (cm )
N
d)
H
N
Intensity (a. u)
N
H
2
H
2N
N
H
NH
Pyrrolic
b’’)
C-N
C-O
C=O
O
H
O
N
C-C
b’)
O
Intensity (a. u)
HO
Pyridinic
Graphitic
2
O
292
290
288
286
284
282
280
406
278
404
402
400
398
396
394
Binding Energy (eV)
Binding Energy (eV)
Figure 3. a) TEM, b) XPS survey spectrum, c) FTIR spectrum and d) model structure of CQDs. b’) and
b’’) are high-resolution XPS spectra of C 1s and N 1s, respectively.
PLE ( 520 nm)
200 250 300 350 400 450 500 550
ex
PL Intensity (a. u)
Absorption
b)
PL Intensity (a. u)
Absorbance (a. u)
a)
300 nm
320 nm
340 nm
360 nm
380 nm
400 nm
400
450
500
550
600
650
700
Wavelength (nm)
Wavelength (nm)
Figure 4. a) The UV-Vis absorption and PLE (observed at 520 nm), and b) PL spectra of CQDs.
62
CQDs
CQD-SMCC
hCG-CQD
maleimide
Absorbance (a. u)
3.2. The optical properties of CQDs and
hCG-CQD conjugations
The UV-Vis, PLE and PL spectra of CQDs
are summarized in Fig. 4. It is obviously from
Fig. 4a that the absorption and the excitation
spectra of CQDs showed a common broad
peak maximized at about 357±3 nm. This is
the characteristic peak of the surface
fluorophores [13]. The PL spectra of CQDs
were varied with excitation wavelength as
seen in Fig. 4b. PL intensity reached
maximum values when excited at about 360
nm. Additionally, PL intensity maximized at
480 nm and it was independent to the excitation
wavelength. These results suggest that the
optical properties of CQDs were dominated by
the surface fluorophore [12], [13].
200
250
300
350
400
450
500
Wavelength (nm)
Figure 5. UV-Vis absorption of CQDs, CQDSMCC and hCG-CQD normalized at 355 nm.
Thank to surface amine groups, CQDs were
easily decorated with SMCC via the reaction
between the amine groups and N-hydroxy
succinimide-ester head of SMCC. Due to
maleimide group of SMCC has a
; Email:
Mai Xuan Dung et al
TNU Journal of Science and Technology
225(02): 58 - 64
characteristic absorption band in 200-300 nm (maximum at 256 nm), the absorption shoulder of
CQDs at 245 nm were blurred in CQD-SMCC as well as in hCG-CQD conjugation. Similarly,
the absorbance of hCG-CQD conjugation near 280 nm increased as compared with CQDs or
CQD-SMCC because hCG absorbs light near 280 nm. Importantly, the characteristic absorption
band of the surface fluorophore 355 nm was still visible in the hCG-CQD conjugation. This
observation indicates that the conjugation of hCG to CQDs via SMCC link does not alter the
surface fluorophore; hence the fluorescent properties of CQDs.
Table 1. Comparison the analysis results using hCG-CQD and the standard kit.
β-hCG (ng/ml)
Standard
kit
hCG-CQD
STT
1
489
506
2
823
817
3
858
869
4
1356
1400
5
1390
1305
6
1589
1426
7
1678
1590
8
1765
1826
9
1878
1905
10
2050
2095
Deviation
(%)
3.5
-0.7
1.3
3.2
-6.1
-10.3
-5.2
3.5
1.4
2.2
3.3. The analysis of hCG antigen using
hCG-CQD conjugation
The analytic results conducted on 20 hCG
samples using either procedure in 2.4.1 or
standard kit are summarized in Table 1. The
experimental results deviated by -10.3-7.3%
as compared with the standard procedure. The
average deviation was about 4.2%.
Additionally, based on the fluorescence
intensity on blank samples and the standard
curve, LOD and LOQ were estimated
according to ref [14] to be about 7.1 and 15.8
ng/ml, respectively.
4. Conclusions
CQDs have been synthesized successfully by
a hot injection method. CQDs were spherical
with a diameter ranging from 4.5 to 10.3 nm
and had amine and fluorophore functional
groups on the surfaces. The surface amine
groups are useful for preparation of hCGCQD conjugation via SMCC linker while the
surface fluorophore accounts for the optical
properties of CQDs as well as resultant hCGCQD conjugations. It has been demonstrated
that
hCG-CQD
conjugations
were
successfully used as labelled antibody for
immunofluorescence assay with good LOD
; Email:
STT
11
12
13
14
15
16
17
18
19
20
β-hCG (ng/ml)
Standard kit hCG-CQD
2230
2325
2316
2486
2563
2336
2650
2475
2865
2938
2905
2705
3215
3150
3547
3605
4575
4750
4650
4550
Deviation
(%)
4.3
7.3
-8.9
-6.6
2.5
-6.9
-2.0
1.6
3.8
-2.2
and LOQ values. The results are of important
to deploy non-toxic, fluorescent CQD and its
antibody conjugation into diverse field of
bioanalyses.
Acknowledgements
This research was funded by the Ministry of
Education and Training Vietnam, the
Foundation for Science and Technology
Development
of
Hanoi
Pedagogical
University 2 and Chemedic Company via
grant number B.2018-SP2-13.
REFERENCES
[1]. C. Nwabuobi, S. Arlier, F. Schatz, O.
Guzeloglu-Kayisli, C. J. Lockwood, and U. A.
Kayisli, “hCG: Biological functions and clinical
applications,” Int. J. Mol. Sci., vol. 18, no. 10, pp.
1-15, 2017, doi: 10.3390/ijms18102037.
[2]. U. H. Stenman, A. Tiitinen, H. Alfthan, and L.
Valmu, “The classification, functions and clinical
use of different isoforms of HCG,” Hum. Reprod.
Update, vol. 12, no. 6, pp. 769-784, 2006, doi:
10.1093/humupd/dml029.
[3]. D. Liu et al., “Multiplexed immunoassay
biosensor for the detection of serum biomarkers β-HCG and AFP of Down Syndrome based on
photoluminescent
water-soluble
CdSe/ZnS
quantum dots,” Sensors Actuators, B Chem., vol.
186, pp. 235-243, 2013, doi: 10.1016/j.snb.
2013.05.094.
63
Mai Xuan Dung et al
TNU Journal of Science and Technology
[4]. R. Hoermann, G. Spoettl, R. Moncayo, and K.
Mann, “Evidence for the presence of human
chorionic gonadotropin (hCG) and free β-subunit
of hCG in the human pituitary,” J. Clin.
Endocrinol. Metab., vol. 71, no. 1, pp. 179-186,
1990, doi: 10.1210/jcem-71-1-179.
[5]. C. D. Walkey and W. C. W. Chan, Quantum
Dots for Traceable Therapeutic Delivery, Elsevier
Inc., 2014.
[6]. P. Bottoni and R. Scatena, “The Role of CA
125 as Tumor Marker: Biochemical and Clinical
Aspects Introduction: Biochemical,” Adv Exp Med
Biol., vol. 867, pp. 229-244, 2015, doi:
10.1007/978-94-017-7215-0.
[7]. L. A. Cole, Problems with today’s hCG
pregnancy tests, Elsevier Inc., 2015.
[8]. T. V. Thao, T. H. Yen, N. T. Quynh, V. Ta, H.
Tran, and Q. Nguy, “A study to anchor hCG on
polystyrene for immunoanalysis of beta-hCG,”
TNU J. Sci. Technol., vol. 208, no. 15, pp. 117123, 2019.
[9]. C. Zhou et al., “Synthesis of size-tunable
photoluminescent
aqueous
CdSe/ZnS
microspheres via a phase transfer method with
amphiphilic oligomer and their application for
detection of HCG antigen,” J. Mater. Chem., vol.
21, no. 20, pp. 7393-7400, 2011, doi:
10.1039/c1jm10090d.
64
225(02): 58 - 64
[10]. N. Xia, X. Wang, and L. Liu, “A graphene
oxide-based fluorescent method for the detection
of human chorionic gonadotropin,” Sensors
(Switzerland), vol. 16, no. 10, pp. 1-10, 2016, doi:
10.3390/s16101699.
[11]. S. Zhu et al., “Highly photoluminescent
carbon dots for multicolor patterning, sensors, and
bioimaging,” Angew. Chemie - Int. Ed., vol. 52,
no. 14, pp. 3953-3957, 2013, doi: 10.1002/anie.
201300519.
[12]. Q. B. Hoang, V. T. Mai, D. K. Nguyen, D.
Q. Truong, and X. D. Mai, “Crosslinking induced
photoluminescence quenching in polyvinyl
alcohol-carbon quantum dot composite,” Mater.
Today Chem., vol. 12, pp. 166-172, Jun. 2019, doi:
10.1016/j.mtchem.2019.01.003.
[13]. T. H. T. Dang, V. T. Mai, Q. T. Le, N. H.
Duong, and X. D. Mai, “Post-decorated surface
fluorophores enhance the photoluminescence of
carbon quantum dots,” Chem. Phys., vol. 527, no.
July, p. 110503, 2019, doi: 10.1016/j.chemphys.
2019.110503.
[14]. A. Shrivastava and V. Gupta, “Methods for
the determination of limit of detection and limit of
quantitation of the analytical methods,”
Chronicles Young Sci., vol. 2, no. 1, p. 21, 2011,
doi: 10.4103/2229-5186.79345.
; Email: