A systematic review and meta-analysis of the nutrient content of preterm and term breast milk
Bạn đang xem bản rút gọn của tài liệu. Xem và tải ngay bản đầy đủ của tài liệu tại đây (1.23 MB, 14 trang )
Gidrewicz and Fenton BMC Pediatrics 2014, 14:216
/>
RESEARCH ARTICLE
Open Access
A systematic review and meta-analysis of the
nutrient content of preterm and term breast milk
Dominica A Gidrewicz1* and Tanis R Fenton2
Abstract
Background: Breast milk nutrient content varies with prematurity and postnatal age. Our aims were to conduct a
meta-analysis of preterm and term breast milk nutrient content (energy, protein, lactose, oligosaccharides, fat,
calcium, and phosphorus); and to assess the influence of gestational and postnatal age. Additionally we assessed
for differences by laboratory methods for: energy (measured vs. calculated estimates) and protein (true protein
measurement vs. the total nitrogen estimates).
Methods: Systematic review results were summarized graphically to illustrate the changes in composition over
time for term and preterm milk. Since breast milk fat content varies within feeds and diurnally, to obtain accurate
estimates we limited the meta-analyses for fat and energy to 24-hour breast milk collections.
Results: Forty-one studies met the inclusion criteria: 26 (843 mothers) preterm studies and 30 (2299 mothers) term
studies of breast milk composition. Preterm milk was higher in true protein than term milk, with differences up to
35% (0.7 g/dL) in colostrum, however, after postnatal day 3, most of the differences in true protein between
preterm and term milk were within 0.2 g/dL, and the week 10–12 estimates suggested that term milk may be the
same as preterm milk by that age. Colostrum was higher than mature milk for protein, and lower than mature milk
for energy, fat and lactose for both preterm and term milk. Breast milk composition was relatively stable between 2
and 12 weeks. With milk maturation, there was a narrowing of the protein variance. Energy estimates differed
whether measured or calculated, from −9 to 13%; true protein measurement vs. the total nitrogen estimates
differed by 1 to 37%.
Conclusions: Although breast milk is highly variable between individuals, postnatal age and gestational stage
(preterm versus term) were found to be important predictors of breast milk content. Energy content of breast milk
calculated from the macronutrients provides poor estimates of measured energy, and protein estimated from the
nitrogen over-estimates the protein milk content. When breast milk energy, macronutrient and mineral content
cannot be directly measured the average values from these meta-analyses may provide useful estimates of mother’s
milk energy and nutrient content.
Keywords: Human milk, Lactation, Breast milk, Infant, Premature
Background
Breast milk composition is variable. While breast milk is
the recommended feeding for all infants [1-3], including
preterm infants [2,4,5], its variable composition makes
estimating nutrient intakes difficult. Milk produced by
mothers who deliver prematurely is well known to be
higher in protein [4,5]. Milk composition changes with
postnatal age; protein content decreases over weeks after
* Correspondence:
1
Department of Pediatrics, University of Calgary, 2888 Shaganappi Trail NW,
Calgary, AB T3B 6A8, Canada
Full list of author information is available at the end of the article
birth [6]. Breast milk fat and energy content varies from
the start to the end of a feeding, and follows a diurnal
pattern in both term [7,8] and preterm milk [8,9].
In addition, there are several reasons for the variability in
the values of breast milk composition due to laboratory
methods used for the analysis. Two approaches have been
used to quantify energy in breast milk: a) direct energy
quantification by combusting in a bomb calorimetry and b)
calculated energy estimates using Atwater energy multiplication factors for the macronutrients: protein, fat, and
carbohydrate [10]. Two methods used to estimate protein
© 2014 Gidrewicz and Fenton; licensee BioMed Central Ltd. This is an Open Access article distributed under the terms of the
Creative Commons Attribution License ( which permits unrestricted use,
distribution, and reproduction in any medium, provided the original work is properly credited. The Creative Commons Public
Domain Dedication waiver ( applies to the data made available in this
article, unless otherwise stated.
Gidrewicz and Fenton BMC Pediatrics 2014, 14:216
/>
content include a) direct quantification of the true protein
content and b) quantification of the nitrogen (assuming
that all nitrogen is protein, rather than recognition that
some is in non-protein nitrogen compounds [11-13].
Thus we conducted a systematic review and metaanalysis of observational studies on the composition of
breast milk nutrient content (energy, macronutrient (protein, lactose, fat)) and mineral content (calcium, phosphorus). We hypothesized that the composition of breast
milk depends on four variables, which include: gestational stage (premature birth), postnatal age, calculated
versus measured energy estimates, and protein method
(true protein versus total nitrogen). We conducted the
meta-analyses of breast milk composition stratified by
these 4 factors (gestational stage; postnatal age; energy
estimation method [measurement vs. calculation]; and
protein estimation method [true protein versus total nitrogen]), to determine whether any or all of these factors should be considered when estimating breast milk
nutrient content.
Methods
Page 2 of 14
Data extraction
All article titles were examined for potential fit to the inclusion criteria by the two reviewers (DG and TRF).
When the title was not clear regarding the potential fit,
then the abstract was reviewed; when the abstract was
not clear whether the study fit the inclusion criteria, the
paper was reviewed. In studies where the data was presented in a non-numerical format, and thus not possible
to include in a meta-analysis, efforts were made (by DG)
to contact the author to obtain these data. If no response
was received to the request or the author was unable to
provide additional data, the study was not included in
the meta-analysis. Data were extracted by DG and
checked for accuracy by TRF.
Since breast milk fat content varies between fore and
hind milk [6,7] and diurnally between early and later in
the day [7-9], to obtain accurate estimates we limited
the meta-analyses for energy and fat to 24-hour breast
milk collections. This requirement was not placed on
the other analyses since the differences between fore and
hind milk and diurnally in protein are not of an important magnitude [6,7].
Literature search
In an attempt to find all published literature on the topic,
studies relating to breast milk content in premature
and mature milk were identified through computerized
searches. First searches were conducted in MedLine
and Embase for studies published in any language using
the following Medical Subject Headings and text words:
human, milk, lactation, breast milk, breast milk, protein,
energy calories, lactose, oligosaccharide(s), fat, calcium,
phosphorus, and infant, premature, preterm, neonate, or
newborn, independently by the two investigators (DG and
TRF) in March 2014. In an effort to include all available
studies, a Web of Science search was conducted for all
papers that cited the references Schanler et al. 1980 [14]
and Atkinson SA et al. 1980 [15] (by DG). A grey literature search was also conducted to avoid reporting bias
and look for unpublished literature (by DG) in March
2014. We reviewed the reference lists of included papers.
The inclusion criteria were: studies that reported on
analysis of energy, macronutrient (protein, fat, lactose)
and/or mineral (calcium, phosphorus) content in the
breast milk of healthy, term (37–42 wk of gestation) and
preterm (<37 wk of gestation) infants, if the data were
reported categorized by postnatal age and term versus
preterm status. Review articles and commentaries were
excluded. Studies conducted in developing countries
(i.e. outside North America, Europe, Australia, Israel
and Japan [16]) were excluded in an attempt to exclude
mothers with suboptimal nutritional status. The Metaanalysis Of Observational Studies in Epidemiology
(MOOSE) Proposal for Reporting [17] was used to guide
this study.
Analysis
Meta-analyses were carried out on studies that reported
the following outcomes in either healthy, term or preterm
delivering mothers: total energy (kcal/dL), protein (g/dL),
fat (g/dL), lactose content (kcal/dL), calcium (mg/dL),
and phosphate (mg/dL). Data was grouped into the following time points: 1–3 days (representing colostrum), 4
to 7 days, week 2 (day 8–14), week 3–4 (days 15–28),
week 5–6 (days 29–42), week 7–9 (days 43 – 63), week
10–12 (days 64 – 84). We continued the meta-analyses to
12 weeks since age-specific data was sparse for the analyses after this age.
To examine whether the two energy measures, bomb
calorimetry and calculation methods, estimated different
energy contents, separate meta-analyses were prepared
for each energy estimation method and compared. Energy reported as kilojoules was converted to kilocalories
by dividing by 4.184.
Historically, protein in breast milk has been estimated
in two different ways: including or excluding the nonprotein nitrogen. Thus, we conducted two meta-analyses
of protein for the available data: an estimate of protein
based on the assumption that all of the nitrogen is protein
and a true protein estimate which excludes the nonprotein nitrogen. When only total protein was only reported in terms of total nitrogen, total protein was calculated by multiplying the nitrogen by 6.25 [12-14,18-23].
Mineral data reported as millimoles was converted to
milligrams by multiplying by the molecular weight.
Breast milk data reported per kilogram was converted to
per liter by dividing by 1.032 [24].
Gidrewicz and Fenton BMC Pediatrics 2014, 14:216
/>
Page 3 of 14
Table 1 Studies included in the meta-analysis
Reference
Site
Preterm
n
Anderson et al., 1983 [18]
US
28-36 weeks
14
37-42 weeks
9
E, Pro, fat
Australia
26-33 weeks
6
38-40 weeks
7
Pro, lactose
10
Arnold et al., 1987 [130]
Subjects
Reported outcomes
Term
Atkinson et al., 1980 [15]
Canada
26-33 weeks
13
38-40 weeks
Atkinson et al., 1981 [19]
Canada
BW < 1300 g
7
-
Bejiers et al., 1992 [128]
Netherlands
Britton et al., 1986 [137]
US
n
Ca, P
E, Pro, lactose, fat
25.7–30.9 weeks
30
-
25-35 weeks
70
38-42 weeks
38
Pro
8
≥ 37 weeks
13
Pro, Ca, P
Term
40
E, Pro, fat
Butte et al., 1984 [13]
US
< 37 weeks
Butte et al., 1984 [122]
US
-
Pro
Butte NF et al., 1990 [123]
US
-
39.9 ± 0.9 weeks
40
E, Pro, lactose, fat
Coppa et al., 1993 [140]
Italy
-
Term
46
Lactose, oligo
Coppa et al., 1997 [141]
Italy
27-35 weeks
26
-
Corvaglia et al., 2008 [20]
Italy
26-32 weeks
55
37-41 weeks
69
Pro
Australia
31-35 weeks
22
> 38 weeks
16
Pro, lactose
US
26-33 weeks
21
-
Faerk et al., 2001 [133]
Denmark
< 32 weeks
101
-
Ferris et al., 1988 [21]
US
Cregan MD, 2002 [135]
Ehrenkranz et al., 1984 [142]
-
Garza et al., [124]
US
-
Gabrielli et al., 2011 [143]
Italy
25-30 weeks
63
Oligo
fat
Pro
> 37 weeks
12
Term
10
-
Pro, lactose
E
Lactose, oligo
Gross et al., 1980 [131]
US
28-36 weeks
33
38-42 weeks
18
Pro, lactose, Ca
Guerrini et al., 1981 [144]
Italy
29-37 weeks
25
38-42 weeks
47
fat
Hibberd et al., 1982 [11]
UK, Germany
-
> 37 weeks
10
E, Pro, lactose, fat, Ca
Hosoi et al., 2005 [134]
Japan
-
Term
114
Pro
Hurgoiu et al., 1986 [145]
Romania
27-34 weeks
28
-
Ca
Itabashi et al., 1999 [129]
Japan
26-33 weeks
15
-
Pro, lactose, Ca, P
Lepage et al., 1984 [120]
Canada, US
26-36 weeks
32
> 37 weeks
19
E, Pro
Lemons et al., 1982 [12]
US
27-37 weeks
20
39-41 weeks
7
E, Pro, lactose, fat, Ca, P
Netherlands
25-29 weeks
79
-
Maas et al., 1998 [22]
Michaelsen et al., 1994 [139]
Denmark
Montagne et al., 1999 [136]
France
Motil et al., 1997 [125]
Nommsen et al., 1991 [127]
Reinken et al., 1985 [132]
< 37 weeks
US
-
US
-
Germany
Saarela et al., 2005 [6]
Finland
Sadurskis et al., 1998 [119]
Sweden
Sanchez-Pozo et al., 1986 [138]
Spain
Sann et al., 1981 [146]
France
46
E, Pro, lactose, fat
37-41weeks
91
Pro, fat, lactose
> 37 weeks
28
Pro
38-42 weeks
10
E, Pro
Term
58
E, Pro, fat
28-33 weeks
16
38-40 weeks
24
Pro
31.4 ± 3 weeks
36
40.2 ± 1.4 weeks
53
E, Pro, lactose, fat
Term
23
E
Term
209
Protein
38-41 weeks
61
Pro, lactose, fat, Ca, P,
26-35 weeks
41
Schanler et al., 1980 [14]
US
29.7 ± 0.5 weeks
16
-
Pro, Ca
Thomas et al., 1986 [121]
US
30-34 weeks
20
-
E, Pro, lactose, fat
Yamawaki et al., 2005 [23]
Japan
-
BW > 2500 g
1180
Pro, lactose, Ca, P
Viverge et al., 1990 [147]
France
-
Term
15
Lactose, oligo
Wood et al., 1988 [126]
US
-
22
E
Total
37-42 weeks
843
2299
E = energy, Pro = protein, oligo = oligosaccharides, Ca = calcium, P = phosphate, BW = birth weight, g = gram, UK = United Kingdom, US = United States.
Gidrewicz and Fenton BMC Pediatrics 2014, 14:216
/>
Page 4 of 14
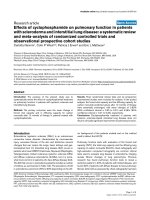
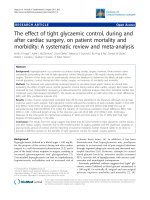
Figure 1 Flow diagram of the literature search process.
The nutrient content meta-analyses were calculated as
weighted averages and pooled standard deviation for
each time period, for preterm and term breast milk. For
statistical comparisons, t-tests were used to compare
preterm and term milk composition. Given the multiple
comparisons made in this study, an approximate Bonferroni adjustment was made, and the p-value for statistical
significance used was 0.001.
Results
A total of 41 studies were included in the analysis: 26 (843
mothers) and 30 (2299 mothers) studies reporting on
preterm and term breast milk composition, respectively
(Table 1). Attempts were made to contact authors of nine
studies, we received replies from four, but no additional information was received for the meta-analyses. Ninety-nine
studies were excluded for reasons provided in Figure 1: no
Table 2 Meta-analysis summary estimates of breast milk composition per 100 milliliters at various postnatal ages
(mean (+/−2 standard deviations))
Preterm
Energy (kcal)
Protein (g)
Fat (g)
Calcium (mg)
Phosphorus (mg)
1 week
60 (45–75)
2.2 (0.3-4.1)
2.6 (0.5-4.7)
26 (9–43)
11 (1–22)
2nd week
71 (49–94)
1.5 (0.8-2.3)
3.5 (1.2-5.7)
25 (11–39)
15 (8–21)
st
Week 3/4
77 (61–92)
1.4 (0.6-2.2)
3.5 (1.6-5.5)
25 (13–36)
14 (8–20)
Week 10/12
66 (39–94)
1.0 (0.6-1.4)
3.7 (0.8-6.5)
29 (19–38)
12 (8–15)
Term
Energy (kcal)
Protein (g)
Fat (g)
Calcium (mg)
Phosphorus (mg)
st
1 week
60 (44–77)
1.8 (0.4-3.2)
2.2 (0.7-3.7)
26 (16–36)
12 (6–18)
2nd week
67 (47–86)
1.3 (0.8-1.8)
3.0 (1.2-4.8)
28 (14–42)
17 (8–27)
Week 3/4
66 (48–85)
1.2 (0.8-1.6)
3.3 (1.6-5.1)
27 (18–36)
16 (10–22)
Week 10/12
68 (50–86)
0.9 (0.6-1.2)
3.4 (1.6-5.2)
26 (14–38)
16 (9–22)
Estimates as +/− 2 standard deviations assumed no skew. Energy values were bomb calorimeter measured values except for 10–12 weeks, which were calculated
values. Protein values are true measured protein, not based on total nitrogen content.
Gidrewicz and Fenton BMC Pediatrics 2014, 14:216
/>
Page 5 of 14
Table 3 Meta-analysis results of preterm and term breast milk energy content over time from measured and calculated
estimates
Comparison: Bomb calorimetry energy measurement (kcal/dL)♦
Preterm
Time frame:
Term
Preterm & term compared
mean
SD
n
Mean
SD
n
% difference
p-value
d 1-3
49
7
12
54
8
19
−10
0.34
d 4-7
71
9
52
66
9
37
7
0.02
week 2
71
12
53
66
9
34
7
0.04
week 3-4
77
8
27
66
8
97
16
< 0.00001*
week 5-6
70
5
14
63
7
40
11
< 0.00001*
week 7-9
76
8
11
63
7
77
21
< 0.00001*
-
-
-
63
8
83
-
-
week 10-12
Energy meta-analysis was limited to 24 hour collections
♦ References: [11,12,18,119-126]
Comparison: Calculated energy content (kcal/dL)♦♦
Preterm
Time frame:
Term
Preterm & term compared
mean
SD
n
Mean
SD
n
d 1-3
-
-
-
-
-
-
% difference
p-value
d 4-7
65
13
41
68
9.6
48
week 2
70
14
95
-
-
-
−5
0.21
week 3-4
68
8.0
135
70
9.3
46
week 5-6
67
6.9
79
-
-
-
−2
0.26
week 7-9
66
8.9
63
69
9.9
week 10-12
66
14
14
68
9.0
43
−4
0.16
95
−3
0.50
Difference
% difference
p-value
-
-
−2
2%
0.350
−3
5%
0.007
−6
9%
0.0003*
−5
9%
0.0002*
♦♦ References: [6,19,22,121,127]
Comparison: Measured vs. calculated energy
Preterm
Difference
d 1-3
Term
% difference
p-value
-
-
d 4-7
6
−9%
0.009
week 2
1
−2%
0.66
week 3-4
9
−11%
< 0.00001*
week 5-6
3
−5%
0.11
week 7-9
10
−13%
0.0009*
week 10-12
*Statistically significant difference. In compensation for multiple comparisons, an approximate Bonferroni adjustment was made and the p-value for statistical
significance was < 0.001.
original data/review articles [25-39], studies performed in
developing countries [40-48], no numerical results [49-59],
not 24-hour milk collection/pooled milk (required only
for energy and fat contents) [7-9,60-70], no report of
macro/micronutrient contents [36,71-107], did not report
time frames used in the meta-analyses [108-116], other
[117,118]. Energy was estimated in 11 studies using bomb
calorimetry [11,12,18,119-126] and in five studies by
calculation using values for the energy contributions from
fat, protein, and carbohydrate [6,19,22,121,127]. Protein
was estimated based on total nitrogen in 23 studies
[6,11-14,18-23,120,122,123,125,128-135] and as a true protein estimate in 15 studies [11-14,18,19,121-123,127-129,
136-139]. A summary of the meta-analyses breast milk
composition at various postnatal ages for energy, protein,
fat, calcium and phosphorus is outlined in Table 2.
Energy measurement vs. calculation from the
macronutrients
In the comparison between measured and calculated
energy contents of milk, measured estimates were −6 to
10 kcal/dL (−9 to 13%) greater than the calculated
Gidrewicz and Fenton BMC Pediatrics 2014, 14:216
/>
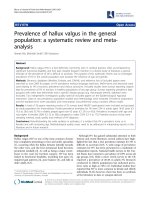
Figure 2 Measured Energy distribution of preterm and term
breast milk by postnatal age over the first 12 weeks of
lactation, weighted mean and 95% reference interval. Preterm
milk …. Term milk —— : mean +/- 2 standard deviations.
analyses (Table 3, Figures 2 and 3), but only four differences (preterm milk at weeks 3–4 and 7–9, term milk at
weeks 7–9 and 10–12 weeks) met the adjusted statistical
significance criteria (i.e. p < 0.001). Most of the preterm
measured energy estimates had less than 30 subjects
(Table 3), and while the calculated energy estimates
generally had higher numbers; none of the studies that
reported calculated energy estimates had any data for
the first few postnatal days (Figure 2 and 3, Table 3).
Protein estimation method [true protein versus total
nitrogen estimate]
Almost all of the differences in protein content, between
the estimates of protein based on total nitrogen content
and the measured true protein estimates were statistically significantly lower for the true protein measures for
most time periods, for both term and preterm milk,
(Table 4, Figures 4 and 5). The most common differences in quantity between the total nitrogen and true
protein estimates was 0.3 g/dL (Table 4).
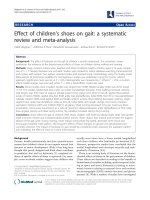
Figure 3 Calculated Energy estimates distribution of preterm
and term breast milk by postnatal age over the first 12 weeks
of lactation, weighted mean and 95% reference interval.
Preterm milk …. Term milk –– : mean +/- 2 standard deviations.
Page 6 of 14
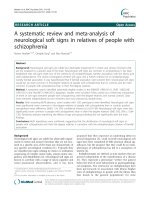
Figure 4 True Protein content distribution of preterm and term
breast milk in by postnatal age over the first 12 weeks of
lactation, weighted mean and 95% reference interval. Preterm
milk …. Term milk —— : mean +/- 2 standard deviations.
Gestational stage effect: preterm milk compared to
term milk
In a comparison of the term versus preterm milk, most
of the analytes (with the exception of fat and calculated
energy) had some differences between the preterm and
term milk composition that were statistically significant
(Tables 3, 4, 5, 6, 7).
The energy content of preterm milk was similar to term
milk at all postnatal ages, with three significant differences
for the bomb calorimetric methods between 3 to 9 weeks;
with differences of −10-21% (Table 3, Figures 2 and 3).
We found no measured energy content data on preterm
milk after 9 weeks.
Preterm milk was higher in true protein than term milk,
with maximum mean differences up to 35% (0.7 g/dl) in
the first few days after birth (Table 4, Figure 4). However,
after postnatal day 3, most of the differences in true
protein between preterm and term milk were within
0.2 g/dL or less, and the week 10–12 estimates suggested that term milk may be the same as preterm milk
by that age. The estimates of protein based on total
Figure 5 Fat content distribution of preterm and term breast
milk by postnatal age over the first 12 weeks of lactation,
weighted mean and 95% reference interval. Preterm milk ….
Term milk —— : mean +/- 2 standard deviations.
Gidrewicz and Fenton BMC Pediatrics 2014, 14:216
/>
Page 7 of 14
Table 4 Meta-analysis results of preterm and term breast milk protein content over time
Comparison: True protein comparisons: Preterm vs. term (g/dL)♦
Preterm
Time frame:
Term
Preterm & term compared
mean
SD
n
mean
SD
n
% difference
p-values
d 1-3
2.7
1.5
141
2.0
0.9
108
35
< 0.00001*
d 4-7
1.7
0.5
165
1.6
0.3
185
7
0.005
week 2
1.5
0.4
191
1.3
0.2
256
16
< 0.00001*
week 3-4
1.4
0.4
92
1.1
0.2
194
27
< 0.00001*
week 5-6
1.1
0.2
38
1.0
0.1
85
7
0.0003
week 7-9
1.1
0.2
30
0.9
0.1
113
20
< 0.00001*
week 10-12
1.0
0.2
25
1.0
0.1
221
2
0.37
♦ References: [11-14,18,19,121-123,127-129,136-139]
Comparison: Total protein comparisons: Preterm vs. term (g/dL)♦♦
Preterm
Time frame:
Term
Preterm & term compared
mean
SD
n
mean
SD
n
% difference
p-values
d 1-3
2.8
1.1
94
2.0
0.6
168
37
< 0.00001*
d 4-7
2.1
0.5
244
2.0
0.5
229
4
0.04
week 2
1.9
0.4
253
1.8
0.4
192
8
< 0.00001*
week 3-4
1.6
0.4
439
1.5
0.3
210
9
0.01
week 5-6
1.4
0.3
268
1.1
0.2
357
18
< 0.00001*
week 7-9
1.1
0.2
183
1.3
0.2
453
−10
< 0.00001*
week 10-12
1.3
0.3
18
1.2
0.2
109
12
0.07
♦♦ References: [6,11-14,18-23,120,122,123,125,128-135]
Comparisons: True vs. Total protein ♦♦♦
Difference
% difference
p-value
Difference
% difference
p-value
d 1-3
0.1
4%
0.60
0
1%
0.91
d 4-7
0.3
20%
< 0.00001*
0.4
24%
< 0.00001*
week 2
0.4
26%
< 0.00001*
0.5
36%
< 0.00001*
week 3-4
0.2
12%
< 0.00001*
0.4
31%
< 0.00001*
week 5-6
0.3
27%
< 0.00001*
0.1
11%
< 0.00001*
week 7-9
week 10-12
0
3%
0.35
0.3
37%
< 0.00001*
0.3
32%
0.0002
0.2
20%
< 0.00001*
♦♦♦Estimates based on true protein content versus the assumption that all nitrogen is protein.
*Statistically significant difference. In compensation for multiple comparisons, an approximate Bonferroni adjustment was made and the p-value for statistical
significance was < 0.001.
nitrogen suggested differences between preterm and
term milk as high as 37% (0.8 g/dl) in the first few days,
however after day 3, the most common difference
between preterm and term protein estimates based on
total nitrogen was 0.1 g/dL (Table 4).
The fat content of the preterm milk did not differ statistically (all p-values > 0.001) between preterm and term
milk at any point in time, even though preterm milk was
23% higher than term milk (non-significant) in the first
few days of life (Table 5, Figure 5).
Lactose was significantly lower in preterm milk compared to term milk, in the first 3 days and at a few later
time points (Table 5, Figure 6). The general pattern of
oligosaccharides showed similarities between preterm and
term milk, although there was limited data for preterm
milk (data only on days 4 – week 4) (Table 5, Figure 7).
One difference was statistically significant for days 4–7
when preterm milk was 12% higher than term milk.
The minerals, calcium and phosphate, were mostly similar between preterm and term milk. (Table 6, Figures 8
and 9).
The milk maturity effect
In general, the meta-analyses of breast milk composition
revealed relatively stable milk content between 2 and
12 weeks, after the initial fluctuations as the milk changed from colostrum to more mature milk (Tables 3, 4, 5,
6 and 7, Figures 2, 3, 4, 5, 6, 7, 8 and 9). The
Gidrewicz and Fenton BMC Pediatrics 2014, 14:216
/>
Page 8 of 14
Table 5 Meta-analysis results of preterm and term breast milk fat, lactose and oligosaccharide content over time
Preterm
Term
Preterm & term compared
Fat (g/dL)♦
Time frame:
mean
SD
n
mean
d 1-3
2.2
0.9
76
1.8
d 4-7
3.0
1.2
111
2.6
week 2
3.5
1.1
158
3.0
week 3-4
3.5
1.0
180
3.4
week 5-6
3.2
0.8
95
week 7-9
3.3
0.9
120
week 10-12
3.7
1.5
SD
n
% difference
p-value
0.7
74
23
0.002
0.8
136
16
0.002
0.9
48
15
0.01
0.8
127
5
0.12
3.6
1.1
20
−11
0.07
3.4
0.8
83
−3
0.38
22
3.4
0.9
95
7
0.31
Fat meta-analysis was limited to 24 hour collections.
♦ References: [6,11,12,18,19,22,121-123,125,127,142,144,146]
Lactose (kcal/dL)♦♦
Time frame:
mean
SD
n
mean
SD
n
% difference
p-value
d 1-3
5.1
0.7
95
5.6
0.6
59
−9
< 0.00001*
d 4-7
6.3
1.1
114
6.0
1.0
281
4
0.009
week 2
5.7
0.8
231
6.2
0.6
100
−8
< 0.00001*
week 3-4
6.0
0.5
225
6.7
0.7
193
−10
< 0.00001*
week 5-6
5.8
0.6
104
6.1
1.0
22
−6
0.06
week 7-9
6.3
0.4
123
6.5
0.5
646
−2
< 0.00001*
week 10-12
6.8
0.3
28
6.7
0.7
58
2
0.47
♦♦References: [6,11,12,19,21-23,121,123,129-131,135,140,143,146,147]
Oligosaccharides (g/dL) ♦♦♦
Time frame:
mean
SD
n
mean
SD
n
% difference
p-value
-
-
-
1.6
0.2
9
-
-
days 4-7
2.1
0.4
89
1.9
0.4
93
12
0.0009
week 2 (days 7–14)
2.1
0.5
89
1.9
0.4
54
7
0.004
week 3–4 (days 15–30)
d 1-3
1.7
0.3
152
1.6
0.3
46
12
0.27
week 5-6
-
-
-
1.4
0.3
46
-
-
week 7-9
-
-
-
1.3
0.3
46
-
-
week 10-12
-
-
-
-
-
-
-
-
♦♦♦References: [140,141,143,147].
*Statistically significant difference. In compensation for multiple comparisons, an approximate Bonferroni adjustment was made and the p-value for statistical
significance was < 0.001.
composition of colostrum compared to more mature
milk (5 to 12 weeks) differed for all of the macronutrients by 16% or more (Table 2, Figures 2, 3, 4, 5, 6 and
7). Compared to colostrum, mature milk protein content
decreased dramatically while fat increased by approximately one half in preterm milk or doubled in term
milk. Measured energy and lactose were higher in
mature milk compared to colostrum (Tables 3 and 5
Figures 2 and 6).
With milk maturation, there was a notable narrowing
of the true protein variance in preterm milk, from the
wide estimated 0 to 5.7 g/dL reference interval (+/− 2
standard deviations) in colostrum to the narrower mature milk estimated 0.6 to 1.4 g/dL at 12 weeks.
Discussion
Much has been written about the differences between
preterm and term breast milk, particularly about the nutritional superiority of preterm milk. This meta-analysis
revealed more similarities than differences between
preterm and term milk for energy, fat, oligosaccharides,
calcium, and phosphorus. Gestational age (preterm vs
term milk); postnatal age; protein estimation method
[true protein versus total nitrogen estimate] and energy
Gidrewicz and Fenton BMC Pediatrics 2014, 14:216
/>
Page 9 of 14
Table 6 Meta-analysis results of preterm and term breast milk mineral content over time
Preterm
Term
Preterm & term compared
Calcium (mg/dL)♦
Time frame:
mean
SD
n
mean
SD
n
% difference
p-value
d 1-3
25
9
50
26
6
26
−3
0.6
d 4-7
27
9
88
26
4
86
5
0.34
week 2
25
7
116
28
7
100
−10
0.002
week 3-4
25
6
108
27
5
85
−8
0.01
week 5-6
28
6
41
25
6
223
11
0.004
week 7-9
30
6
37
26
6
363
15
0.0002*
week 10-12
29
5
30
27
3
13
6
0.17
♦ References: [11-15,23,88,129,131,145,146]
Phosphate (mg/dL)♦♦
Time frame:
mean
SD
n
mean
SD
n
% difference
p-value
10
7
7
11
3
6
−14
0.62
d 1-3
d 4-7
13
4
79
13
4
86
3
0.50
week 2
15
3
67
15
4
90
−4
0.44
week 3-4
14
3
56
16
3
75
−14
0.0004*
week 5-6
13
2
33
16
3
213
−16
< 0.0001*
week 7-9
14
2
29
16
3
363
−13
0.002
week 10-12
12
2
22
14
3
13
−19
0.03
♦♦ References: [12,13,15,23,88,129,131,146]
*Statistically significant difference. In compensation for multiple comparisons, an approximate Bonferroni adjustment was made and the p-value for statistical
significance was < 0.001.
estimation method [measured versus calculated] were
each found to identify important differences in breast milk
content. Thus these factors should be considered when
estimating breast milk nutrient content and in designing
future studies to analyze breast milk nutrient content.
For energy, the differences between measured and calculated estimates of breast milk composition were only
significantly different at three time points for preterm
milk, however, the differences were as high as 10 kcal/dL
(13%), which are likely clinically important differences.
This data suggests that measured energy content of breast
milk is superior to calculated methods.
It is possible that errors in the calculation of energy
content of milk could be due to the various conversion
Table 7 The milk maturity effect: Comparison of colostrum versus mature milk
Energy (measured)
Colostrum
Mature milk
Difference
p-value
Protein (true protein)
Fat
Lactose
Preterm
Term
Preterm
Term
Preterm
Term
Preterm
Term
49
54
2.7
2.0
2.2
1.8
5.1
5.6
73
63
1.1
1.0
3.3
3.4
6.2
6.5
49%
16%
−61%
−52%
50%
93%
21%
16%
<0.00001*
<0.00001*
<0.00001*
<0.00001*
<0.00001*
<0.00001*
<0.00001*
<0.00001*
Calcium
Phosphate
Preterm
Term
Preterm
Term
Colostrum
25
26
9.5
11
Mature milk
29
26
12.8
16
Difference
13%
−2%
35%
41%
p-value
0.003
0.62
0.002
0.001
*met our approximate Bonferroni adjusted p-value criteria for statistical significance was < 0.001.
Colostrum was milk collected in the first 3 days, mature milk was collected between 5 to 12 weeks. The difference values less than 100% reflect lower values for
mature milk, differences greater than 100% reflect higher values for colostrum compared to mature milk.
Gidrewicz and Fenton BMC Pediatrics 2014, 14:216
/>
Figure 6 Lactose content distribution of preterm and term
breast milk by postnatal age over the first 12 weeks of
lactation, weighted mean and 95% reference interval. Preterm
milk …. Term milk —— : mean +/- 2 standard deviations.
factors used to calculate the energy contributions of the
macronutrients and also from assuming that all of the
nitrogen was protein [6,19,22] and that the only carbohydrate was lactose [6,19,121], which would contribute
to an over- and an under-estimation, respectively, of the
energy content of the milk [6].
The mean protein in early preterm milk was higher
than in term milk at some time points during the first
weeks, but also of importance, the variability of the protein content in preterm milk was twice that of term milk
at most time points. The decrease in protein content
and variance with postnatal age for preterm and term
milk were similar over time. Although the differences in
protein content between preterm and term milk were
statistically significant for several time points, the differences may be only likely of clinical importance in the
first few postnatal days. The meta-analysis revealed
that protein content of preterm early milk may be very low
in some mothers, based on the calculated reference intervals (mean +/− two (1.96) standard deviations, assuming
that the milk composition was not skewed) of 0 to 5.6 g/dl.
Figure 7 Oligosaccharide content distribution of preterm and
term breast milk oligosaccharide content in by postnatal age
over the first 12 weeks of lactation, weighted mean and 95%
reference interval. Preterm milk …. Term milk —— : mean +/- 2
standard deviations.
Page 10 of 14
Figure 8 Calcium content distribution of preterm and term
breast milk calcium content in by postnatal age over the first
12 weeks of lactation, weighted mean and 95% reference
interval. Preterm milk …. Term milk —— : mean +/- 2 standard
deviations.
However biological parameters often are skewed. Further
research is needed to describe the preterm milk protein distribution, range, and distribution symmetry.
The most dramatic changes from colostrum to mature
milk was the decrease in protein and increase in fat, in
both preterm and term milk, as well as the increase in
energy in preterm milk (Table 7). There is evidence that
the protein content of breast milk continues to decrease
over time after birth, as revealed by analyses of donor
breast milk reports that donated breast milk contains on
average 0.9 grams of protein per 100 mL [110,113,148].
One of these studies of donated milk assessed the milk
protein content at 8 months of postnatal age, and found
the protein was 0.7 g/dL [110]. These studies did not
meet our inclusion criteria since the milk from both
preterm and term delivering mothers were combined
[110,113,148].
Some researchers presented their estimates of breast
milk protein content based on the total nitrogen, assuming that all of the nitrogen represented protein [6,11-14,
18-23,120,122,123,125,128-135], some presented both protein estimates [11-14,18,128,129], while other researchers
reported only true protein estimates [11-14,18,19,121-123,
Figure 9 Phosphate content distribution of preterm and term
breast milk by postnatal age over the first 12 weeks of
lactation, weighted mean and 95% reference interval. Preterm
milk …. Term milk —— : mean +/- 2 standard deviations.
Gidrewicz and Fenton BMC Pediatrics 2014, 14:216
/>
127-129,136-139]. The protein meta-analysis estimates
based on total protein were almost uniformly higher than
the true protein estimates, which suggest that these two
approaches should not be averaged together. It has been
suggested that the higher protein content of colostrum
and early milk compared with later postnatal ages may not
be digestible since much of this early non-protein nitrogen
is non-digestible lactoferrin and IgA [128,149]. If some of
this “protein” is not digestible, then it would not be available to meet nutritional protein needs.
This study was limited by the availability of results
from the individual studies, and the various milk collection and analysis methods used. The minor undulations in the graphs may not represent real changes
in breast milk nutrient content, but be due to differences between the studies and their methods. Another
limitation was the limited sample sizes for some of
the analyses.
Conclusion
The protein content of breast milk decreases after birth
to be less than half of the colostrum content by 6 weeks.
Most of the differences in true protein between preterm
and term milk were within 0.2 g/dL, and by 3 months of
age, term milk may have the same protein content as
preterm milk. The four parameters assessed in this study
(postnatal age, gestational stage (preterm versus term),
protein estimated from nitrogen versus measured protein content, and energy calculated from macronutrients
versus measured using bomb calorimetry) were all found
to be important predictors of breast milk content.
This meta-analysis evidence revealed that breast milk
is highly variable between individuals. If breast milk energy macronutrient and mineral content cannot be directly analyzed for the individual mother and infant, the
average values from these meta-analyses may provide
useful estimates of the milk content.
For future research, our meta-analyses suggest that
breast milk energy content calculated from the macronutrients provide poor estimates of measured energy
and that protein estimated from the nitrogen overestimates the true protein milk content.
Competing interests
The authors declare that they have no competing interests.
Authors’ contributions
DG and TRF independently searched the literature, DG attempted to contact
authors when the data was not included in a form that could be extracted
from the papers, DG extracted the data; TRF checked the data for accuracy
and performed the meta-analyses. DG wrote the first draft of the paper and
both authors contributed to the analysis and writing of the manuscript.
Neither author has any conflicts of interest. All authors read and approved
the final manuscript.
Author details
1
Department of Pediatrics, University of Calgary, 2888 Shaganappi Trail NW,
Calgary, AB T3B 6A8, Canada. 2Nutrition Services, Alberta Health Services,
Page 11 of 14
Department of Community Health Sciences, Alberta Children’s Hospital
Research Institute, Faculty of Medicine, University of Calgary, 3rd Floor, 3280
Hospital Drive NW, Calgary, AB T2N 4Z6, Canada.
Received: 1 May 2014 Accepted: 22 August 2014
Published: 30 August 2014
References
1. American Academy of Pediatrics Section on Breastfeeding: Breastfeeding
and the use of human milk. Pediatrics 2012, 129(3):e827–e841.
2. The Canadian Paediatric Society Nutrition Committee: Exclusive
breastfeeding should continue to six months. Paediatrics Child Health
2005, 10(3):148.
3. Kramer MS, Kakuma R: Optimal duration of exclusive breastfeeding.
Cochrane Database Syst Rev 2002, 1:003517.
4. Agostoni C, Buonocore G, Carnielli VP, De Curtis M, Darmaun D, Decsi T,
Domellof M, Embleton ND, Fusch C, Genzel-Boroviczeny O, Goulet O,
Kalhan SC, Kolacek S, Koletzko B, Lapillonne A, Mihatsch W, Moreno L, Neu
J, Poindexter B, Puntis J, Putet G, Rigo J, Riskin A, Salle B, Sauer P, Shamir R,
Szajewska H, Thureen P, Turck D, van Goudoever JB, Ziegler EE, ESPGHAN
Committee on N: Enteral nutrient supply for preterm infants: commentary
from the European Society of Paediatric Gastroenterology, Hepatology
and Nutrition Committee on Nutrition. J Pediatric Gastroenterol Nutr 2010,
50(1):85–91.
5. Committee N, Canadian Paediatric Society: Nutrient needs and feeding of
premature infants. Can Med Assoc J 1995, 152(11):1765–1785.
6. Saarela T, Kokkonen J, Koivisto M: Macronutrient and energy contents of
human milk fractions during the first six months of lactation. Acta
Paediatr 2005, 94(9):1176–1181.
7. Khan S, Hepworth AR, Prime DK, Lai CT, Trengove NJ, Hartmann PE:
Variation in fat, lactose, and protein composition in breast milk over
24 hours: associations with infant feeding patterns. J Hum Lact 2013,
29(1):81–89.
8. Kociszewska-Najman B, Borek-Dzieciol B, Szpotanska-Sikorska M, Wilkos E,
Pietrzak B, Wielgos M: The creamatocrit, fat and energy concentration in
human milk produced by mothers of preterm and term infants. J Matern
Fetal Neonatal Med 2012, 25(9):1599–1602.
9. Lubetzky R, Littner Y, Mimouni FB, Dollberg S, Mandel D: Circadian
variations in fat content of expressed breast milk from mothers of
preterm infants. J Am Coll Nutr 2006, 25(2):151–154.
10. Nichols BL: Atwater and USDA nutrition research and service: a prologue
of the past century. J Nutr 1994, 124(9 Suppl):1718S–1727S.
11. Hibberd CM, Brooke OG, Carter ND, Haug M, Harzer G: Variation in the
composition of breast milk during the first 5 weeks of lactation:
implications for the feeding of preterm infants. Arch Dis Child 1982,
57(9):658–662.
12. Lemons JA, Moye L, Hall D, Simmons M: Differences in the composition
of preterm and term human milk during early lactation. Pediatr Res 1982,
16(2):113–117.
13. Butte NF, Garza C, Johnson CA, Smith EO, Nichols BL: Longitudinal changes
in milk composition of mothers delivering preterm and term infants.
Early Hum Dev 1984, 9(2):153–162.
14. Schanler RJ, Oh W: Composition of breast milk obtained from mothers
of premature infants as compared to breast milk obtained from donors.
J Pediatr 1980, 96(4):679–681.
15. Atkinson SA, Radde IC, Chance GW, Bryan MH, Anderson GH: Macromineral content of milk obtained during early lactation from mothers of
premature infants. Early Hum Dev 1980, 4(1):5–14.
16. United Nations: Composition of macro geographical (continental) regions,
geographical sub-regions, and selected economic and other groupings.
/>17. Stroup DF, Berlin JA, Morton SC, Olkin I, Williamson GD, Rennie D, Moher D,
Becker BJ, Sipe TA, Thacker SB SB: Meta-analysis of observational studies in
epidemiology: a proposal for reporting. Meta-analysis Of Observational
Studies in Epidemiology (MOOSE) group. JAMA 2000, 283(15):2008–2012.
18. Anderson DM, Williams FH, Merkatz RB, Schulman PK, Kerr DS, Pittard WB:
3rd, Length of gestation and nutritional composition of human milk.
Am J Clin Nutr 1983, 37(5):810–814.
19. Atkinson SA, Bryan MH, Anderson GH: Human milk feeding in premature
infants: protein, fat, and carbohydrate balances in the first two weeks of
life. J Pediatr 1981, 99(4):617–624.
Gidrewicz and Fenton BMC Pediatrics 2014, 14:216
/>
20. Corvaglia L, Battistini B, Paoletti V, Aceti A, Capretti MG, Faldella G: Near-infrared
reflectance analysis to evaluate the nitrogen and fat content of human
milk in neonatal intensive care units. Arch Dis Child Fetal Neonatal 2008,
93(5):F372–F375.
21. Ferris AM, Dotts MA, Clark RM, Ezrin M, Jensen RG: Macronutrients in
human milk at 2, 12, and 16 weeks postpartum. J Am Diet Assoc 1988,
88(6):694–697.
22. Maas YG, Gerritsen J, Hart AA, Hadders-Algra M, Ruijter JM, Tamminga P,
Mirmiran M, Spekreijse H: Development of macronutrient composition
of very preterm human milk. Br J Nutr 1998, 80(1):35–40.
23. Yamawaki N, Yamada M, Kan-no T, Kojima T, Kaneko T, Yonekubo A:
Macronutrient, mineral and trace element composition of breast milk
from Japanese women. J Trace Elem Med Biol 2005, 19(2–3):171–181.
24. Neville MC, Keller R, Seacat J, Lutes V, Neifert M, Casey C, Allen J, Archer P:
Studies in human lactation: milk volumes in lactating women during the
onset of lactation and full lactation. Am J Clin Nutr 1988, 48(6):1375–1386.
25. Ballard O, Morrow AL: Human milk composition: nutrients and bioactive
factors. Pediatr Clin North Am 2013, 60(1):49–74.
26. Baumgartner G: The composition of breast milk. Kinderkrankenschwester
2004, 23(6):232–234.
27. Bode L: Human milk oligosaccharides: every baby needs a sugar mama.
Glycobiology 2012, 22(9):1147–1162.
28. Bokor S, Koletzko B, Decsi T: Systematic review of fatty acid composition
of human milk from mothers of preterm compared to full-term infants.
Ann Nutr Metab 2007, 51(6):550–556.
29. Cockburn F: Milk composition–the infant human diet. Proc Nutr Soc 1983,
42(3):361–373.
30. Donovan SM: Human milk: Nutritional properties. In Nutrition in Pediatrics:
Basic Science and Clinical Applications. 4th edition. Edited by Duggan C,
Watkins JB, Walker WA. Hamilton, Ontario, Canada: BC Decker, Inc; 341–353.
Chapter 30.
31. Fomon SJ, Ziegler EE: Milk of the premature infant’s mother:
interpretation of data. J Pediatr 1978, 93(1):164.
32. Picciano MF: Nutrient composition of human milk. Pediatr Clin North Am
2001, 48(1):53–67.
33. Raiha NC: Milk protein quantity and quality and protein requirements
during development. Adv Pediatr 1989, 36:347–368.
34. Reali A, Greco F, Fanaro S, Atzei A, Puddu M, Moi M, Fanos V: Fortification
of maternal milk for very low birth weight (VLBW) pre-term neonates.
Early Hum Dev 2010, 86(Suppl 1):33–36.
35. Schanler RJ: Suitability of human milk for the low-birthweight infant.
Clin Perinatol 1995, 22(1):207–222.
36. Tudehope DI, Mitchell F, Cowley DM: A comparative study of a premature
infant formula and preterm breast milk for low birthweight infants.
Aust Paediatr J 1986, 22(3):199–205.
37. Davies DP: How suitable is human milk for pre-term babies? Acta Paediatr
Jpn 1989, 31(4):439–454.
38. Tudehope D, Vento M, Bhutta Z, Pachi P: Nutritional requirements and
feeding recommendations for small for gestational age infants. J Pediatr
2013, 162(3 Suppl):S81–S89.
39. Butte NF, Wong WW, Garza C, Stuff JE, Smith EO, Klein PD, Nichols BL:
Energy requirements of breast-fed infants. J Am Coll Nutr 1991,
10(3):190–195.
40. Aprile Mda M, Feferbaum R, Andreassa N, Leone C: Growth of very low
birth weight infants fed with milk from a human milk bank selected
according to the caloric and protein value. Clinics (Sao Paulo) 2010,
65(8):751–756.
41. Atinmo T, Omololu A: Trace element content of breastmilk from mothers
of preterm infants in Nigeria. Early Hum Dev 1982, 6(3):309–313.
42. Braga LP, Palhares DB: Effect of evaporation and pasteurization in the
biochemical and immunological composition of human milk. J Pediatr
(Rio J) 2007, 83(1):59–63.
43. Charpak N, Ruiz JG, KMC T: Breast milk composition in a cohort of
pre-term infants’ mothers followed in an ambulatory programme in
Colombia. Acta Paediatr 2007, 96(12):1755–1759.
44. Grumach AS, Jeronimo SE, Hage M, Carneiro-Sampaio MM: Nutritional
factors in milk from Brazilian mothers delivering small for gestational
age neonates. Rev Saude Publica 1993, 27(6):455–462.
45. Gupta AP, Bhandari B, Gupta A, Goyal S: Mineral content of breast milk
from north Indian mothers giving birth preterm and at term–implication
for mineral nutrition of preterm infants. J Trop Pediatr 1984, 30(5):286–288.
Page 12 of 14
46. Jitta JN, Musoke RN, Bwibo NO, Kioni J: Composition of early human milk
of Kenyan mothers of preterm and term infants. East Afr Med J 1986,
63(11):693–698.
47. Narang AP, Bains HS, Kansal S, Singh D: Serial composition of human milk
in preterm and term mothers. Indian J Clin Biochem 2006, 21(1):89–94.
48. Trugo NM, Donangelo CM, Koury JC, Silva MI, Freitas LA: Concentration and
distribution pattern of selected micronutrients in preterm and term milk
from urban Brazilian mothers during early lactation. Eur J Clin Nutr 1988,
42(6):497–507.
49. Anderson GH, Atkinson SA, Bryan MH: Energy and macronutrient content
of human milk during early lactation from mothers giving birth
prematurely and at term. Am J Clin Nutr 1981, 34(2):258–265.
50. Bauer J, Gerss J: Longitudinal analysis of macronutrients and minerals in
human milk produced by mothers of preterm infants. Clin Nutr 2011,
30(2):215–220.
51. Bertino E, Coppa GV, Giuliani F, Coscia A, Gabrielli O, Sabatino G, Sgarrella
M, Testa T, Zampini L, Fabris C: Effects of Holder pasteurization on human
milk oligosaccharides. Int J Immunopathol Pharmacol 2008, 21(2):381–385.
52. Boehm G, Springer S, Kirchner B: Consequences of the composition of
breast milk for the nutrition of underweight newborn infants. I. Calcium
and phosphorus. Kinderarztl Prax 1988, 56(9):429–435.
53. Boehm G, Springer S, Lorenz I, Muller DM, Beyreiss K: Consequences of
various protein contents in breast milk for the nutrition of the
underweight newborn infant. Kinderarztl Prax 1986, 54(1):25–30.
54. Boehm G, Springer S, Muller DM, Senger H: Consequences of the
composition of breast milk for the nutrition of underweight newborn
infants. II. Lipids and lactose. Kinderarztl Prax 1989, 57(9):443–450.
55. Davis TA, Nguyen HV, Garcia-Bravo R, Fiorotto ML, Jackson EM, Lewis DS,
Lee DR, Reeds PJ: Amino acid composition of human milk is not unique.
J Nutr 1994, 124(7):1126–1132.
56. Friel JK, Andrews WL, Jackson SE, Longerich HP, Mercer C, McDonald A,
Dawson B, Sutradhar B: Elemental composition of human milk from
mothers of premature and full-term infants during the first 3 months of
lactation. Biol Trace Elem Res 1999, 67(3):225–247.
57. Galeotti F, Coppa GV, Zampini L, Maccari F, Galeazzi T, Padella L, Santoro L,
Gabrielli O, Volpi N: On-line high-performance liquid chromatographyfluorescence detection-electrospray ionization-mass spectrometry
profiling of human milk oligosaccharides derivatized with 2-aminoacridone.
Anal Biochem 2012, 430(1):97–104.
58. Gross SJ, Geller J, Tomarelli RM: Composition of breast milk from mothers
of preterm infants. Pediatrics 1981, 68(4):490–493.
59. Simonin C, Ruegg M, Sidiropoulos D: Comparison of the fat content and
fat globule size distribution of breast milk from mothers delivering term
and preterm. Am J Clin Nutr 1984, 40(4):820–826.
60. Bishara R, Dunn MS, Merko SE, Darling P: Nutrient composition of hindmilk
produced by mothers of very low birth weight infants born at less than
28 weeks’ gestation. J Hum Lact 2008, 24(2):159–167.
61. Bortolozo EA, Tiboni EB, Candido LM: Milk from human milk banks for low
birthweight newborns: nutritional contents and supplementation.
Rev Panam Salud Publica 2004, 16(3):199–205.
62. de Halleux V, Rigo J: Variability in human milk composition: benefit of
individualized fortification in very-low-birth-weight infants. Am J Clin Nutr
2013, 98(2):529S–535S.
63. Genzel-Boroviczeny O, Wahle J, Koletzko B: Fatty acid composition of
human milk during the 1st month after term and preterm delivery.
Eur J Pediatr 1997, 156(2):142–147.
64. Harzer G, Haug M, Dieterich I, Gentner PR: Changing patterns of human
milk lipids in the course of the lactation and during the day. Am J Clin
Nutr 1983, 37(4):612–621.
65. Lonnerdal B, Woodhouse LR, Glazier C: Compartmentalization and
quantitation of protein in human milk. J Nutr 1987, 117(8):1385–1395.
66. Lucas A, Ewing G, Roberts SB, Coward WA: How much energy does the
breast fed infant consume and expend? Br Med J (Clin Res Ed) 1987,
295(6590):75–77.
67. Mitoulas LR, Kent JC, Cox DB, Owens RA, Sherriff JL, Hartmann PE: Variation
in fat, lactose and protein in human milk over 24 h and throughout the
first year of lactation. Br J Nutr 2002, 88(1):29–37.
68. Molto-Puigmarti C, Castellote AI, Carbonell-Estrany X, Lopez-Sabater MC:
Differences in fat content and fatty acid proportions among colostrum,
transitional, and mature milk from women delivering very preterm,
preterm, and term infants. Clin Nutr 2011, 30(1):116–123.
Gidrewicz and Fenton BMC Pediatrics 2014, 14:216
/>
69. Velona T, Abbiati L, Beretta B, Gaiaschi A, Flauto U, Tagliabue P, Galli CL,
Restani P: Protein profiles in breast milk from mothers delivering term
and preterm babies. Pediatr Res 1999, 45(5 Pt 1):658–663.
70. Bitman J, Wood L, Hamosh M, Hamosh P, Mehta NR: Comparison of the
lipid composition of breast milk from mothers of term and preterm
infants. Am J Clin Nutr 1983, 38(2):300–312.
71. de Figueiredo CS, Palhares DB, Melnikov P, Moura AJ, dos Santos SC:
Zinc and copper concentrations in human preterm milk. Biol Trace Elem
Res 2010, 136(1):1–7.
72. Aquilio E, Spagnoli R, Seri S, Bottone G, Spennati G: Trace element
content in human milk during lactation of preterm newborns. Biol Trace
Elem Res 1996, 51(1):63–70.
73. Arslanoglu S, Moro GE, Ziegler EE: The Wapm Working Group On,
Nutrition: Optimization of human milk fortification for preterm infants:
new concepts and recommendations. J Perinat Med 2010, 38(3):233–238.
74. Bao Y, Chen C, Newburg DS: Quantification of neutral human milk
oligosaccharides by graphitic carbon high-performance liquid
chromatography with tandem mass spectrometry. Anal Biochem 2013,
433(1):28–35.
75. Barros MD, Carneiro-Sompaio MM: Milk composition of low birth weight
infants’ mothers. Acta Paediatr Scand 1984, 73(5):693–694.
76. Bishara R, Dunn MS, Merko SE, Darling P: Volume of foremilk, hindmilk,
and total milk produced by mothers of very preterm infants born at less
than 28 weeks of gestation. J Hum Lact 2009, 25(3):272–279.
77. Boehm G, Senger H, Friedrich M, Muller DM, Beyreiss K: Protein
supplementation of human milk for the nutrition of VLBW-infants:
human milk protein vs. meat protein hydrolysate. Klin Padiatr 1990,
202(5):316–320.
78. Chan GM: Human milk calcium and phosphate levels of mothers
delivering term and preterm infants. J Pediatric Gastroenterol Nutr 1982,
1(2):201–205.
79. Charlwood J, Tolson D, Dwek M, Camilleri P: A detailed analysis of
neutral and acidic carbohydrates in human milk. Anal Biochem 1999,
273(2):261–277.
80. De Curtis M, Brooke OG: Energy and nitrogen balances in very low
birthweight infants. Arch Dis Child 1987, 62(8):830–832.
81. Funkquist EL, Tuvemo T, Jonsson B, Serenius F, Hedberg-Nyqvist K: Growth
and breastfeeding among low birth weight infants fed with or without
protein enrichment of human milk. Ups J Med Sci 2006, 111(1):97–108.
82. Fusch G, Choi A, Rochow N, Fusch C: Quantification of lactose content
in human and cow’s milk using UPLC-tandem mass spectrometry.
J Chromatogr B Analyt Technol Biomed Life Sci 2011, 879(31):3759–3762.
83. Hill PD, Aldag JC, Chatterton RT, Zinaman M: Comparison of milk output
between mothers of preterm and term infants: the first 6 weeks after
birth. J Hum Lact 2005, 21(1):22–30.
84. Lonnerdal B: Effects of milk and milk components on calcium,
magnesium, and trace element absorption during infancy. Physiol Rev
1997, 77(3):643–669.
85. Lucas A, Hudson GJ: Preterm milk as a source of protein for low
birthweight infants. Arch Dis Child 1984, 59(9):831–836.
86. Lyon AJ, McIntosh N: Calcium and phosphorus balance in extremely
low birthweight infants in the first six weeks of life. Arch Dis Child 1984,
59(12):1145–1150.
87. Manz F: Protein quantity and quality in term and preterm infants:
effects on urine creatinine and expression of amino acid excretion data.
J Pediatr Gastroenterol Nutr 1986, 5(5):830–831.
88. Mataloun MM, Leone CR: Human milk mineral intake and serum
concentrations of calcium and phosphorus in newborn term infants:
influence of intrauterine growth restriction. Acta Paediatr 2000,
89(9):1093–1097.
89. Meier PP, Engstrom JL, Murtaugh MA, Vasan U, Meier WA, Schanler RJ:
Mothers’ milk feedings in the neonatal intensive care unit: accuracy of
the creamatocrit technique. J Perinatol 2002, 22(8):646–649.
90. Meier PP, Engstrom JL, Zuleger JL, Motykowski JE, Vasan U, Meier WA,
Hartmann PE, Williams TM: Accuracy of a user-friendly centrifuge for
measuring creamatocrits on mothers’ milk in the clinical setting.
Breastfeed Med 2006, 1(2):79–87.
91. Moran JR, Vaughan R, Stroop S, Coy S, Johnston H, Greene HL:
Concentrations and total daily output of micronutrients in breast milk of
mothers delivering preterm: a longitudinal study. J Pediatric Gastroenterol
Nutr 1983, 2(4):629–634.
Page 13 of 14
92. Ogechi AA, William O, Fidelia BT: Hindmilk and weight gain in preterm
very low-birthweight infants. Pediatr Int 2007, 49(2):156–160.
93. O’Neill EF, Radmacher PG, Sparks B, Adamkin DH: Creamatocrit analysis of
human milk overestimates fat and energy content when compared to a
human milk analyzer using mid-infrared spectroscopy. J Pediatr
Gastroenterol Nutr 2013, 56(5):569–572.
94. Pamblanco M, Ten A, Comin J: Proteins in preterm and term milk from
mothers delivering appropriate or small-for-gestational age infants.
Early Hum Dev 1986, 14(3–4):267–272.
95. Polberger S, Lonnerdal B: Simple and rapid macronutrient analysis of
human milk for individualized fortification: basis for improved nutritional
management of very-low-birth-weight infants? J Pediatr Gastroenterol Nutr
1993, 17(3):283–290.
96. Svenningsen NW, Lindroth M, Lindquist B: A comparative study of varying
protein intake in low birthweight infant feeding. Acta Paediatr Scand
Suppl 1982, 296:28–31.
97. Unanian GS: Level of the trace elements copper, manganese, silicon,
aluminum and magnesium in the colostrum, intermediate and mature
milk of mothers of full-term and premature newborn infants. Zhurnal
Eksper i Klinicheskoi Med 1967, 7(6):96–99.
98. Wang CD, Chu PS, Mellen BG, Shenai JP: Creamatocrit and the nutrient
composition of human milk. J Perinatol 1999, 19(5):343–346.
99. Zofkova I, Taborsky P, Bednar J, Nedvidkova J: Lack of stimulating effect on
thyrotropic and lactotropic secretion during prolonged calcitriol
administration. Exp Clin Endocrinol 1992, 99(1):54–56.
100. Dai D, Tang Z: Copper, iron and zinc content of preterm and term human
milk and cow’s milk. Hua Xi Yi Ke Da Xue Xue Bao 1991, 22(4):428–431. Hua-Hsi
i Ko Ta Hsueh Hsueh Pao.
101. Kalhoff H, Manz F, Kiwull P, Kiwull-Schone H: Food mineral composition
and acid–base balance in preterm infants. Eur J Nutr 2007,
46(4):188–195.
102. Kovacs A, Funke S, Marosvolgyi T, Burus I, Decsi T: Fatty acids in early
human milk after preterm and full-term delivery. J Pediatric Gastroenterol
Nutr 2005, 41(4):454–459.
103. Raiha N: Quantity and quality of milk protein intake: metabolic responses
in the neonate. J Pediatr Gastroenterol Nutr 1983, 2(Suppl 1):S260–S265.
104. Reichman B, Chessex P, Verellen G, Putet G, Smith JM, Heim T, Swyer PR:
Dietary composition and macronutrient storage in preterm infants.
Pediatrics 1983, 72(3):322–328.
105. Sanchez-Hidalgo VM, Flores-Huerta S, Matute G, Serrano C, Urquieta B,
Espinosa R: Whey protein/casein ratio and nonprotein nitrogen in
preterm human milk during the first 10 days postpartum. J Pediatric
Gastroenterol Nutr 1998, 26(1):64–69.
106. Schanler RJ, Abrams SA: Postnatal attainment of intrauterine
macromineral accretion rates in low birth weight infants fed fortified
human milk. J Pediatr 1995, 126(3):441–447.
107. Wharton BA, Scott PH, Berger HM: Dietary protein for low birthweight
babies. Sources and assessment of requirements. Acta Paediatr Scand
Suppl 1982, 296:32–37.
108. Butte NF, Wong WW, Hopkinson JM, Heinz CJ, Mehta NR, Smith EO:
Energy requirements derived from total energy expenditure and
energy deposition during the first 2 y of life. Am J Clin Nutr 2000,
72(6):1558–1569.
109. de Bruin NC, Degenhart HJ, Gal S, Westerterp KR, Stijnen T, Visser HK:
Energy utilization and growth in breast-fed and formula-fed infants
measured prospectively during the first year of life. Am J Clin Nutr 1998,
67(5):885–896.
110. Michaelsen KF, Skafte L, Badsberg JH, Jorgensen M: Variation in
macronutrients in human bank milk: influencing factors and
implications for human milk banking. J Pediatric Gastroenterol Nutr 1990,
11(2):229–239.
111. Stein H, Cohen D, Herman AA, Rissik J, Ellis U, Bolton K, Pettifor J, MacDougall L:
Pooled pasteurized breast milk and untreated own mother’s milk in the
feeding of very low birth weight babies: a randomized controlled trial.
J Pediatr Gastroenterol Nutr 1986, 5(2):242–247.
112. Stellwagen LM, Vaucher YE, Chan CS, Montminy TD, Kim JH: Pooling
expressed breastmilk to provide a consistent feeding composition for
premature infants. Breastfeed Med 2013, 8:205–209.
113. Wojcik KY, Rechtman DJ, Lee ML, Montoya A, Medo ET: Macronutrient
analysis of a nationwide sample of donor breast milk. J Am Diet Assoc
2009, 109(1):137–140.
Gidrewicz and Fenton BMC Pediatrics 2014, 14:216
/>
114. Butte NF, Wong WW, Hopkinson JM: Energy requirements of lactating
women derived from doubly labeled water and milk energy output.
J Nutr 2001, 131(1):53–58.
115. Heinig MJ, Nommsen LA, Peerson JM, Lonnerdal B, Dewey KG: Energy and
protein intakes of breast-fed and formula-fed infants during the first
year of life and their association with growth velocity: the DARLING
Study. Am J Clin Nutr 1993, 58(2):152–161.
116. Stuff JE, Nichols BL: Nutrient intake and growth performance of older
infants fed human milk. J Pediatr 1989, 115(6):959–968.
117. Brooke O, Carter N, Hibberd C, Wood C, Brown I: Protein concentrations in
milk from mothers of preterm and term infants. Biochem Soc Trans 1981,
9(1):69–70.
118. Leveque B: Composition of maternal milk in the first month of lactation
and milk formulas for infants. Ann Pediatr (Paris) 1986, 33(4):355–358.
119. Sadurskis A, Kabir N, Wager J, Forsum E: Energy metabolism, body
composition, and milk production in healthy Swedish women during
lactation. Am J Clin Nutr 1988, 48(1):44–49.
120. Lepage G, Collet S, Bougle D, Kien LC, Lepage D, Dallaire L, Darling P, Roy
CC: The composition of preterm milk in relation to the degree of
prematurity. Am J Clin Nutr 1984, 40(5):1042–1049.
121. Thomas MR, Chan GM, Book LS: Comparison of macronutrient
concentration of preterm human milk between two milk expression
techniques and two techniques for quantitation of energy. J Pediatric
Gastroenterol Nutr 1986, 5(4):597–601.
122. Butte NF, Garza C, Stuff JE, Smith EO, Nichols BL: Effect of maternal diet
and body composition on lactational performance. Am J Clin Nutr 1984,
39(2):296–306.
123. Butte NF, Wong WW, Ferlic L, Smith EO, Klein PD, Garza C: Energy
expenditure and deposition of breast-fed and formula-fed infants during
early infancy. Pediatr Res 1990, 28(6):631–640.
124. Garza C, Butte NF: Energy concentration of human milk estimated from
24-h pools and various abbreviated sampling schemes. J Pediatr
Gastroenterol Nutr 1986, 5(6):943–948.
125. Motil KJ, Sheng HP, Montandon CM, Wong WW: Human milk protein does
not limit growth of breast-fed infants. J Pediatr Gastroenterol Nutr 1997,
24(1):10–17.
126. Wood CS, Isaacs PC, Jensen M, Hilton HG: Exclusively breast-fed infants:
growth and caloric intake. Pediatr Nurs 1988, 14(2):117–124.
127. Nommsen LA, Lovelady CA, Heinig MJ, Lonnerdal B, Dewey KG:
Determinants of energy, protein, lipid, and lactose concentrations in
human milk during the first 12 mo of lactation: the DARLING Study.
Am J Clin Nutr 1991, 53(2):457–465.
128. Beijers RJ, Graaf FV, Schaafsma A, Siemensma AD: Composition of
premature breast-milk during lactation: constant digestible protein
content (as in full term milk). Early Hum Dev 1992, 29(1–3):351–356.
129. Itabashi K, Miura A, Okuyama K, Takeuchi T, Kitazawa S: Estimated
nutritional intake based on the reference growth curves for extremely
low birthweight infants. Pediatr Int 1999, 41(1):70–77.
130. Arnold J, Leslie G, Chen S: Protein, lactose and fat concentration of breast
milk of mothers of term and premature neonates. Aust Paediatr J 1987,
23(5):299–300.
131. Gross SJ, David RJ, Bauman L, Tomarelli RM: Nutritional composition of milk
produced by mothers delivering preterm. J Pediatr 1980, 96(4):641–644.
132. Reinken L, Dockx F: Vitamin B6- and protein concentrations in breast
milk from mothers of preterm and term infants. Klin Padiatr 1985,
197(1):40–43.
133. Faerk J, Skafte L, Petersen S, Peitersen B, Michaelsen KF: Macronutrients in
milk from mothers delivering preterm. Adv Exp Med Biol 2001, 501:409–413.
134. Hosoi S, Honma K, Daimatsu T, Kiyokawa M, Aikawa T, Watanabe S: Lower
energy content of human milk than calculated using conversion factors.
Pediatr Int 2005, 47(1):7–9.
135. Cregan MD, De Mello TR, Kershaw D, McDougall K, Hartmann PE: Initiation
of lactation in women after preterm delivery. Acta Obstet Gynecol Scand
2002, 81(9):870–877.
136. Montagne P, Cuilliere ML, Mole C, Bene MC, Faure G: Immunological and
nutritional composition of human milk in relation to prematurity and
mother’s parity during the first 2 weeks of lactation. J Pediatric
Gastroenterol Nutr 1999, 29(1):75–80.
137. Britton JR: Milk protein quality in mothers delivering prematurely: implications
for infants in the intensive care unit nursery setting. J Pediatric Gastroenterol
Nutr 1986, 5(1):116–121.
Page 14 of 14
138. Sanchez-Pozo A, Lopez J, Pita ML, Izquierdo A, Guerrero E, Sanchez-Medina F,
Martinez Valverde A, Gil A: Changes in the protein fractions of human milk
during lactation. Ann Nutr Metab 1986, 30(1):15–20.
139. Michaelsen KF, Larsen PS, Thomsen BL, Samuelson G: The Copenhagen
cohort study on infant nutrition and growth: duration of breast feeding
and influencing factors. Acta Paediatr 1994, 83(6):565–571.
140. Coppa GV, Gabrielli O, Pierani P, Catassi C, Carlucci A, Giorgi PL: Changes in
carbohydrate composition in human milk over 4 months of lactation.
Pediatrics 1993, 91(3):637–641.
141. Coppa GV, Pierani P, Zampini L, Gabrielli O, Carlucci A, Catassi C, Giorgi PL:
Lactose, oligosaccharide and monosaccharide content of milk from
mothers delivering preterm newborns over the first month of lactation.
Minerva Pediatr 1997, 49(10):471–475.
142. Ehrenkranz RA, Ackerman BA, Nelli CM: Total lipid content and fatty acid
composition of preterm human milk. J Pediatric Gastroenterol Nutr 1984,
3(5):755–758.
143. Gabrielli O, Zampini L, Galeazzi T, Padella L, Santoro L, Peila C, Giuliani F,
Bertino E, Fabris C, Coppa GV: Preterm milk oligosaccharides during the
first month of lactation. Pediatrics 2011, 128(6):e1520–e1531.
144. Guerrini P, Bosi G, Chierici R, Fabbri A: Human milk: relationship of fat
content with gestational age. Early Hum Dev 1981, 5(2):187–194.
145. Hurgoiu V, Caseanu E: Mineral composition of the milk of mothers of
premature infants during early lactation. Pediatrie 1986, 41(6):469–473.
146. Sann L, Bienvenu F, Lahet C, Bienvenu J, Bethenod M: Comparison of the
composition of breast milk from mothers of term and preterm infants.
Acta Paediatr Scand 1981, 70(1):115–116.
147. Viverge D, Grimmonprez L, Cassanas G, Bardet L, Solere M: Variations in
oligosaccharides and lactose in human milk during the first week of
lactation. J Pediatr Gastroenterol Nutr 1990, 11(3):361–364.
148. Valentine CJ, Fernandez S, Rogers LK, Gulati P, Hayes J, Lore P, Puthoff T,
Dumm M, Jones A, Collins K, Curtiss J, Hutson K, Clark K, Welty SE: Early
amino-acid administration improves preterm infant weight. J Perinatol
2009, 29(6):428–432.
149. Donovan SM, Atkinson SA, Whyte RK, Lonnerdal B: Partition of nitrogen
intake and excretion in low-birth-weight infants. Am J Dis Child 1989,
143(12):1485–1491.
doi:10.1186/1471-2431-14-216
Cite this article as: Gidrewicz and Fenton: A systematic review and
meta-analysis of the nutrient content of preterm and term breast milk.
BMC Pediatrics 2014 14:216.
Submit your next manuscript to BioMed Central
and take full advantage of:
• Convenient online submission
• Thorough peer review
• No space constraints or color figure charges
• Immediate publication on acceptance
• Inclusion in PubMed, CAS, Scopus and Google Scholar
• Research which is freely available for redistribution
Submit your manuscript at
www.biomedcentral.com/submit