Risk factors for recurrent injuries in victims of suspected non-accidental trauma: A retrospective cohort study
Bạn đang xem bản rút gọn của tài liệu. Xem và tải ngay bản đầy đủ của tài liệu tại đây (762.94 KB, 10 trang )
Deans et al. BMC Pediatrics 2014, 14:217
/>
RESEARCH ARTICLE
Open Access
Risk factors for recurrent injuries in victims of
suspected non-accidental trauma: a retrospective
cohort study
Katherine J Deans1,2,3*, Jonathan Thackeray3, Jonathan I Groner2, Jennifer N Cooper1 and Peter C Minneci1,2
Abstract
Background: Many children who are victims of non-accidental trauma (NAT) may be repeatedly evaluated for injuries
related to maltreatment. The purpose of this study was to identify risk factors for repeated injuries in children with
suspected NAT.
Methods: We conducted a retrospective cohort study using claims data from a pediatric Medicaid accountable care
organization. Children with birth claims and at least one non-birth related claim indicating a diagnosis of NAT or skeletal
survey in 2007–2011 were included. Recurrent events were defined as independent episodes of care involving an
urgent/emergent care setting that included a diagnosis code specific for child abuse, a CPT code for a skeletal
survey, or a diagnosis code for an injury suspicious for abuse. Cox proportional hazards models were used to
examine risk factors for recurrent events.
Results: Of the 1,361 children with suspected NAT, a recurrent NAT event occurred in 26% within 1 year and
40% within 2 years of their initial event. Independent risk factors for a recurrent NAT event included a rural
residence, age < 30 months old, having only 1 or 2 initially detected injuries, and having a dislocation, open
wound, or superficial injury at the previous event (p ≤ 0.01 for all).
Conclusions: Over 25% of children who experienced a suspected NAT event had a recurrent episode within one
year. These children were younger and more likely to present with “minor” injuries at their previous event.
Keywords: Non-accidental trauma, Child abuse, Injury, Recurrence
Background
Non-accidental trauma (NAT) is a leading cause of injury and death throughout early childhood [1,2]. Repeated evaluations in the medical setting for traumatic
injuries should raise concerns that these injuries may be
caused by either negligent behavior on the part of the
caretaker or by recurrent intentional mechanisms.
Rates of recurrent non-accidental traumatic injuries
have been reported to be as high as 30-50%, and are associated with increased morbidity and mortality [3-8].
Previously reported predictors of recurrent NAT include
prior child protective services involvement, history of
* Correspondence:
1
Center for Surgical Outcomes Research and Center for Innovation in
Pediatric Practice, The Research Institute at Nationwide Children’s Hospital,
700 Childrens Drive, JWest - 4th floor, Columbus, OH 43205, USA
2
Department of Surgery, Nationwide Children’s Hospital, Columbus, OH, USA
Full list of author information is available at the end of the article
domestic violence, chronicity of maltreatment, child’s age,
parental history of maltreatment as a child, and parental
substance abuse, criminal record, and mental health issues, or after specific injuries [5,6,9-13]. These previous
studies are limited in that they either do not assess risk
factors related specifically to trauma, such as sentinel traumatic events, or they do not address recurrence of maltreatment. The purpose of this study was to identify
patterns of injuries and factors associated with suspected
episodes of recurrent NAT in a cohort of young children
enrolled in a Medicaid managed care program who had at
least one highly suspicious encounter for NAT.
Methods
Data source
Partners for Kids (PFK) is Nationwide Children’s Hospital’s
pediatric accountable care organization. PFK contracts
© 2014 Deans et al.; licensee BioMed Central Ltd. This is an Open Access article distributed under the terms of the Creative
Commons Attribution License ( which permits unrestricted use, distribution, and
reproduction in any medium, provided the original work is properly credited. The Creative Commons Public Domain
Dedication waiver ( applies to the data made available in this article,
unless otherwise stated.
Deans et al. BMC Pediatrics 2014, 14:217
/>
with the Medicaid Managed Care Organizations in Central
and Southeastern Ohio to manage the care of almost
300,000 children across 37 counties, from urban Columbus
to rural Appalachia. At the time of this study, over 2,000
physicians were submitting claims to PFK. The PFK claims
database includes information on all billable medical care,
procedures, and encounters for its enrollees, allowing for
tracking of patients over time, across institutions, and
across both inpatient and outpatient encounters. Access to
this claims database is available to researchers at our institution, though is not freely available to individuals outside
of our institution, and was granted by the PFK accountable
care organization.
Study population
This study used enrollment data and facility and professional claims data from January 2007 to December 2011
for children born during this time period. We identified
all children with a birth record claim who also had at
least one claim indicating a diagnosis of abuse (physical,
emotional, or neglect) or a skeletal survey at a non-birth
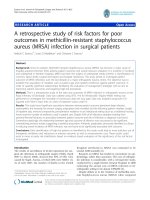
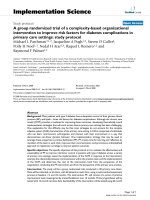
related episode of care. (Figure 1) Suspected NAT events
were defined as episodes of care in which a claim contained either (a) an International Classification of Diseases, Ninth Revision, Clinical Modification (ICD-9-CM)
discharge diagnosis code specific for child abuse, (b) a
Current Procedural Terminology (CPT) coded skeletal
survey, or (c) ICD-9 coded injuries suspicious for abuse;
these events could be the event that brought the child
into the study cohort, or they could occur either before
or after that event. We excluded events that had an
ICD-9 E-code for a trauma mechanism that could explain the injury or an ICD-9 code for an underlying
medical illness that could explain the injury or need for
skeletal survey. Episodes of care coded as follow-up care
were excluded. Episodes of care with only a diagnosis of
minor cutaneous injury from a specific mechanism and
no other codes indicative of suspected NAT were also
excluded. In order to include all claims for care related
to a single incident of suspected NAT, an episode of care
encompassed all claims for service provided concurrently or within two days of the care documented in the
claim. In order to minimize the risk of defining claims
for follow-up care as new events, only episodes of care
that included encounters in the emergency department,
urgent care, or inpatient setting were considered for inclusion as recurrent events. Figure 1 outlines cohort development and includes all ICD-9 and CPT codes used
to define the cohort and events.
Independent variables
Variables determined at the time of each event included
age, sex, days since last event, the presence of symptoms
or diseases of the respiratory system, digestive system,
Page 2 of 10
nervous system and sense organs, skin and subcutaneous
tissue, endocrine, nutritional, metabolic, or immunity
disorders, vaccination during the episode of care, location, type, and mechanism of injuries, number of injuries, injury severity (evaluated as the probability of death
based on the trauma mortality prediction model, TMPMICD9) [14,15], and death during the episode of care. The
type and mechanism of injury were defined using ICD-9
diagnosis codes and E-codes respectively. The location of
each injury was categorized into one of six body regions
based on the Abbreviated Injury Scale [16]. The number
of injuries was defined as the number of unique injury
diagnosis codes listed during the episode of care of the
event. Because family socioeconomic status (SES) indicators were not available, zip code level SES variables (median household family income, percentage of
the population over age 25 with a Bachelor’s degree or
higher) and urban vs. rural residence were determined
from the 2000 U.S. Census based on each child’s zip code
at their first event [17]. Enrollment duration in months
and enrollment continuity were determined for each
child. Other independent variables were determined according to their presence on any claim submitted prior to
the suspected NAT event including musculoskeletal disease, congenital anomalies, and prematurity.
Statistical analysis
Characteristics at each suspected NAT event and in children with and without recurrent events were summarized
using descriptive statistics (medians and inter-quartile
ranges (IQR) or frequencies and percentages). KaplanMeier curves were used to display the proportion of
children with recurrent events over time after the initial
event. To determine risk factors for recurrent events,
we used an extension of the Cox proportional hazards
model for recurrent event data, the Prentice, Williams
and Peterson gap time (PWP-GT) model [18]. Events
beyond the fifth event were not included due to their
insufficient number for analysis. Predictor variables in
these models were the independent variables as measured at the previous suspected NAT event, with the
exception of the zip code based variables, which were
determined at the first event only. The reported hazard ratios (HR) estimate the relative hazard rates of
having an event in those with and without the characteristic being examined.
For the examination of multivariable associations between the predictors and the time to the next suspected
NAT event, Cox proportional hazards PWP-GT recurrent event models were used. All variables with bivariate
associations significant at p < 0.20 were included with
subsequent variable elimination until all remaining
variables had p < 0.10. The final multivariable model
revealed the overall associations of factors measured
Deans et al. BMC Pediatrics 2014, 14:217
/>
Page 3 of 10
Figure 1 Determination of Study Population.
at any particular event with the risk of a subsequent suspected NAT event, after adjustment for other measured
risk factors. We included all children regardless of
their duration of follow-up in our analyses in order to
minimize selection bias; in all of the survival analyses
performed, children were included in the pool of patients
at risk for subsequent events from the time of their initial
event until the end of their last month of enrollment
in PFK during the study period. Subsequently, several
sensitivity analyses were performed to evaluate how
the inclusion of patients with short follow-up, discontinuous follow-up, or without birth records in the
database affected the results. The sensitivity analyses
involved repeating the multivariable modeling excluding those children who did not maintain continuous
enrollment in PFK, then excluding those children with
less than 60 days of follow-up after their first event,
and finally performing the analyses in those children
who did not have birth records in the PFK database. All
statistical analyses were performed using SAS (Statistical
Analysis Software v9.3, Cary, NC). The conduct of this
study was approved by Nationwide Children’s Hospital
Institutional Research Board with a waiver of informed
consent. This research study has adhered to the STROBE
guidelines for observational studies as outlined at http://
www.strobe-statement.org. Additional file 1.
Results
Identification of cohort
Of the 140,828 children born and enrolled in PFK from
2007–2011, 2,362 had a claim with either a diagnosis of
child maltreatment or a skeletal survey. Sixty-one percent of these children (n = 1,434) had birth records in
the PFK database. After removing events with diagnosis
codes for a medical illness or trauma mechanism that
could potentially explain the injuries, the cohort was further refined to 1,361 children who were included in the
main analysis (Figure 1).
Deans et al. BMC Pediatrics 2014, 14:217
/>
Frequency of recidivism
Three hundred and seventy-three (27.4%) patients in our
cohort had more than one episode of care for a suspected NAT event during the study period (Table 1).
The incidence of suspected NAT events in the total cohort was 49 events per 1000 person-months. Two hundred and sixty-one children had 2 events, 74 children
had 3 events, 22 children had 4 events, 13 children had
5 events, and 3 children had 6 events during the study
period. Of all of these events, 51% had documentation of
a skeletal survey, 35% had an abuse diagnosis, and 65%
had an injury. Thirty percent of all events had only
injuries, with no evidence of a skeletal survey or abuse
diagnosis; at these events, the most common injuries
were open wounds (32%) and contusions (27%). These
potentially accidental injuries equated to an injury rate
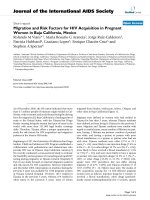
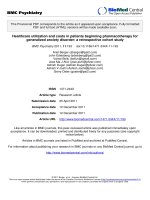
of 177/1000 person-years. Based on Kaplan-Meier analysis, 26% of the children had ≥1 recurrent event within
1 year of their initial event and 40% had ≥1 recurrence
within 2 years of their initial event. The time between
events decreased significantly with each subsequent
event (Figure 2, p < 0.0001). It is important to note that
the duration of follow-up after the initial event widely
varied (median (IQR) 383 days (145, 773)). However, the
finding of significantly decreased time between events
with increasing event number held in the subsample of
476 children with at least 600 days of follow-up after
their first event (p = 0.005).
Demographics, comorbidities and injury characteristics of
patient population
Characteristics and injuries of the children with a single
event were compared to children with recurrent events
(Table 1). Among those children with multiple events
during the time they remained in PFK, the median time
between the first and second events was 191 days (IQR
69, 389). The median probability of death, according to
the trauma mortality prediction model (TMPM-ICD9),
was higher at the first event (3.1%) than at subsequent
events (<2% for all).
Page 4 of 10
likely to have a subsequent event, whereas children with
3 or more injuries were not at increased risk for another
event compared to children with no injury diagnoses.
The most common body locations of dislocations, open
wounds, and superficial injuries at the initial event among
children with suspected recurrent NAT events were as follows: 14 of 15 (93%) children with dislocations had elbow
dislocations, 26 of 45 (58%) children with open wounds
had open wounds of the face, nose, or mouth, and 28 of
59 (47%) children with superficial injuries had superficial
injuries of the face, neck, or scalp.
Sensitivity analyses
These analyses were repeated in the subgroup of children who maintained continuous enrollment in PFK
from their birth until the end of 2011 (n = 891, 65.5%).
The results were similar, with the addition of injuries
due to a fall now becoming a significant independent
predictor of an increased risk of suspected recurrent
NAT events in multivariable modeling (HR 1.42, 95% CI
1.07-1.88, p = 0.02). In order to account for potential
selection bias due to informative censoring caused by
the removal of children from their home after abuse, the
analyses were repeated in only those children followed
for at least 60 days after their first event. All results were
similar. Finally, all analyses were also repeated in those
children who did not have birth records in the PFK database. Compared to children with birth records in PFK,
children without birth records tended to be older and to
live in a zip code with a slightly higher median family income at their first event documented in PFK (Table 3).
Because of these differences and the likelihood that suspected NAT events were missed in children who entered
into PFK after birth, these children were not included in
the main analyses. There were several differences in the
final multivariable models between those with and without
birth records in PFK. Specifically, in addition to the risk
factors previously identified, children who had a musculoskeletal disease (HR 1.42, 95% CI 1.03-1.92, p = 0.03) or a
congenital anomaly (HR 1.44, 95% CI 1.04-2.00, p = 0.03)
were more likely to experience a subsequent event.
Risk of recidivism
Results of univariate comparisons of demographics, comorbidities and injuries between children with a single
event and children with recurrent events are shown
in Table 1. Factors independently associated with the
risk of suspected recurrent NAT based on multivariable
modeling are shown in Table 2. Living in a rural area
and being less than 30 months of age at any event were
associated with a higher risk of having a subsequent
event (Table 2). Having a dislocation, open wound, or
superficial injury (p ≤ 0.01 for all) was associated with an
increased risk of having a subsequent event. In addition,
children who had 1–2 injuries at any event were more
Discussion
Many children who are victims of NAT may not experience it as a single isolated event, but rather as part of a
pattern of recurrent violence that represents the normative structure of their social environment. This study
used administrative claims data from a pediatric Medicaid
accountable care organization to identify children with repeated medical encounters for injuries that are suspicious
for NAT. We have identified several demographic and injury characteristics that are associated with an increased
risk for suspected recurrent NAT events. These include living in a rural area, younger age at an event, fewer injuries
Deans et al. BMC Pediatrics 2014, 14:217
/>
Page 5 of 10
Table 1 Demographics, comorbidities, and injury characteristics at first event in children with and without recurrent events
Characteristic (Total N = 1361)
No suspected recurrent
NAT events, (N = 988)
Suspected recurrent
NAT events, (N = 373)
Hazard ratio
(95% CI)
P***
Male
492 (49.8)
207 (55.5)
1.15
0.97
1.36
0.10
Lives in urban area*
760 (77.6)
266 (71.3)
0.71
0.59
0.86
<0.001
0-6
298 (30.2)
123 (33.0)
ref
6-12
187 (18.9)
81 (21.7)
0.88
0.68
1.15
12-18
168 (17.0)
80 (21.5)
1.10
0.85
1.41
18-24
120 (12.2)
44 (11.8)
1.06
0.79
1.41
Age in months
24-30
>30
0.03
77 (7.8)
28 (7.5)
1.04
0.75
1.45
138 (14.0)
17 (4.6)
0.62
0.42
0.90
234 (23.7)
81 (21.7)
0.903
0.722
1.13
0.37
19 (1.9)
15 (4.0)
1.751
1.17
2.621
0.007
Injury type, N (%)
Fracture
Dislocation
Burn
49 (5.0)
21 (5.6)
0.985
0.676
1.435
0.94
Retinal hemorrhage
30 (3.0)
11 (3.0)
1.575
0.838
2.96
0.16
Intracranial
67 (6.8)
20 (5.4)
0.938
0.617
1.426
0.76
Abdominal thoracic
17 (1.7)
4 (1.1)
0.707
0.302
1.655
0.42
Open wound
59 (6.0)
45 (12.1)
1.564
1.243
1.968
0.001
<0.001
Superficial Injuries
55 (5.6)
59 (15.8)
1.616
1.266
2.063
Contusions
176 (17.8)
93 (24.9)
1.195
0.972
1.469
0.09
Spinal cord
6 (0.6)
1 (0.3)
0.899
0.223
3.614
0.88
192 (19.4)
83 (22.3)
0.996
0.806
1.232
0.97
40 (4.1)
24 (6.4)
1.468
1.051
2.051
0.02
Chest
52 (5.3)
12 (3.2)
0.723
0.448
1.166
0.18
Abdomen and pelvic contents
40 (4.1)
9 (2.4)
0.748
0.452
1.24
0.26
Location of injury, N (%)
Head/neck
Face
Extremities or pelvic girdle
238 (24.1)
99 (26.5)
1.149
0.948
1.391
0.16
External
370 (37.5)
178 (47.7)
1.221
1.013
1.472
0.04
Mechanism of injury, N (%)
Cut/pierce
4 (0.4)
2 (0.5)
1.335
0.673
2.648
0.41
160 (16.2)
63 (16.9)
1.238
0.992
1.543
0.06
35 (3.5)
12 (3.2)
0.958
0.618
1.485
0.85
Natural/environmental
9 (0.9)
3 (0.8)
0.829
0.361
1.906
0.66
Poisoning
14 (1.3)
3 (0.8)
0.95
0.33
2.733
0.92
Struck by/against
43 (4.4)
20 (5.4)
1.021
0.704
1.482
0.91
0
387 (39.2)
86 (23.1)
ref
1
182 (18.4)
115 (30.8)
1.803
1.435
2.265
2
140 (14.2)
85 (22.8)
1.594
1.231
2.063
3
63 (6.4)
31 (8.3)
1.378
0.953
1.992
4
59 (6.0)
16 (4.3)
1.103
0.689
1.766
157 (15.9)
40 (10.7)
1.161
0.841
1.601
0.046 (0.013, 0.107)
0.023 (0.010, 0.069)
0.478
0.104
2.194
Fall
Fire/Burn
Number of injuries, N (%)
≥5
Injury Severity (TMPM-ICD9 probability of death)**,
median (IQR)
<0.001
0.34
Characteristics shown were determined at the first event. *Based on the child's zip code at their first event and on data from the 2000 Census. **TMPM-ICD9 = trauma
mortality prediction model, Group without recurrent event(s): N = 502, Group with recurrent event(s): N = 193. ***P value in a univariable Cox proportional hazards Prentice,
Williams and Peterson gap time (PWP-GT) model for time between events. The first four recurrent events were included in the models. Values of the risk factors at the
previous event were the independent variables in this model, with the exception of the zip code based variables, which were determined only at the first event.
Deans et al. BMC Pediatrics 2014, 14:217
/>
Page 6 of 10
Figure 2 Kaplan-Meier failure curves for time between recurrent events. The percent of at risk patients that have a recurrent event (y-axis)
over time since their previous event (x-axis) is displayed. For example, all patients with a first event are at risk for a 1st recurrence (solid black line).
At 1 year after their first event, 26% of these children have had a 1st recurrence. The time between events significantly decreased with each
increasing event number (p < 0.0001; derived from a Wald test of event number (modeled as an ordinal variable) in a Prentice, Williams and
Peterson gap time (PWP-GT) Cox proportional hazards model for time between events).
Table 2 Multivariable Cox Proportional Hazards model
for recurrent events
Variable
Hazard
ratio
95% CI
P
Lives in a rural area (Non-MSA vs. MSA)*
1.37
1.14
1.67
0.001
Age ≤30 months vs. >30 months
1.67
1.20
2.33
0.002
Dislocation
1.77
1.15
2.72
0.01
Open wound
1.54
1.22
1.94
<0.001
Superficial injury
1.50
1.17
1.92
0.002
Number of injuries
1-2 vs. 0 injuries
1.85
1.42
2.40
<0.001
≥ 3 vs. 0 injuries
1.03
0.74
1.43
0.86
Results are from a Cox proportional hazards Prentice, Williams and
Peterson gap time (PWP-GT) model for time between events. Values of the
risk factors at the previous event were the independent variables, with the
exception of the zip code based variables, which were determined only at
the first event. The global p-values for differences among age groups (0–6,
6–12, 12–18, 18–24, 24–30, and >30 months) and number of injuries (0, 1,
2, 3, 4, ≥5) were significant at p < 0.05, so these categories were collapsed
into the smallest number of categories showing statistically significantly
different associations with the outcome after adjustment for multiple
comparisons using Fisher’s least significant difference test. *Based on the
child's zip code at their first event. MSA = metropolitan statistical area
(urban area).
at an initial event, and specific injury categories including
dislocations, superficial injuries, and open wounds. In
addition, suspected recurrent NAT events were often observed months after the initial event and the time to a next
event decreased with each subsequent event.
Missing child abuse at initial presentation can lead to
significant subsequent morbidity [6,19]. With regards to
NAT related to TBI, 30% of children hospitalized with
abusive head injuries had a sentinel injury [12]. Data from
our group using the Ohio State Trauma Registry suggests
that victims of recurrent NAT who are hospitalized for
their injuries have higher mortality rates compared to victims of single episodes of NAT (25% vs. 10%) [8]. By gaining a better understanding of the types and timing of
injuries that portend risk to a child for recurrent NAT, we
may be able to develop targeted screening tools and appropriate interventions that can be used to prevent recurrent NAT and its associated morbidity and mortality.
Previously identified risk factors for recurrent NAT
include prior child protective services involvement, chronicity of maltreatment, child’s age, and parental history
including domestic violence, substance abuse, criminal
Deans et al. BMC Pediatrics 2014, 14:217
/>
Page 7 of 10
Table 3 Differences between children with and without birth records in PFK
Children with birth records in
PFK database (N = 1361)
Children without birth records in
PFK database (N = 898)
P
Male
699 (51.4)
448 (49.9)
0.49
Lives in urban area*
1026 (75.8)
689 (77.0)
0.53
Characteristic
Musculoskeletal disease
166 (12.2)
72 (8.0)
0.002
Congenital anomaly
272 (20.0)
84 (9.4)
<.0001
Person-months at end of study
29 (17, 40)
26 (14, 37)
0.0002
<.0001
Age
0-6 months
421 (30.9)
120 (13.4)
6-12 months
268 (19.7)
131 (14.6)
12-18 months
248 (18.2)
180 (20.0)
18-24 months
164 (12.1)
132 (14.7)
24-30 months
105 (7.7)
113 (12.6)
> 30 months
155 (11.4)
222 (24.7)
488 (35.9)
302 (33.6)
Enrollment continuity at end of study)
Continuous enrollment ≥ 24 months
Continuous enrollment < 24 months
403 (29.6)
283 (31.5)
Discontinuous enrollment ≥ 24 months
351 (25.8)
211 (23.5)
Discontinuous enrollment < 24 months
119 (8.7)
102 (11.4)
0.10
Enrollment breaks over the course of the study
No break in enrollment
891 (65.5)
585 (65.1)
One break
331 (24.3)
220 (24.5)
0.41
More than one break (range = 2-5 breaks)
139 (10.2)
93 (10.4)
$20417-$42043
707 (52.0)
413 (46.0)
$42297-$94873
654 (48.0)
485 (54.0)
0.0-14.0%
686 (50.4)
405 (45.1)
14.2-62.2%
675 (49.6)
493 (54.9)
Vaccination provided
106 (7.8)
109 (12.1)
0.0006
0.046
Median family income in patient's zipcode*
0.006
Percent of adults with a bachelor's degree or higher in
patient's zipcode*
0.01
Injury type
Fracture
315 (23.1)
176 (19.6)
Dislocation
34 (2.5)
32 (3.6)
0.14
Burn
70 (5.1)
47 (5.2)
0.92
Retinal hemorrhage
41 (3.0)
23 (2.6)
0.53
Intracranial
87 (6.4)
41 (4.6)
0.07
Abdominal thoracic
21 (1.5)
6 (0.7)
0.06
Open wound
104 (7.6)
75 (8.4)
0.54
Blood vessel
5 (0.4)
6 (0.7)
0.31
Superficial Injury
114 (8.4)
64 (7.1)
0.28
Contusions
269 (19.8)
163 (18.2)
0.34
Crush
3 (0.2)
2 (0.2)
1
Spinal cord
7 (0.5)
6 (0.7)
0.78
Deans et al. BMC Pediatrics 2014, 14:217
/>
Page 8 of 10
Table 3 Differences between children with and without birth records in PFK (Continued)
Location of injury
Head/neck
275 (20.2)
136 (15.1)
0.002
Face
64 (4.7)
32 (3.6)
0.19
Chest
64 (4.7)
30 (3.3)
0.11
Abdomen and pelvic contents
49 (3.6)
24 (2.7)
0.22
Extremities or pelvic girdle
337 (24.8)
231 (25.7)
0.61
External
548 (40.3)
347 (38.6)
0.44
Cut/pierce
6 (0.4)
5 (0.6)
0.7
Drowning/submersion
2 (0.2)
1 (0.1)
1
Mechanism of injury
Fall
223 (16.4)
138 (15.4)
0.52
Fire/Burn
47 (3.5)
28 (3.1)
0.66
0.23
Natural/environmental
12 (0.9)
4 (0.5)
Overexertion
1 (0.1)
0 (0)
1
Poisoning
17 (1.3)
7 (0.8)
0.29
Struck by/against
63 (4.6)
32 (3.6)
0.22
Suffocation
2 (0.2)
1 (0.1)
0
473 (34.8)
335 (37.3)
1
297 (21.8)
217 (24.2)
2
225 (16.5)
143 (15.9)
3
94 (6.9)
69 (7.7)
4
75 (5.5)
42 (4.7)
≥5
197 (14.5)
92 (10.2)
Injury Severity (TMPM-ICD9 probability of death)**
0.031 (0.011, 0.095)
0.021 (0.009, 0.082)
1
Number of injuries
0.048
<.0001
Characteristics shown were determined at the first event. *Based on the child's zip code at their first event and on data from the 2000 US Census. **TMPM-ICD9 = trauma
mortality prediction model. Data are shown as frequencies and percentages for categorical variables and medians and 25th and 75th percentiles for continuous variables.
PFK = Partners for Kids Medicaid accountable care organization.
record, mental health issues, and being maltreated as a
child [9-11]. In addition, several case series have described recurrence of maltreatment following specific
injuries [5,6,12,13]. On a population level, Friedlaender
et al., used Medicaid claims data to demonstrate that victims of maltreatment changed ambulatory care providers
with greater frequency in the year before their first episode
than those children who were not abused [20]. The current
study is the first to utilize system-level administrative data
to identify patterns of injuries and factors associated with
suspected episodes of recurrent NAT. This populationbased approach allows us to examine all medical encounters for a patient, including episodes of care that occur
outside the patient’s usual hospital or health care system.
Using this approach, we identified several trauma-related
risk factors for suspected recurrent NAT.
In this study, more than a quarter of children had a
recurrent event within just one year of their first event.
Risk factors a recurrent event included having fewer
injuries (≤2 injuries) or having a dislocation, open wound,
or and superficial injury at the previous event. These data
potentially identify a bias in either the diagnosis of abuse
and/or the variable response of child protective services to
children based on the number and severity of physically
evident injuries. Children with fewer or less severe injuries
may not be reported to child protective services or are not
removed from the unsafe environment leading to subsequent events. Identification of these more minor injuries as
potential targets for additional screening or referral to child
abuse specialists warrants further prospective study.
This study also found that the median length of time
between the first and second suspected NAT events was
191 days (IQR 69, 389). This is important to note because the average length of child protective services
involvement with a family may be significantly shorter.
In addition, the risk of having a subsequent event increased with each event; 26% of children who experienced a first event proceeded to experience a second
event within a year, whereas 60% children who experienced
a 4th event proceeded to experience a fifth event within a
Deans et al. BMC Pediatrics 2014, 14:217
/>
year. Understanding both the prolonged length of time between a first and second event, as well as the increasing
risks with recurrent events may inform secondary prevention strategies for both medical and child welfare staff.
Several limitations inherent in using system-level administrative claims data are relevant to this study. First,
approximately 35% of patients had at least one break in
Medicaid enrollment. In our analysis, we included these
children as if they had remained continuously in the cohort throughout the study period. With this approach,
there is the potential that children suffered a recurrent
event during the time of non-enrollment, and therefore
our data would be an underestimate of the number of
recurrent events. However, the appropriateness of this
assumption is increased by the finding of similar results
in the subgroup of children with continuous enrollment
in PFK from birth until the end of the study period. Second, some children who were removed from their home
by child welfare after their initial event were lost to
follow-up in this study. Whether or not a child remains
in PFK after out-of-home placement varies by county in
Ohio. Thus, we are unsure of the exact number of children lost to follow-up for this reason. However, when
analyses were repeated in children who remained in PFK
for at least 2 months after their first event, the results
were very similar. Third, we are limited in the sensitivity
and specificity of the ICD-9 coding practices used to
identify key variables. In particular, ICD-9 coding performed after discharge is likely to underestimate the
actual prevalence of abusive injuries in part because physicians may be reticent to assign intentional causality
without confirmation from a multi-disciplinary team of
social workers and law enforcement agents whose consensus is not often available until after discharge. In
addition, ICD-9 codes provide limited ability to distinguish between different types of abuse. In this study, we
aimed to focus on suspected physical abuse, but some of
the codes chosen to define abuse could have certainly
represented instances of emotional or sexual abuse, or
child neglect. Furthermore, we were fairly liberal in our
definition of potentially abusive injuries. Although some
of the injury-only events could have involved accidental
injuries, it is important to note that the rate of injuryonly episodes was remarkably high in this population
(177 events per 1000 person-years), a rate more than 40
times the rate of 3.17 events per 1000 person-years that
was reported in a general population of 0–3 year olds
[21]. This extraordinarily high injury rate is concerning,
regardless of whether the injuries were purposefully
inflicted or represent neglect. An additional limitation
of this study is that, administrative datasets provide limited data on covariates of interest. For example, this
study would have benefited from additional data on race,
parental characteristics, and family-level SES characteristics.
Page 9 of 10
By integrating US Census data, however, it was possible to
evaluate zip-code level SES characteristics. Although the
above limitations were unavoidable in the use of this administrative database, it is likely that they mainly resulted in
under-identification of suspected NAT events and therefore
minimized, rather than exaggerated our findings.
Conclusion
Factors associated with an increased risk for suspected
recurrent NAT events in this study include rural residence, younger age, fewer initially detected injuries, and
specific injury types at a previous event. Recurrent events
often occur months after the initial event. These findings
potentially identify a bias in either the diagnosis of NAT or
the response of child protective services to children who
present with less severe or less numerous injuries.
Additional file
Additional file 1: STROBE Statement—Checklist of items that
should be included in reports of cohort studies.
Abbreviations
NAT: Non-accidental trauma; PFK: Partners for kids; ICD-9-CM: International
classification of diseases, ninth revision, clinical modification; CPT: Current
procedural terminology; TMPM-ICD9: Trauma mortality prediction model;
SES: Socioeconomic status; PWP-GT: Prentice, Williams and Peterson gap
time model; HR: Hazard ratio.
Competing interests
The authors declare that they have no competing interests.
Authors’ contributions
KJD conceptualized and designed the study, interpreted the data, drafted parts
of the initial manuscript, reviewed and revised the manuscript, and approved
the final manuscript as submitted. JT interpreted the data, drafted parts of the
initial manuscript, reviewed and revised the manuscript, and approved the final
manuscript as submitted. JIG interpreted the data, critically reviewed and
revised the manuscript, and approved the final manuscript as submitted. JNC
acquired and analyzed the data, interpreted the data, drafted parts of the initial
manuscript, reviewed and revised the manuscript, and approved the final
manuscript as submitted. PCM conceptualized and designed the study,
interpreted the data, drafted parts of the initial manuscript, reviewed and
revised the manuscript, and approved the final manuscript as submitted. All
authors read and approved the final manuscript.
Acknowledgements
The authors wish to thank Travis Wells, BS, Nationwide Children’s Hospital,
and Jennifer Klima, PhD, OhioHealth Research & Innovations Institute, for
their assistance with data acquisition and management. Mr. Wells and
Dr. Klima have no competing interests to disclose and received no funding
for their work on this research study. This study was supported by intramural
funding from the Research Institute at Nationwide Children’s Hospital and
the Trauma Program at Nationwide Children’s Hospital. However, the study
design, analysis, interpretation of data, writing of the manuscript, and
decision to publish the manuscript belonged entirely to the authors.
Author details
1
Center for Surgical Outcomes Research and Center for Innovation in
Pediatric Practice, The Research Institute at Nationwide Children’s Hospital,
700 Childrens Drive, JWest - 4th floor, Columbus, OH 43205, USA.
2
Department of Surgery, Nationwide Children’s Hospital, Columbus, OH, USA.
3
Division of Child and Family Advocacy, Nationwide Children’s Hospital,
Columbus, OH, USA.
Deans et al. BMC Pediatrics 2014, 14:217
/>
Page 10 of 10
Received: 3 April 2014 Accepted: 14 August 2014
Published: 31 August 2014
References
1. Injury prevention & control: data & statistics - Ten leading causes of
death and injury. [ />2. U.S. Department of Health and Human Services, Administration for Children
and Families, Administration on Children, Youth and Families, Children’s
Bureau: Child maltreatment 2012. [ />research-data-technology/statistics-research/child-maltreatment]
3. Jones DPH: The effectiveness of intervention. In Significant harm: its
management and outcome. Edited by Adcock M, White R. Croyden:
Significant Publications; 1998.
4. Handy TC, Nichols GR 2nd, Smock WS: Repeat visitors to a pediatric
forensic medicine program. J Forensic Sci 1996, 41:841–844.
5. Thackeray JD: Frena tears and abusive head injury: a cautionary tale.
Pediatr Emerg Care 2007, 23:735–737.
6. Jenny C, Hymel KP, Ritzen A, Reinert SE, Hay TC: Analysis of missed cases
of abusive head trauma. JAMA 1999, 281:621–626.
7. Oral R, Yagmur F, Nashelsky M, Turkmen M, Kirby P: Fatal abusive head
trauma cases: consequence of medical staff missing milder forms of
physical abuse. Pediatr Emerg Care 2008, 24:816–821.
8. Deans KJ, Thackeray J, Askegard-Giesmann JR, Earley E, Groner JI, Minneci PC:
Mortality increases with recurrent episodes of nonaccidental trauma in
children. J Trauma Acute Care Surg 2013, 75:161–165.
9. Sledjeski EM, Dierker LC, Brigham R, Breslin E: The use of risk assessment to
predict recurrent maltreatment: a classification and regression tree
analysis (CART). Prev Sci 2008, 9:28–37.
10. English DJ, Marshall DB, Brummel S, Orme M: Characteristics of repeated
referrals to child protective services in Washington state. Child Maltreatment
1999, 4:297–307.
11. Murphy JM, Bishop SJ, Jellinek MS, Quinn D, Poitrast FG: What happens
after the care and protection petition - reabuse in a court sample.
Child Abuse Negl 1992, 16:485–493.
12. Sheets LK, Leach M, Nugent M, Simpson P: Sentinel injuries precede
abusive head trauma in infants. Pediatric Academic Societies Meeting;
Baltimore, MD 2009, E-PAS2009:5140.2.
13. Sheets LK, Leach ME, Koszewski IJ, Lessmeier AM, Nugent M, Simpson P:
Sentinel injuries in infants evaluated for child physical abuse. Pediatrics
2013, 131:701–707.
14. Friedlaender EY, Rubin DM, Alpern ER, Mandell DS, Christian CW,
Alessandrini EA: Patterns of health care Use that May identify young
children Who Are at risk for maltreatment. Pediatrics 2005, 116:1303–1308.
15. Glance LG, Osler TM, Mukamel DB, Meredith W, Wagner J, Dick AW: TMPMICD9: a trauma mortality prediction model based on ICD-9-CM codes.
Ann Surg 2009, 249:1032–1039.
16. ICDPIC: stata module to provide methods for translating international
classification of diseases (ninth revision) diagnosis codes into
standard injury categories and/or scores. [ />bocode/s457028.html]
17. National trauma data bank (NTDB). [ />18. Census 2000 summary file 3 (SF 3). [ />nav/jsf/pages/index.xhtml]
19. Prentice RL, Williams BJ, Peterson AV: On the regression-analysis of
multivariate failure time data. Biometrika 1981, 68:373–379.
20. Ravichandiran N, Schuh S, Bejuk M, Al-Harthy N, Shouldice M, Au H,
Boutis K: Delayed identification of pediatric abuse-related fractures.
Pediatrics 2010, 125:60–66.
21. Agran PF, Anderson C, Winn D, Trent R, Walton-Haynes L, Thayer S: Rates of
pediatric injuries by 3-month intervals for children 0 to 3 years of age.
Pediatrics 2003, 111:e683–e692.
Submit your next manuscript to BioMed Central
and take full advantage of:
• Convenient online submission
doi:10.1186/1471-2431-14-217
Cite this article as: Deans et al.: Risk factors for recurrent injuries in
victims of suspected non-accidental trauma: a retrospective cohort
study. BMC Pediatrics 2014 14:217.
• Thorough peer review
• No space constraints or color figure charges
• Immediate publication on acceptance
• Inclusion in PubMed, CAS, Scopus and Google Scholar
• Research which is freely available for redistribution
Submit your manuscript at
www.biomedcentral.com/submit