Determinants of stunting and severe stunting among under-fives: Evidence from the 2011 Nepal Demographic and Health Survey
Bạn đang xem bản rút gọn của tài liệu. Xem và tải ngay bản đầy đủ của tài liệu tại đây (372.34 KB, 15 trang )
Tiwari et al. BMC Pediatrics 2014, 14:239
/>
RESEARCH ARTICLE
Open Access
Determinants of stunting and severe stunting
among under-fives: evidence from the 2011
Nepal Demographic and Health Survey
Rina Tiwari1*, Lynne M Ausman2 and Kingsley Emwinyore Agho3
Abstract
Background: Stunting remains a major public health concern in Nepal as it increases the risk of illness, irreversible
body damage and mortality in children. Public health planners can reshape and redesign new interventions to
reduce stunting and severe stunting among children aged less than 5 years in this country by examining their
determinants. Hence, this study identifies factors associated with stunting and severe stunting among children aged
less than five years in Nepal.
Methods: The sample is made up of 2380 children aged 0 to 59 months with complete anthropometric
measurements from the 2011 Nepal Demographic and Health Survey (NDHS). Simple and multiple logistic
regression analyses were used to examine stunting and severe stunting against a set of variables.
Results: The prevalences of stunting and severe stunting were 26.3% [95% confidence Interval (CI): 22.8, 30.1] and
10.2% (95%CI: 7.9, 13.1) for children aged 0–23 months, respectively, and 40.6 (95%CI: 37.3, 43.2) and 15.9% (95%CI:
13.9, 18.3) for those aged 0–59 months, respectively. After adjusting for potential confounding factors, multivariable
analyses showed that the most consistent significant risk factors for stunted and severely stunted children aged
0–23 and 0–59 months were household wealth index (poorest household), perceived size of baby (small babies)
and breastfeeding for more than 12 months (adjusted odds ratio (AOR) for stunted children aged 0–23
months = 2.60 [95% CI: (1.87, 4.02)]; AOR for severely stunted children aged 0–23 months = 2.87 [95% CI: (1.54, 5.34)];
AOR for stunted children aged 0–59 months = 3.54 [95% CI: (2.41, 5.19)] and AOR for severely stunted children aged
0–59 months = 4.15 [95% CI: (2.45, 6.93)].
Conclusions: This study suggests that poorest households and prolonged breastfeeding (more than 12 months)
led to increased risk of stunting and severe stunting among Nepalese children. However, community-based
education intervention are needed to reduce preventable deaths triggered by malnutrition in Nepal and should
target children born to mothers of low socioeconomic status.
Background
Stunting and other effects of under-nutrition increase the
risk of illness, irreversible body damage, and increased suboptimal brain development and affect cognitive ability and
mortality in children [1]. It is estimated that about 165 million children in many low- and middle-income countries
are stunted [2]. Stunting is one of the leading causes of the
global burden of disease in childhood and 80% of this
burden is in developing countries [3,4]. Childhood
under-nutrition plays an important public health role
* Correspondence:
1
Nutrition Promotion and Consultancy Service, Kathmandu, Nepal
Full list of author information is available at the end of the article
in monitoring nutritional and health status of the
population and survival [5,6].
Under-nutrition hinders socioeconomic development
of a nation [1]. Consequently, its eradication has gained
global recognition and sustainable development. In
Nepal, stunting remains a serious problem as nearly half
(41 per cent) of children aged under five years are stunted
[7]. The causes of childhood under-nutrition in Nepal are
complex, multidimensional, and interrelated, ranging from
fundamental factors such as slow economic growth, to
specific factors such as respiratory infection and diarrhoeal diseases [8,9].
© 2014 Tiwari et al.; licensee BioMed Central Ltd. This is an Open Access article distributed under the terms of the Creative
Commons Attribution License ( which permits unrestricted use, distribution, and
reproduction in any medium, provided the original work is properly credited. The Creative Commons Public Domain
Dedication waiver ( applies to the data made available in this article,
unless otherwise stated.
Tiwari et al. BMC Pediatrics 2014, 14:239
/>
Previous studies in Nepal have found factors such as sex
of child, child’s age and birth weight, birth order, number of
siblings, wealth index, mother’s education, mother’s body
mass index and access to health care to be common determinants of stunting [9,10]. Additionally, various efforts have
been made to reduce under-nutrition in Nepal [11]. Despite
these commitments and investment, the prevalence of
stunting is still high [7]. In order to reduce the burden
of disease on Nepalese children, it is important to target
those children who are most at risk, such as stunted
children [12-14]. This study utilized the most recent
Nepal Demographic and Health Survey (NDHS 2011)
data to examine the determinants of stunting and severe
stunting among children aged less than five years. Findings
from this study can be generalised to cover populations
with similar characteristics and would be useful to public
health researchers and policy makers in reviewing and designing new intervention strategies aimed at reducing the
number of malnourished children. The results will also provide vital information on preventable illnesses and identify
where health gains can be made to prevent stunting. The
findings may also allow policy-makers to direct resources
to the most vulnerable segments of the population, and
thus make better use of resources.
Ethics
The NDHS surveys were approved by Nepal Health
Research Council, Nepal and ICF Macro Institutional
Review Board in Calverton, Maryland, USA. The NDHS
obtained written consent from the respondents. Mothers
provided consent of their children to provide the information. For analysis, Principal Investigator (PI) received permission from Macro International online for the use of
available dataset. PI also obtained approval from Social,
Behavioural and Educational Research, Institutional Review
Board, Tufts University as exempt category 4 as defined in
45 CFR 46.101 (b).
Methods
Data sources
The data examined were from the 2011 NDHS. This survey
was conducted by the Department of Health Services,
Ministry of Health and Population in collaboration with
USAID. The survey data were a two-stage, stratified, nationally representative sample of households. At the first
stage of sampling, 289 Primary Sampling Units (PSUs)
(95 sub-wards in urban areas and 194 groups of wards
in rural areas) were selected using systematic sampling
with probability proportion to size.
In the selection of households, 12,918 women were
identified as eligible for the individual interview. A total
of 12,674 women aged between 15 and 49 years were
interviewed. Out of this number, 3,701 were resident in
urban areas and 8,973 were rural dwellers. The interviews
Page 2 of 15
yielded a response rate of 98%. The 2011 NDHS collected
anthropometric data for all children. Non-biological
children of women were included in the interviews.
Each team of interviewers carried a scale and measuring
board. Measurements were made using lightweight
SECA scales (with digital screens) on children with valid
dates of birth (month and year) and valid measurement
of both height and weight. Recumbent heights were
measured for children aged 2 years or younger, or
those who were shorter than 85 cm. Standing heights
were measured for all other children [7]. This present
analysis was restricted to children with complete anthropometric measurements, children aged 0–59 months, and the
total weighted sample was 2380.
Stunting (Height-for-age)
Height-for-age z-scores were used to assess the chronic
nutritional status of children under-5 years. This was
accomplished by adapting the Child Growth Standards
of the World Health Organization (WHO) [15]. The
height-for-age z-score, as defined by the WHO, expresses a child’s height in terms of the number of
standard deviations above or below the median height
of healthy children in the same age group or in a reference group. We classified children with a measurement
of < −2 SD from the median of the reference group as
short for their age (stunted), while children with measurement of < −3SD from the median of the reference
group were considered to be severely stunted [16].
Potential risk factors
The explanatory variables were classified into four levels:
parental-, child-, household- and community-level factors.
Parental-level factors included maternal working status,
maternal education, mother’s age, mother’s age at child
birth, mother’s breastfeeding status, duration of breastfeeding, marital status, mother’s literacy, partner’s education, partner’s occupation, birth order, preceding birth
interval, type of delivery assistance, antenatal clinic visits,
timing of postnatal check-up and place of delivery. Mode
of delivery was divided into three categories: delivered at
home, delivered at health facility with non-caesarean
section, and delivered at a health facility with caesarean
section. Child-level factors were: sex of the baby and acute
respiratory infection (defined as having symptoms of cough
accompanied by short, rapid breathing which was chest
related during 2 weeks preceding the survey). Any child
with watery or blood and mucus stool in the preceding
2 weeks was considered as having diarrhoea. Householdlevel factors were household food insecurity, household
wealth index, and sources of drinking water; communitylevel factors were: type of residence, caste group, ecological
zone, geographical zones and sub-region. The household
food insecurity factor was calculated by summing all
Tiwari et al. BMC Pediatrics 2014, 14:239
/>
the seven household food insecurity (access) frequency
questions withscores ranging from 0 to 27. Food secure
was a score of 0, and mild (1–2), moderate (3 to 10),
and severe (more than 10) food insecurity represented
the three groupings [7]. The caste and ethnic group
variables were merged into six categories. This was
done by merging all Brahmin Chhetris irrespective of
their ecological locations into a single category referred
to as “Brahmin/Chhetri”. Similarly, the Janajati from
Terai was merged with other Terai castes to make a
single category and referred to as “TeraiJanajati and other
Terai castes” and Dalits from Hill and Terai were also
combined as one. Likewise, Muslims and other castes
were put together as “Muslims and others” [7].
Household wealth index was calculated as a score
of household assets such as ownership of means of
transport, ownership of durable goods, and household
facilities. These were weighted using the principal
components analysis method [17]. This index was divided into five categories (quintiles), and each household was assigned to one of these categories. The bottom
40% of the households was referred to as the poorest
and poorer households, the next 20% as the middleclass households, and the top 40% as rich and richest
households.
Statistical analyses
To determine factors associated with stunting and severe
stunting in children aged 0–23 months and children 0–59
months – the dependent variable was expressed as a dichotomous variable, i.e. category 0 [not stunted (> − 2SD)
or not severely stunted (> − 3SD)] and category 1 [stunted
(> − 2SD) or severely stunted (> − 3SD)].
Analyses were performed using Stata version 12.0
(StataCorp, College Station, TX, USA). ‘Svy’ commands
were used to allow for adjustments for the cluster sampling design, weights and the calculation of standard
errors. The Taylor series linearization method was used
in the surveys when estimating confidence intervals
(CIs) around prevalence estimates of stunting and
severe stunting among children aged 0–59 months.
Survey logistic regression was used to adjust for the
complex sampling design and weights. First, univariate
binary logistic regression analysis was performed to
examine the association between stunted and severely
stunted children aged 0–23 months and overall stunted
children 0–59 months. Second, the factors associated
with stunting and severe stunting were examined in a
multiple logistic regression model. A stepwise backward elimination approach was applied and collinearity
was tested in the final model and reported. The odds
ratios with 95% CIs were calculated in order to assess
the adjusted risk of independent variables, and those
with P < 0.05 were retained in the final model.
Page 3 of 15
Results
Characteristics of the sample
Of the total sample of 2380 children aged 0–59 months,
majority (91.1%) lived in rural areas. More than half
(56.6%) of the interviewed mothers were employed in
the last 12 months, and 32.6% had secondary or higher
level of education. Of the total births, 65.5% took place at
home and by non-caesarean section, and 30% (see Table 1)
were delivered at the health care facility and by noncaesarean section or vaginal birth. The remaining 4.5%
were delivered by caesarean section at the health care facility. In the sample, male and female children were almost
equally represented. About 83% of mothers had made at
least one antenatal clinic visit during pregnancy and a majority of the mothers in the sample were within 20–29 years
of age. Also, approximately 44% of households reported
food security and 16% reported severe food insecurity.
According to the mothers’ perception, 64.5% of children
were average size, 17.7% were small or very small size, and
17.8% were large size at birth. As shown in Table 1, the
proportion of mothers who could not read a sentence was
42.7%. Nearly 24% of children lived in the Eastern geographical zones and 31.6%, 18.2%, 15.1% and 11.3% of
children lived in Central, Western, Mid-western, and
Far-western geographical zones respectively.
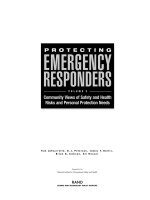
As shown in Figure 1, the prevalence of stunted children
aged 0–23 months was 26% and a higher 41% for children
aged 0–59 months. The overall prevalence of severely
stunted children aged 0–23 months and 0–59 months
were 10% and 16%, respectively.
Multivariate analyses
Tables 2 and 3 show the unadjusted and adjusted ORs
for the association between stunted and severely
stunted children by parental-, child-, household- and
community-level characteristics of children aged 0–23
and aged 0–59 months.
Risk factors for stunting
As shown in Table 2, children aged 0–23 months delivered
by older mothers (adjusted OR = 7.36, 95%CI: 2.11, 25.75;
p = 0.002 for mothers aged 40 and above) were significantly
more likely to be stunted than those delivered by younger
mothers (mothers less than 20 years old).
For children aged 0–23 months, those who were delivered at the health facility by non-caesarean section
(adjusted OR = 0.55, 95%CI: 0.33, 0.92; p = 0.022) were
significantly less likely to be stunted compared with
children delivered at home. Babies who were perceived
to be large by their mothers were 58% less likely to be
stunted than those who were perceived to be small
(adjusted OR = 0.42, 95%CI: 0.22, 0.81; p = 0.010 for
large babies). Also, children aged 0–23 months who were
breastfed for up to 12 months were significantly less
Tiwari et al. BMC Pediatrics 2014, 14:239
/>
Page 4 of 15
Table 1 Characteristics of parental-, child-, household- and
community-level factors of stunted children aged 0–59
months in Nepal 2011
Table 1 Characteristics of parental-, child-, household- and
community-level factors of stunted children aged 0–59
months in Nepal 2011 (Continued)
Characteristic
Combined Place and mode of delivery
n
%
Parental factors
Home delivery
1560
65.5
Maternal working status
Health facility with non-caesarean
713
30.0
107
4.5
772
32.4
44
1.9
1490
62.6
74
3.1
317
16.8
Non-working
1033
43.4
Health facility with caesarean
Working (past 12 months)
1347
56.6
Type of delivery assistance
1128
47.4
Traditional birth attendant
Primary
469
19.7
Relatives and other untrained personnel
Secondary and above
782
32.9
No one
1679
70.6
None
Agriculture
593
24.9
1-3.
647
34.3
Not working
108
4.5
4+
921
48.9
No education
530
22.4
No postnatal check-up
1756
73.8
Primary
578
24.4
0-2 days
429
18.0
1262
53.3
Delayed
196
8.2
15-24 years
997
41.9
Yes
1830
76.9
25-34 years
1103
46.3
No
550
23.1
35-49years
281
11.8
Duration of breastfeeding
< 20 years
492
20.7
> 12 months
20-29 years
1458
61.3
Mother’s literacy
30-39 years
367
15.4
≥40 years
62
2.6
Maternal education
No education
Health professional
Partner’s occupation
Non agriculture
Antenatal clinic visits
Partner’s education
Secondary and above
Timing of postnatal check-up
Mother’s age
Currently breastfeeding
Mother’s age at birth
Up to 12 months
Marital status
Currently married
498
20.9
1882
79.1
Can’t read at all
1016
42.7
Can read
1364
57.3
Male
1208
50.7
Female
1172
49.3
Child level factors
2361
99.2
19
0.8
First-born
835
35.1
Perceived size of baby at birth
2nd -4th
1235
51.9
Small
5 or more
310
13.0
Average
835
35.1
Child’s age in months
< 24 months
324
13.6
0-5
206
8.8
> 24 months
1219
51.3
6-11
240
10.3
12-17
269
11.6
1560
65.6
18-23
215
9.2
820
34.4
24-29
227
9.8
30-35
252
10.8
Formerly married^
Birth order
Preceding birth interval
No previous birth
Large
Place of delivery
Home
Health facility
Mode of delivery
Non-caesarean
Caesarean
Sex of baby
421
17.7
1531
64.5
424
17.8
2273
95.5
36-41
273
11.7
107
4.5
42-47
230
9.9
Tiwari et al. BMC Pediatrics 2014, 14:239
/>
Page 5 of 15
Table 1 Characteristics of parental-, child-, household- and
community-level factors of stunted children aged 0–59
months in Nepal 2011 (Continued)
Table 1 Characteristics of parental-, child-, household- and
community-level factors of stunted children aged 0–59
months in Nepal 2011 (Continued)
48-53
220
9.5
Far-western
54-59
195
8.4
Sub-Region
Child had diarrhoea recently
Eastern Mountain
269
11.3
46
1.9
No
2028
85.2
Central Mountain
42
1.7
Yes
352
14.8
Western Mountain
101
4.3
Eastern Hill
174
7.3
No
1883
79.1
Central Hill
215
9.0
Yes
497
20.9
Western Hill
274
11.5
Mid-Western Hill
165
6.9
Child had fever in last two weeks
Household level factors
Household food insecurity (Access)
Food secure
1004
Far-Western Hill
112
4.7
43.6
Eastern Terai
348
14.6
Mildly insecure
129
5.6
Central Terai
495
20.8
Moderately
803
34.9
Western Terai
160
6.7
Severely
365
15.9
Mid-Western Terai
136
5.7
Far-Western Terai
113
4.7
Wealth index
Poorest
608
25.6
Poorer
483
20.3
Middle
555
23.3
Rich
406
17.1
Richest
328
13.8
Source of drinking water
Unprotected
Protected
409
17.2
1972
82.8
Community level factors
Type of residence
Urban
211
8.9
Rural
2169
91.1
724
30.4
Caste group
B/C (Hill and Terai)
Newar
63
2.7
Hill Janajati
541
22.8
TeraiJanajati and other Terai castes
469
19.7
Dalit
434
18.2
Muslim and others
149
6.3
Ecological Zone
divorced/separated/widowed.
Household food insecurity scores: Food secure (score, 0); mildly insecurity
(score, 1–2), moderately (score, 3–10) and severely (score, 10–27).
likely to be stunted than those breastfed for more than
12 months.
Children aged 0–23 months from middle-income households (adjusted OR = 0.53, 95%CI: 0.33, 0.85; p = 0.009),
those from richer households (adjusted OR = 0.28, 95%CI:
0.15, 0.53; p < 0.001) and those from richest households
(adjusted OR = 0.26, 95%CI: 0.11, 0.60; p = 0.002) were significantly less likely to be stunted compared to those from
poorest households. Children aged 0–23 months who had
no access to protected drinking water were 1.74 times more
likely to be stunted than those who had access to protected
drinking water. In the final model, we removed household
wealth index and replaced with father’s education. The result indicated that children aged 0–23 months whose fathers attained secondary education or higher were 44% less
likely to be stunted compared with children whose fathers
10
0-23 months
26
Mountain
189
7.9
Hill
940
39.5
1252
52.6
Eastern
567
23.8
Central
751
31.6
Western
434
18.2
Mid-western
359
15.1
Terai
^
16
0-59 months
41
Geographic Zones
0
10
20
30
Percentage of children
Severe stunƟng
40
StunƟng
Figure 1 Prevalence of stunting and severe stunting among
children aged 0-59 months.
50
Tiwari et al. BMC Pediatrics 2014, 14:239
/>
Page 6 of 15
Table 2 Unadjusted and adjusted odds ratios (OR) (95% CI) for stunted children aged 0–23 and 0–59 months
Characteristic
Stunted children 0–23 Months
Unadjusted
Odd Ratio
(OR) [95%CI]
P
Adjusted
Odd Ratio
(AOR) [95%CI]
Stunted children 0–59 Months
P
Unadjusted
Odd Ratio
(OR) [95%CI]
P
Parental factors
Maternal working status
Non-working
Working (past 12 months)
1.00
1.60 (1.09, 2.34)
1.00
0.015
1.30 (0.99, 1.70)
0.057
Maternal education
No education
1.00
1.00
Primary
0.75 (0.47,1.18)
0.205
0.77 (0.58, 1.03)
Secondary and above
0.39 (0.24, 0.62)
<0.001
0.46 (0.35, 0.60) <0.001
0.079
Partner’s occupation
Non agriculture
1.00
1.00
Agriculture
1.80 (1.24,2.63)
0.002
1.68 (1.30, 2.18) <0.001
Not working
0.28 (0.07,0.62)
0.071
0.57 (0.29, 1.13)
0.109
Partner’s education
No education
1.00
1.00
Primary
0.67 (0.40, 1.11)
0.121
0.91 (0.62, 1.33)
0.620
Secondary and above
0.40 (0.26, 0.60)
<0.001
0.58 (0.42, 0.79)
0.001
Mother’s age
15-24 years
1.00
1.00
25-34 years
1.16 (0.81,1.67)
0.420
1.16 (0.94,1.43)
35-49years
3.14 (1.54, 6.01)
0.001
1.91 (1.39, 2.63) <0.001
0.159
Mother’s age at birth
< 20 years
1.00
20-29 years
0.98 (0.60,1.62)
0.944
1.02 (0.58, 1.80)
0.955
0.91 (0.68, 1.21)
0.508
30-39 years
1.17 (0.65,2.11)
0.595
0.95 (0.48, 1.87)
0.877
1.06 (0.75, 1.52)
0.728
11.06 (4.26, 28.72) <0.001 7.31 (2.12, 25.22)
0.002
2.28 (1.27, 4.11)
0.006
40 and above
1.00
1.00
Marital status
Currently married
1.00
Formerly married^
3.10 (0.26, 36.98)
1.00
0.370
1.52 (0.51, 4.52)
0.450
Birth order
First-born
1.00
1.00
2nd -4th
1.60 (1.13, 2.25)
0.008
1.25 (1.00, 1.56)
5 or more
3.45 (1.91, 6.23)
<0.001
2.15 (1.57, 2.94) <0.001
0.052
Preceding birth interval
No previous birth
1.00
1.00
< 24 months
2.20 (1.35, 3.58)
0.002
1.64 (1.22, 2.20)
0.001
> 24 months
1.77 (1.22, 2.57)
0.003
1.34 (1.08, 1.66)
0.009
Type of delivery assistance
Health professional
1.00
1.00
Traditional birth attendant
0.88 (0.19, 4.04)
0.873
1.24 (0.58, 2.64)
Relatives or other
3.14 (2.00, 4.94)
<0.001
2.39 (1.87, 3.06) <0.001
0.578
No one
5.10 (2.16, 12.04)
<0.001
5.63 (3.39, 9.32) <0.001
Adjusted
Odd Ratio
(AOR) [95%CI]
P
Tiwari et al. BMC Pediatrics 2014, 14:239
/>
Page 7 of 15
Table 2 Unadjusted and adjusted odds ratios (OR) (95% CI) for stunted children aged 0–23 and 0–59 months
(Continued)
Combined Place and mode of delivery
Home delivery
1.00
1.00
1.00
1.00
Health facility with non-caesarean
0.33 (0.21,0.51)
<0.001
0.54 (0.33, 0.90)
0.018
0.42 (0.33, 0.52) <0.001 0.65 (0.51, 0.84)
0.001
Health facility with caesarean
0.22 (0.07, 0.66)
0.007
0.53 (0.16, 1.75)
0.298
0.28 (0.16, 0.50) <0.001 0.53 (0.29, 0.95)
0.033
Timing of postnatal check-up
No postnatal check-up
1.00
1.00
0-2 days
0.39 (0.24, 0.63)
<0.001
0.38 (0.30, 0.49) <0.001
Delayed
0.45 (0.23, 0.87)
0.019
0.40 (0.26, 0.60) <0.001
Antenatal clinic visits
None
1.00
1.00
1-3.
0.71 (0.36, 1.39)
0.312
0.69 (0.47, 1.01)
0.056
4+
0.41 (0.23, 0.73)
0.003
0.46 (0.32,0.65)
<0.001
0.971
0.97 (0.75, 1.26)
Currently breastfeeding
Yes
1.00
No
1.02 (0.33, 3.18)
1.00
1.00
0.841
0.70 (0.53, 0.94)
0.017
Duration of breastfeeding
Upto 12 months
> 12 months
1.00
2.80 (1.91, 4.09)
1.00
<0.001
2.60 (1.87, 4.02)
1.00
1.00
<0.001 4.22 (3.12, 5.69) <0.001 3.54 (2.41, 5.19) <0.001
Mother’s literacy
Can’t read at all
Can read
1.00
0.52 (0.35, 0.76)
1.00
0.001
0.58 (0.45, 0.73) <0.001
Child level factors
Child age
Sex of baby
Male
Female
1.00
0.75 (0.53, 1.06)
1.00
0.104
0.93 (0.78, 1.10)
0.392
Perceived size of baby at birth
Small
Average
1.00
0.51 (0.32, 0.84)
1.00
1.00
0.008
0.61 (0.36, 1.04)
0.070
0.42 (0.36, 0.83)
0.013
Large
0.40 (0.22, 0.75)
0.004
Child’s age in months
2.39 (1.59, 3.59)
<0.001
0.64 (0.49, 0.83)
1.00
0.001
1.00
Yes
1.29 (0.83, 2.02)
1.00
0.254
0.91 (0.66, 1.27)
0.389
0.79 (0.63, 0.98)
1.11 (0.71, 1.76)
0.589
Child had fever in last two weeks
No
1.00
Yes
1.20 (0.79,1.84)
1.00
0.035
Household level factors
Food insecurity (Access)
Food secure
1.00
0.008
0.46 (0.33, 0.65) <0.001 0.47 (0.33, 0.67) <0.001
1.34 (1.25, 1.44) <0.001 1.11 (1.01, 1.23)
Child had diarrhoea recently
No
0.68 (0.51, 0.90)
1.00
Mildly insecurity
0.79 (0.34, 1.82)
0.571
0.638
Moderately
2.34 (1.48, 3.70)
<0.001
1.66 (1.28, 2.16) <0.001
Severely
2.94 (1.54, 5.63)
0.001
2.22 (1.54, 3.20) <0.001
0.031
Tiwari et al. BMC Pediatrics 2014, 14:239
/>
Page 8 of 15
Table 2 Unadjusted and adjusted odds ratios (OR) (95% CI) for stunted children aged 0–23 and 0–59 months
(Continued)
Wealth index
poorest
1.00
poorer
0.79 (0.50, 1.25)
1.00
0.314
0.93 (0.58, 1.50)
1.00
1.00
0.711
0.65 (0.47, 0.88)
0.005
0.67 (0.48, 0.94)
0.020
0.42 (0.30, 0.59) <0.001 0.47 (0.33, 0.68) <0.001
middle
0.45 (0.28, 0.72)
0.001
0.59 (0.36, 0.97)
0.039
richer
0.25 (0.14, 0.45)
<0.001
0.31 (0.16, 0.59)
<0.001 0.33 (0.24, 0.46) <0.001 0.38 (0.25, 0.56) <0.001
richest
0.16 (0.07, 0.34)
<0.001
0.29 (0.12, 0.67)
0.004
0.26 (0.18, 0.37) <0.001 0.37 (0.25, 0.55) <0.001
Source of drinking water
Unprotected
Protected
1.00
1.50 (0.95, 2.36)
1.00
1.00
0.084
1.08 (0.81, 1.43)
0.609
0.005
1.95 (1.47, 2.58) <0.001
Community level factors
Type of residence
Urban
1.00
Rural
2.14 (1.26, 3.64)
1.00
Caste group
B/C (Hill and Terai)
1.00
1.00
Newar
0.72 (0.26, 2.05)
0.542
0.77 (0.40, 1.48)
0.423
Hill Janajati
1.14 (0.71, 1.85)
0.577
1.35 (0.98, 1.84)
0.063
TeraiJanajati and other terai castes
1.52 (0.94, 2.43)
0.086
1.11 (0.77, 1.62)
0.566
Dalit
1.46 (0.92, 2.33)
0.110
1.53 (1.18, 1.99)
0.002
Muslim and others
0.91 (0.36, 2.26)
0.832
0.80 (0.48, 1.32)
0.382
Ecological Zone
Mountain
1.00
1.00
1.00
Hill
0.55 (0.35, 0.87)
0.010
0.63 (0.47, 0.84)
0.002
0.68 (0.50, 0.93)
0.015
Terai
0.48 (0.30, 0.77)
0.002
0.52 (0.39, 0.70) <0.001 0.80 (0.57, 1.12)
0.193
Geographic Zones
Eastern
1.00
Central
1.28 (0.75, 2.17)
0.366
1.04 (0.72, 1.49)
1.00
0.832
Western
1.13 (0.61, 2.10)
0.692
1.07 (0.72, 1.60)
0.738
Mid-western
1.64 (0.96, 2.77)
0.068
1.71 (1.15, 2.55)
0.008
Far-western
1.28 (0.73, 2.25)
0.387
1.47 (0.96, 2.24)
0.075
^
divorced/separated/widowed.
Household food insecurity scores: Food secure (score, 0); mildly insecurity (score, 1–2), moderately (score, 3–10) and severely (score, 10–27).
had no formal education (adjusted OR = 0.56; CI: 0.37, 0.86;
p = 0.007 for fathers with secondary education or higher).
Children aged 0–59 months who were currently being
breastfed were significantly less likely to be severely stunted
compared with children of the same age group who
were not currently being breastfed (adjusted OR = 0.70;
CI: 0.54, 0.94; p = 0.017); and children aged 0–59
months who breastfed for more than 12 months were
more likely to be stunted than those breastfed for up to
12 months. Children aged 0–59 months who were perceived by their mothers to be average size (adjusted
OR = 0.68, 95%CI: 0.51, 0.90; p = 0.008) and those perceived to be large (adjusted OR = 0.47, 95%CI: 0.33,
0.67; p < 0.001) at the time of delivery were significantly
less likely to be stunted than children of the same age
perceived to be small at the time of delivery.
Children aged 0–59 months from poorer households
(adjusted OR = 0.67, 95%CI: 0.48, 0.94; p = 0.020), middleincome households (adjusted OR = 0.47, 95%CI: 0.33, 0.68;
p < 0.001), and richer households (adjusted OR = 0.38, 95%
CI: 0.25, 0.56; p < 0.001) and those from richest households
(adjusted OR = 0.37, 95%CI: 0.25, 0.55; p < 0.001) were
significantly less likely to be stunted compared with
those from poorest households. Increasing age of the
child was significantly associated with stunting (adjusted
OR = 1.11, 95%CI: 1.01, 1.23; p = 0.031) andchildren aged
0–59 months from the Hill zone (adjusted OR = 0.68, 95%
CI: 0.50, 0.93; p = 0.015) were significantly less likely to be
Tiwari et al. BMC Pediatrics 2014, 14:239
/>
Page 9 of 15
Table 3 Unadjusted and adjusted odds ratios (OR) (95% CI) for severely stunted children aged 0–23 and 0–59 months
Characteristic
Severely stunted children 0–23 Months
Unadjusted
OR [95%CI]
p
Adjusted
Odd Ratio
(AOR) [95%CI]
Severely stunted children 0–59 Months
p
Unadjusted
OR [95%CI]
p
Adjusted
Odd Ratio
(AOR) [95%CI]
p
Parental factor
Maternal working status
Non-working
Working (past 12 months)
1.00
2.10 (1.16, 3.80)
1.00
0.015
1.10 (0.78, 1.55)
0.603
Maternal education
No education
1.00
1.00
Primary
0.69 (0.34, 1.42)
0.313
0.56 (0.37, 0.84)
0.005
Secondary and above
0.44 (0.21, 0.91)
0.027
0.35 (0.24, 0.52)
<0.001
Partner’s occupation
Non agriculture
1.00
1.00
Agriculture
1.39 (0.77, 2.52)
0.270
1.75 (1.20, 2.54)
0.004
Not working
0.59 (0.10, 3.54)
0.558
0.40 (0.14, 1.15)
0.088
Partner’s education
No education
1.00
1.00
Primary
0.62 (0.26, 1.47)
0.277
Secondary and above
0.39 (0.19, 0.78)
0.008
0.73 (0.46, 1.15)
0.172
0.43 (0.28, 0.65)
<0.001
Mother’s age
15-24 years
1.00
1.00
25-34 years
1.29 (0.71,2.33)
0.406
1.07 (0.77, 1.49)
0.684
35-49years
4.50 (2.04, 9.94)
<0.001
1.84 (1.28, 2.65)
0.001
Mother’s age at birth
< 20 years
1.00
1.00
20-29 years
0.72 (0.36, 1.44)
0.351
0.79 (0.55, 1.14)
0.213
30-39 years
1.36 (0.60, 3.10)
0.457
1.17 (0.76, 1.79)
0.481
40 and above
5.85 (1.81, 18.96)
0.003
1.53 (0.76, 3.08)
0.232
Currently married
-'
-'
1.00
Formerly married^
-'
-'
0.76 (0.23, 2.54)
Marital status
0.653
Birth order
First-born
1.00
1.00
2nd -4th
2.08 (1.14, 3.79)
0.017
1.39 (1.01, 1.90)
0.042
5 or more
4.68 (2.19, 10.00)
<0.001
2.14 (1.39, 3.30)
0.001
Preceding birth interval
No previous birth
1.00
1.00
1.00
< 24 months
3.59 (1.75, 7.38)
0.001
2.38 (1.12, 5.03)
0.024
2.25 (1.51, 3.34)
<0.001
> 24 months
2.21 (1.18, 4.14)
0.014
1.54 (0.80, 2.99)
0.195
1.36 ( 0.97, 1.89)
0.073
Type of delivery assistance
Health professional
1.00
1.00
1.00
1.00
Traditional birth attendant
1.56 (0.20, 12.33)
0.674
1.58 (0.19, 13.14)
0.670
1.08 (0.24, 4.82)
0.922
0.65 (0.14, 3.11)
0.589
Relatives or other
3.67 (1.91, 7.03)
<0.001
2.15 (0.98, 4.72)
0.056
2.65 (1.83, 3.83)
<0.001
1.55 (1.05, 2.31)
0.029
No one
7.32 (2.53, 21.22)
<0.001
3.69 (1.14, 11.93)
0.029
7.07 (3.84, 13.01)
<0.001
2.88 (1.47, 5.67)
0.002
Tiwari et al. BMC Pediatrics 2014, 14:239
/>
Page 10 of 15
Table 3 Unadjusted and adjusted odds ratios (OR) (95% CI) for severely stunted children aged 0–23 and 0–59 months
(Continued)
Combined Place and mode of delivery
Home delivery
1.00
1.00
Health facility with non-caesarean
0.33 (0.18,0.60)
<0.001
0.41 (0.29, 0.58)
<0.001
Health facility with caesarean
0.37 (0.07,1.90)
0.231
0.16 (0.04, 0.59)
0.006
Timing of postnatal check-up
No postnatal check-up
1.00
1.00
0-2 days
0.44 (0.23,0.85)
0.014
0.34 (0.23, 0.51)
<0.001
Delayed
0.33 (0.11, 0.97)
0.045
0.29 (0.14, 0.62)
0.001
Antenatal clinic visits
None
1.00
1.00
1-3.
0.72 (0.34,1.49)
0.372
0.77 (0.52, 1.15)
0.201
4+
0.50 (0.25,1.01)
0.053
0.46 (0.30, 0.71)
0.001
0.789
0.58 (0.41, 0.82)
Currently breastfeeding
Yes
1.00
No
0.86 (0.27, 2.70)
1.00
1.00
0.002
0.49 (0.34, 0.69)
<0.001
Duration of breastfeeding
Up to 12 months
> 12 months
1.00
2.90 (1.81, 5.22)
1.00
<0.001
2.87 (1.54, 5.34)
1.00
0.001
3.75 (2.30, 6.11)
1.00
<0.001
4.15 (2.49, 6.93)
<0.001
0.61 (0.43, 0.86)
<0.001
Mother’s literacy
Can’t read at all
Can read
1.00
0.55 (0.31, 0.97)
1.00
0.039
0.42 (0.31, 0.59)
1.00
0.005
Child level factors
Sex of baby
Male
Female
1.00
0.46 (0.29, 0.72)
1.00
0.001
0.44 (0.28, 0.71)
1.00
0.001
0.95 (0.72, 1.26)
0.710
Perceived size of baby at birth
Small
1.00
1.00
1.00
Average
0.65 (0.37, 1.14)
0.133
0.70 (0.50, 0.98)
0.038
0.81 (0.57, 1.16)
0.243
Large
0.46 (0.20, 1.07)
0.070
0.43 (0.27, 0.68)
<0.001
0.47 (0.29, 0.74)
0.001
Child’s age in months
2.62 (1.41, 4.86)
0.002
1.23 (1.14, 1.33)
<0.001
0.201
1.01 (0.69, 1.47)
Child had diarrhoea recently
No
1.00
Yes
1.53 (0.80,2.93)
1.00
0.968
Child had fever in last two weeks
No
1.00
Yes
1.50 (0.85, 2.65)
1.00
0.165
0.89 (0.64, 1.23)
0.478
Household level factors
Household Food Insecurity (Access)
Food secure
1.00
1.00
Mildly insecurity
1.77 (0.50, 6.34)
0.377
0.85 (0.43, 1.68)
0.637
Moderately
2.88 (1.27,6.55)
0.012
1.61 (1.06, 2.43)
0.024
4.80 (2.00, 11.50)
<0.001
2.41 (1.47, 3.96)
0.001
Severely
Tiwari et al. BMC Pediatrics 2014, 14:239
/>
Page 11 of 15
Table 3 Unadjusted and adjusted odds ratios (OR) (95% CI) for severely stunted children aged 0–23 and 0–59 months
(Continued)
Wealth Index
poorest
1.00
poorer
0.82 (0.42, 1.60)
0.558
0.81 (0.40, 1.66)
1.00
0.566
0.76 (0.52, 1.11)
1.00
0.156
0.91 (0.61, 1.36)
1.00
0.638
middle
0.42 (0.20, 0.87)
0.020
0.49 (0.22, 1.05)
0.067
0.45 (0.30, 0.69)
<0.001
0.60 (0.40, 0.91)
0.016
richer
0.28 (0.11, 0.69)
0.006
0.36 (0.14, 0.93)
0.034
0.33 (0.20, 0.53)
<0.001
0.49 (0.30, 0.82)
0.007
richest
0.19 (0.06, 0.60)
0.005
0.33 (0.10, 1.15)
0.081
0.19 (0.11, 0.33)
<0.001
0.40 (0.20, 0.80)
0.009
Source of drinking water
Unprotected
Protected
1.00
0.91 (0.48,1.74)
1.00
0.779
0.87 (0.52, 1.24)
0.187
3.00 (1.86, 4.83)
0.455
Community level factors
Type of residence
Urban
1.00
Rural
1.62 (0.79, 3.30)
1.00
<0.001
Caste group
B/C (Hill and Terai)
1.00
1.00
Newar
0.84 90.22,3.25)
0.796
0.82 (0.31, 2.13)
0.682
Hill Janajati
0.97 (0.45, 2.09)
0.935
1.25 (0.87, 1.80)
0.233
TeraiJanajati and other terai castes
0.99 (0.38, 2.64)
0.997
1.30 (0.72, 2.38)
0.385
Dalit
1.35 (0.68, 2.69)
0.389
1.74 (1.24, 2.44)
0.001
Muslim and others
0.69 (0.26, 1.87)
0.468
0.92 (0.46, 1.85)
0.825
Ecological Zone
Mountain
1.00
1.00
Hill
0.81 (0.39, 1.68)
0.565
0.69 (0.47, 1.01)
0.059
Terai
0.60 (0.28, 1.29)
0.191
0.63 (0.42, 0.94)
0.025
Geographic Zones
Eastern
1.00
Central
1.46 (0.64, 3.30)
0.363
1.37 (0.86, 2.20)
1.00
0.184
Western
2.13 (0.91, 5.03)
0.083
1.23 (0.72, 2.09)
0.449
Mid-western
2.41 (1.16, 5.00)
0.018
1.77 (1.12, 2.81)
0.015
Far-western
1.70 (0.68, 4.25)
0.254
1.46 (0.85, 2.52)
0.168
^
divorced/separated/widowed.
Household food insecurity scores: Food secure (score, 0); mildly insecurity (score, 1–2), moderately (score, 3–10) and severely (score, 10–27).
stunted compared with those who lived in the Mountains.
In the final model for stunted children aged 0–59 months,
we removed household wealth index and replaced it with
household food security and our result revealed that households who reported moderate and severe food insecurity
were 1.37 times and 1.67 times more likely to be stunted
than those who reported food security (adjusted OR = 1.37,
95%CI: 1.02, 1.85; p = 0.039 for moderately food insecure households and adjusted OR = 1.67, 95%CI: 1.17,
2.38; p = 0.005) for severely food insecure households).
Risk factors for severe stunting
Table 3 illustrates the unadjusted and adjusted odds ratios
for the association between severely stunted children and
parental-, child-, household- and community-level factors
of children aged 0–23 months and 0–59 months. Girls aged
0–23 months had statistically significantly reduced odds of
being severely stunted compared to boys aged 0–23 months
(AOR = 0.44, 95% CI: 0.28, 0.71; p = 0.001). Children
aged 0–23 months from rich household had reduced
odds of being severely stunted (AOR = 0.36, 95%CI: 0.14,
0.93; p = 0.034) compared with those from poorest household. Children aged 0–23 months who were delivered
without assistance to their mothers and mothers of children with preceding birth interval less than 24 months
were significantly more likely to be severely stunted than
those children delivered by health professional and those
with mothers with no previous birth. In the final model
Tiwari et al. BMC Pediatrics 2014, 14:239
/>
for severely stunted children aged 0–23 months, when
household wealth index was removed and replaced with
household food security, the result indicated that household
who reported severe food insecurity were 3.27 times more
likely to be severely stunted than those who reported food
security (adjusted OR = 3.27, 95%CI: 1.30, 8.20; p = 0.016).
Children aged 0–59 months who were delivered with
assistance by relatives or others and those delivered with
no assistance were significantly more likely to be stunted
compared with children who were delivered with assistance
from a health professional. The odds for severely stunted
children aged 0–59 months for babies not currently being
breastfed and children whose mothers could not read decreased significantly by 41% (adjusted OR = 0.49; CI: 0.34,
0.69; p < 0.001 for currently being breastfed children aged
0–59 months) and 51% (adjusted OR = 0.49; CI: 0.34, 0.69;
p < 0.001 for children whose mothers could read). Children aged 0–59 months who were breastfed for more
than 12 months (adjusted OR = 4.15, 95%CI: 2.49, 6.93;
p < 0.001) were significantly more likely to be severely
stunted than those children aged 0–59 months who
were breastfed for up to 12 months.
Children aged 0–59 months perceived by their
mothers to be large (adjusted OR = 0.47, 95%CI: 0.33,
0.67; p = 0.001) were significantly less likely to be stunted
than children of the same group perceived to be small
by their mothers at the time of delivery. Children aged
0–59 months from middle-income households (adjusted
OR = 0.60, 95%CI: 0.40, 0.91; p = 0.016), richer households
(adjusted OR = 0.49, 95%CI: 0.30, 0.82; p = 0.007) and
those from richest households (adjusted OR = 0.40, 95%
CI: 0.20, 0.80; p = 0.009) were significantly less likely to be
severely stunted than those children aged 0–59 months
from poorest households. In the final model for severely
stunted children aged 0–59 months, when household
wealth index was removed and replaced with type of residence, we observed that children aged 0–59 months who
lived in rural areas were more likely to be severely stunted
than their urban counterparts (adjusted OR = 1.99, 95%CI:
1.23, 3.25; p = 0.006 for rural residence).
Discussion
This paper presents the risk factors for stunting and severe
stunting among children aged 0–23 and 0–59 months
using the 2011 NDHS data. The findings from this study
would enable public health researchers to reshape and
redesign new educational interventions to reduce the
prevalence of stunting in Nepal. The prevalences of
stunting and severe stunting in children less than 23 months
of age were as high as the global estimate of 27% [18] while
the prevalences of stunting and severe stunting in children
aged 0–59 months were also high (NDHS, 2011) but
slightly lower than those of Bangladesh and India [19,20].
Despite many interventions to reduce the level of stunting
Page 12 of 15
among under-five children in Nepal, over the past 10 years,
the prevalence remains consistently high [8]. This explains
the fact that there are other underlying factors contributing
to the high rate of stunting among children aged less than
five years. However, the reported prevalence of stunting
and severe stunting among children aged under five years
in Nepal was within the highest range (40-58%) reported
among other 20 developing countries [21].
This study indicated that increasing age of the child
was significantly associated with stunting and severe stunting and children aged 0–23 months significantly reported a
lower risk of stunting and severe stunting than those in the
older age group of 0–59 months. Similar results were found
by other researchers [22,23]. The finding could be explained
by the protective effect of breastfeeding as most children in Nepal are breastfed even into the second year of
life [24]. The high rate of stunting and severe stunting
observed among children 0–59 months may be associated with inappropriate food supplementation during
the weaning period [24,25].
This study revealed that breastfed children for more
than 12 months were significantly more likely to be
stunted and severely stunted than those breastfed for
up to 12 months, which indicated that stunting and
severe stunting correlated with prolonged duration of
breastfeeding. These findings support the study that
stunting occurs most readily in the first 6–18 months
[26]. Another study [27] found that stunting was most
common among children aged 36–47 months (51.89%)
followed by 12–23 age groups (50.64%) and it was lowest in the older age group of 48–59 months (39.13%).
These variations could be linked to other contributing
factors such as culture, exclusive breastfeeding status,
time of initiation of complementary feeding, socioeconomic dynamics and parents’ educational status in that
community [24,25].
Another risk factor for stunting and severe stunting in
this age group was household wealth index. Our study
revealed that children from poorest households were
more likely to become stunted or severely stunted compared to those from middle-income, richer and richest
households. This finding suggests that a child’s health
status depends upon the socio-economic standing of
their household. Also, educated mothers who are more
conscious about their children’s health and nutritional
needs are most likely to come from richer households.
Previous studies among Peruvian, Cambodian and
Bangladeshi children found household wealth index to be
a key predictor for stunting and severe stunting among
children under five years of age [25,28-30]. The association between low income and stunting has been observed
in several other studies [25,29,31-33]. Rich households
have greater purchasing power for food and other consumer goods needed to ensure the health of children.
Tiwari et al. BMC Pediatrics 2014, 14:239
/>
Such children are therefore not likely to be exposed to
conditions that would lead to stunting or severe stunting.
Our study also revealed that children perceived by their
mothers to be small had a higher risk of being stunted
compared to those perceived to be average or large. These
findings were supported by studies previously conducted in
Pakistan and Mexico [34,35] which indicated that children
less than 24 months of age with lower birth weight were 3
times more likely to be stunted than children of the same
age group with normal or higher birth weight. As the incidence of low birth weight (<2.5 kg) is high (21%) in Nepal
[21], prevention of intrauterine growth retardation, premature delivery and maternal malnutrition should be one of
the basis in public health level intervention strategy for infant stunting. The assessment of the baby’s size at birth by
health-care providers could be significant in identifying
children at risk of stunting. In our analysis, maternal age
at child’s birth was found to be an important risk factor
for childhood stunting and severe stunting. Children in
the age group 0–23 months born to younger mothers
(aged <20 years) were less likely to be stunted compared
with those born to older mothers (aged >20 years). These
results were consistent with a study conducted in Iran
[36]. However, in the Iran study, it was found that children
born to mothers older than 35 years of age were more
likely to be stunted and severely stunted. On the contrary,
a study in Mexico [35] found that maternal age at child’s
birth was not a predictor for stunting. These discrepancies in findings could be attributed to differences in
cultures, socioeconomic dynamics and nutritional factors among the various communities, as the studies
were conducted in different continents of the world.
Among children aged 0–59 months, the type of delivery assistance received was found to be a significant risk
factor for stunting. Children who were delivered with assistance from traditional birth attendants or relatives
and those who were delivered without any assistance
were significantly more likely to be stunted compared to
those who were delivered with assistance from health
professionals. This finding is supported by a study conducted in India [37] in which children delivered at home
were more likely to be stunted compared to those delivered at a health facility. In another study conducted in
Bangladesh [33], it was reported that the place of delivery
and the assistance received were significantly associated
with stunting and severe stunting among pre-school children. These findings could be explained by the health information given to mothers by health professionals during
antenatal and postpartum periods. Possible health information that health professionals could offer to mothers
may include information on exclusive breastfeeding, initiation of complementary feeding as well as comprehensive
care for the new-borns. Further analysis revealed that 78%
of mothers who go for institutional delivery are those
Page 13 of 15
from richest wealth quintiles compared with 22% of
mothers from richest wealth quintiles who delivered
their babies at home.
Our study also found that breastfed children were
significantly less likely to be stunted compared to nonbreastfed children. Also, children born to mothers who
could read were significantly less likely to be stunted
compared to those born to mothers who could not read
at all. This reflects the importance of mother education
and breastfeeding in the development of healthy children
and has been reported in previous studies [30,31,33].
We also found that children who were breastfed and
born to educated mothers were less likely to be stunted
compared to those who were not breastfed and born to
uneducated mothers.
In addition, our study showed that children resident in
the Hill zone were significantly less likely to be severely
stunted compared to those from the Mountains. This
finding is consistent with studies conducted in Bangladesh
[32,33] in which the region where a child was born played
a significant role in predicting stunting. This association
could be due to the nature of dietary intake, access to food
and cultural diversity in that environment.
Replacing household wealth with household food insecurity and type of residence in the final model, this study
found a strong association between household food insecurity and stunting and severe stunting among children
aged 0–59 months and 0–23 months, respectively. These
findings were consistent with a study carried out in
Colombia [38] which indicated that household food insecurity was significantly associated with stunting among preschool children. Our study also found that children aged
0–59 months who lived in the rural areas were significantly
more likely to be stunted compared to their urban counterparts. A two-stage cluster study carried out in Vietnam [23]
found that living in rural areas was a risk factor for malnutrition including stunting. This study also revealed that rich
families were more likely to report food security and also
more likely to reside in urban areas.
As the rate of stunting and severe stunting are still
high in Nepal, program intervention strategies targeting long-term prevention of stunting in this country
are needed to effectively and sustainably improve their
prevalence. Education of mothers and improvement of
household incomes should be given special attention.
This is because children born to uneducated mothers
and from poor households have been found to have increased risk of stunting. In general, our findings are of
major significance because they identify potential areas
for action plans that could improve and sustain the nutritional status of children under-five years of age.
One potential limitation of the study as a secondary data
analysis was that, there was no information on dietary
habits or insufficient dietary practices to support stunted
Tiwari et al. BMC Pediatrics 2014, 14:239
/>
and severely stunted children. Another limitation was the
indirect measure of household wealth in a developing
country such as Nepal. It is difficult to obtain consistent
income and expenditure data in this country; however, an
asset-based index is generally considered a decent proxy
for household wealth status.
The sampling method, appropriate adjustment for
sampling design, including sampling weight and a high
response rate (98%) from the survey are important
strengths of this study. The study also contributes to the
understanding of the factors associated with stunting
and severe stunting among children 0–59 months in
Nepal by using the recent 2011 Demographic and Health
Survey data. For a developing country like Nepal, this
study provides a foundation for planning of intervention
strategies to prevent stunting in children less than five
years of age. Interventional studies aimed at examining
the impact of child and maternal under-nutrition are
needed in Nepal and such studies should target mothers
from low socioeconomic backgrounds.
Conclusions
Our analysis of factors associated with stunting and severe
stunting among children 0–59 months in Nepal revealed
that the common increased risk factors for stunting were
combined place and mode of delivery (home delivery),
prolonged breastfeeding (more than 12 months), perceived size of baby (small babies), household wealth
(poorest households) while types of delivery assistance
(mothers delivered by no one), prolonged breastfeeding (more than 12 months), perceived size of baby
(small babies), household wealth (poorest households)
reported consistenthigh risk factors for severe stunting.Our
findings highlight the need for early community-based educational interventions aimed at improving the nutritional
status of children underfive years of age in order to achieve
optimal brain development and reduce mortality triggered
by malnutrition.
Competing interests
The authors declare that they have no competing interests.
Authors’ contributions
RT and LMA were involved in the conception and design of this study. RT
carried out the analysis and wrote the manuscript. KEA and LMA gave advice
on interpretation and revised and edited the manuscript. All authors read
and approved the manuscript.
Acknowledgements
This analysis is a part of the first author’s Master of Nutrition Science and
Policy thesis with the Tufts University. The first author received scholarship for
her degree by the Feed the Future Food Security Innovation Lab: Collaborative
Research on Nutrition which is funded by the United States Agency for
International Development. We are grateful to Measure DHS, ORC Macro,
Calverton, MD, USA for providing the 2011 NDHS data for this analysis.
Author details
1
Nutrition Promotion and Consultancy Service, Kathmandu, Nepal. 2Friedman
School of Nutrition Science and Policy, Tufts University, Medford,
Page 14 of 15
Massachusetts, USA. 3School of Science and Health, University of Western
Sydney, Sydney, New South Wales, Australia.
Received: 1 May 2014 Accepted: 22 September 2014
Published: 27 September 2014
References
1. United Nations Children’s Fund (UNICEF): Improving Child Nutrition. The
Achievable Imperative for Global Progress. 2013. />publications/index_68661.html. Accessed 02 January 2014.
2. Black RE, Victora CG, Walker SP, Bhutta ZA, Christian P, de Onis M, Ezzati M,
Grantham-McGregor S, Katz J, Martorel R, Uauy R, Alderman H, Gillespie S,
Haddad L, Horton S, Lartey A, Mannar V, Ruel M, Webb P: Maternal and
child undernutrition and overweight in low-income and middle-income
countries. Lancet 2013, 382(9890):427–451.
3. Save the Children: Trackling Child Malnutrition : A LIFE FREE FROM HUNGER.
Save the Children Fund, I St John’s Lane, London ECIM 4AR UK, 2012.
4. Ezzati M, Lopez AD, Rodgers A, Vander Hoorn S, Murray CJ: Selected major
risk factors and global and regional burden of disease. Lancet 2002,
360:1347–1360.
5. Caulfield LE, de Onis M, Blössner M, Black PE: Undernutrition as an
underlying cause of child deaths associated with diarrhea, pneumonia,
malaria, and measles. Am J Clin Nutr 2004, 80(1):193–198.
6. Chang S, Walker SP, Grantham-McGregor S, Powell CA: Early childhood
stunting and later behaviour and school achievement. J Child Psychol
Psychiatr 2002, 43(6):775–783.
7. Ministry of Health and Population (MOHP) [Nepal]., New ERA., ICF
International Inc: Nepal Demographic and Health Survey 2011. Calverton,
Maryland;: Kathmandu [Nepal]: Ministry of Health and Population, New ERA,
and ICF International; 2012.
8. Ministry of Health and Population (MOHP) [Nepal]: Annual report:
Department of Health Services 2066/67 (2009/2010). Kathmandu, Nepal:
Ministry of Health and Population; 2011.
9. Paudel R, Pradhan B, Wagle RR, Pahari DP, Onta SR: Risk factors for
stunting among children: a community based case control study in
Nepal. Kathmandu Univ Med J 2013, 10(3):18–24.
10. Subedi N, Paudel S, Rana T, Poudyal AK: Infant and Young Child feeding
practices in Chepang Communities. J Nepal Health Res Counc 2012,
10(21):141–146.
11. Banstola A: Prevalence of Energy Malnutrition in Children under Five Years and
Service Delivery Responses in Nepal. />Accessed 12 January 2014.
12. Smith LC, Haddad L: How potent is economic growth in reducing
undernutrition? what are the pathways of impact? new cross‐country
evidence. Econ Dev Cult Change 2002, 51(1):55–76.
13. Smith LC, Ramakrishan A, Ndjaye L, Haddad A, Martorell R: The importance
of women’s status for child nutrition in developing countries. Research
Report 131. Washington, D.C: International Food Policy Research Institute
2003. 127-128. Washington, Department of International Health. Emory
University.
14. UNICEF: Statistics and Monitoring. />12 January 2014.
15. World Health Organization: WHO child growth standards: methods and
development: length/height-for-age, weight-for-age, weight-for-length,
weight-for-height and body mass index-for-age. Geneva: WHO (2006).
/>(Accessed 10 January 2014).
16. Richard SA, Black RE, Checkley W: Revisiting the relationship of weight
and height in early childhood. Adv Nutr Int Rev J 2012, 3(2):250–254.
17. Filmer D, Pritchett LH: Estimating wealth effects without expenditure
data–or tears: an application to educational enrollments in states of
India. Demography 2001, 38(1):115–132.
18. de Onis M, Blossner M, Borghi E: Prevalence and trends of stunting among
pre-school children, 1990–2020. Public Health Nutr 2012, 15(1):142–148.
19. Bangladesh Demographic Health Survey (BDHS) 2011: National Institute of
Population Research and Training (NIPORT), Mitra and Associates, and
ORC Macro, Dhaka, Bangladesh and Calverton, Maryland. 2012. Chapter
11, 161-166.
20. International Institute For Population Sciences (IIPS) & ORC Macro: National
Family Health Survey (NFHS-3), 2005–06. Mumbai, India: International Institute
for Population Sciences. Vol. I IIPS; 2007.
Tiwari et al. BMC Pediatrics 2014, 14:239
/>
Page 15 of 15
21. United Nations Children’s Fund (UNICEF): Statistics and Monitoring. 2012.
/>15February 2014.
22. Khan NC, Le Tuyen D, Ngoc TX, Duong PH, Khoi HH: Reduction in
childhood malnutrition in Vietnam from 1990 to 2004. Asia Pac J Clin
Nutr 2007, 16(2):274–278.
23. Hien NN, Kam S: Nutritional status and the characteristics related to
malnutrition in children under five years of age in Nghean, Vietnam.
J Prev Med Public Health 2008, 41(4):232–240.
24. Ulak M, Chandyo RK, Mellander L, Shrestha PS, Strand TA: Infant feeding
practices in Bhaktapur, Nepal: across-sectional, health facility based
survey. Int Breastfeeding J 2012, 7:1.
25. Khanal V, Sauer K, Zhao Y: Determinants of complementary feeding
practices among Nepalese children aged 6–23 months: findings from
demographic and health survey 2011. BMC Pediatr 2013, 13:131.
26. Bank TW: Nutrition at a Glance: Ecuador. 2009. ldbank.
org/curated/en/2011/04/17689625/ecuador-nutrition-glance.Accessed
12February 2014.
27. Mittal A, Singh J, Ahluwalia SK: Effect of maternal factors on nutritional
status of 1-5-year-old children in urban slum population. Indian J
Community Med 2007, 32:234–237.
28. Urke HB, Bull T, Mittelmark MB: Socioeconomic status and chronic child
malnutrition: wealth and maternal education matter more in the
Peruvian Andes than nationally. Nutr Res 2011, 31(10):741–747.
29. Hong R, Mishra V: Effect of wealth inequality on chronic under-nutrition
in Cambodian children. J Health Popul Nutr 2006, 24(1):89–99.
30. Ikeda N, Irie Y, Shibuya K: Determinants of reduced child stunting in
Cambodia: analysis of pooled data from three demographic and health
surveys. Bull World Health Organ 2013, 91(5):341–349.
31. Delpeuch F, Traissac P, Martin-Prevel Y, Massamba JP, Maire B: Economic
crisis and malnutrition: socioeconomic determinants of anthropometric
status of preschool children and their mothers in an African urban area.
Public Health Nutr 2000, 3(1):39–47.
32. Kamal SM: Socio-economic determinants of severe and moderate
stunting among under-five children of Rural Bangladesh. Mal J Nutri
2011, 17(1):105–118.
33. Rahman A, Chowdhury S: Determinants of chronic malnutrition among
preschool children in Bangladesh. J Biosoc Sci 2007, 39(2):161–173.
34. Saleemi MA, Ashraf RN, Mellander L, Zaman S: Determinants of stunting at
6, 12, 24 and 60 months and postnatal linear growth in Pakistani
children. Acta Paediatr 2001, 90(1):1304–1308.
35. Varela-Silva MI, Azcorra H, Dickinson F, Bogin B, Frisancho AR: Influence of
maternal stature, pregnancy age, and infant birth weight on growth
during childhood in Yucatan, Mexico: a test of the intergenerational
effects hypothesis. Am J Hum Biol 2009, 21(5):657–663.
36. Esfarjani F, Roustaee R, Mohammadi F, Esmaillzadeh A: Determinants of stunting
in school-aged children of Tehran, Iran. Int J Prev Med 2013, 4(2):173.
37. Biswas S, Bose K: Association between place of delivery and
undernutrition. Nutr Segment 2011, 1(1):154.
38. Hackett M, Melgar-Quiñonez H, Alvarez MC: Household food insecurity
associated with stunting and underweight among preschool children in
Antioquia, Colombia. Rev Panam Salud Publica 2009, 25(6):506–510.
doi:10.1186/1471-2431-14-239
Cite this article as: Tiwari et al.: Determinants of stunting and severe
stunting among under-fives: evidence from the 2011 Nepal Demographic
and Health Survey. BMC Pediatrics 2014 14:239.
Submit your next manuscript to BioMed Central
and take full advantage of:
• Convenient online submission
• Thorough peer review
• No space constraints or color figure charges
• Immediate publication on acceptance
• Inclusion in PubMed, CAS, Scopus and Google Scholar
• Research which is freely available for redistribution
Submit your manuscript at
www.biomedcentral.com/submit