DETERMINATION OF POLYCYCLIC AROMATIC HYDROCARBONSIN BARBECUED PORK USING QUECHERS EXTRACTION AND GAS CHROMATOGRAPHY –MASS SPECTROMETRY NGUYEN VAN PHUC, tạp CHÍ đại học THỦ dầu một, số 1(40),2019,TR 50 59
Bạn đang xem bản rút gọn của tài liệu. Xem và tải ngay bản đầy đủ của tài liệu tại đây (848.99 KB, 10 trang )
Nguyen Van Phuc
Determination of polycyclic aromatic hydrocarbons...
DETERMINATION OF POLYCYCLIC AROMATIC
HYDROCARBONS IN BARBECUED PORK USING QUECHERS
EXTRACTION AND GAS CHROMATOGRAPHY –
MASS SPECTROMETRY
Nguyen Van Phuc1
1
Ho Chi Minh City University of Food Industry
ARTICLE INFO
Article history:
Received Sep. 4.2018, Accepted Feb. 6.2019.
Contact:
Abstract
Polycyclic aromatic hydrocarbons (PAHs) are chemical compounds that contain aromatic
rings and do not contain heteroaryl or substituted groups. PAHs are found in petroleum, coal, and
plastics; Moreover, PAHs are also found in foods, especially in cooked or grilled meats. These
compounds are pollutants and identified as carcinogenic, mutagenic and teratogenic in humans.
The goal of this paper was to develop a process to analyze the content of 16 common PAHs in
grilled pork by mass spectrometry (GC-MS) using standard internal substances. Some
specifications such as sample preparation - analysis conditions, analysis limits (MDL, MQL) and
recovery rates were discussed. Results indicated that the combination of QuECheRS (Quick, Easy,
Cheap, Effective, Rugged and Safe) extraction and GC-MS in SIM mode analysis allowed for
quantification of 16 PAHs in very small concentrations (10 - 100ppb) with recoveries of 83.8 to
113.4% on spiked sample and the limit of detection ranged from 0.3 to 0.8μg/kg.
Keywords: grilled pork, GC-MS, PAHs, QuECheRS
INTRODUCTION
PAHs are found in our living environment and the major route of exposure to humans is
through food. PAHs are found in food chains from production environment (air, soil and water) or
from food processing (Zelinkova & Wenzl, 2015; Ledesma et al., 2014; Orecchio et al., 2009;
Luzardo et al., 2013). Food processing techniques contribute to the increase in PAH levels including
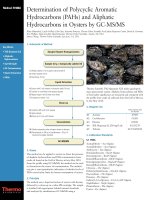
drying, roasting and baking ...(Ledesma et al., 2014; Martin Rose et al., 2015). Sixteen common
PAH compounds are frequently found in environmental monitoring samples and can pose a risk to
human health, as shown in Figure 1.
Currently, many organizations such as the United States Environmental Protection Agency
(U.S.EPA), the European Food Safety Authority (EFSA) and the International Agency for Research
on Cancer (IACR)... have classified PAHs on the list of priority pollutants due to their carcinogenic
and mutagenic properties human (EC., 2006; EFSA., 2008; FDA., 2006). The study by Daniel et al.
50
Thu Dau Mot University Journal of Science
Issue 1(40)-2019
(2011) showed a risk of increased renal cell carcinoma by consuming by beef, boiled meat through
histologic studies. Other studies have shown that Benzo[a]pyrene compounds (BaP) have adverse
and toxic effects on the cells, tissues, development and immune system of animals (Essumang et al.,
2013; Manda et al., 2012).
Napthalene (Nap)
Acenaphthylene (Ap)
Acenaphthene (Ac)
Fluorene (Flr)
Phenanthrene (Phe)
Anthracene (Ant)
Fluoranthene (Flt)
Pyrene (Pyr)
Benzo[a]anthracene (Baa)
Chrysene (Chy)
Benzo[b]fluoranthene (Bbf)
Benzo[k]fluoranthene (Bkf)
Benzo[a]pyrene (BaP)
Indeno[123-cd]pyrene (Ip)
Dibenz[a,h]anthracene (Dba)
Benzo[g,h,i]perylene (BghiP)
Figure 1. Chemical structures for 16 PAHs used in the study
Alomirah et al. (2011) and Alomirah et al. (2010) found that PAHs were highly pathogenic in
roasted vegetables, chicken and smoked foods. Results showed that cancer risk related to the
consumption of food for child, adolescent and adult with 2.63.10-7 and 9.3.10-7 the amount of BaP
respectively. Studies have shown that levels of exposure for human to BaP are 2-500ng/day.
Globally, the average consumption of PAHs ranges from 0.02 to 3.6 μg/person/day, while in
countries such as India, Nigeria and China, it is 11, 6.0 and 3.56 μg/person/day due to the
consumption of fried food by cooking oil (Diggs et al., 2011).
Currently, the number of studies on PAHs in food was limited in Vietnam. Le Hong Dung et
al., (2012) and Tran Cao Son et al., (2016) showed that most samples of food processed by roasting,
frying and baking in Vietnam were contaminated with PAHs, including BaP. Food samples were
found with the level of BaP >2ng/g (European Union Regulations No 2011) including: fish fillets,
51
Nguyen Van Phuc
Determination of polycyclic aromatic hydrocarbons...
salads, fried tofu, grilled meat, fried noodles, grilled chicken and pancake rolls (Le Hong Dung et
al., 2012).
The aim of this study was to understand and develop a method for the analysis of 16 PAHs on
the meat samples, thereby, in the future, evaluating PAHs content on different foods in Ho Chi
Minh City and giving a warning for human health.
MATERIAL AND METHODS
Reagents and materials
Reagents: A mixture of 16 PAHs (2000 mg.L-1 in hexane and a purity of> 99%) was supplied
by Merck (Germany) and stored at 4oC.. Solvents used for sample preparation and analysis process
such as n-hexane, acetonitrile (ACN) were at HPLC grade (Merck). The chemicals: magnesium
sulfate (MgSO4) (Scharlab - USA), sodium chloride (Scharlab - USA), primary secondary amine
(PSA) and octaecylsilane (C18) (Agilent Technologies – USA) were used as absorbed compounds.
Phenanthrene-D10, perylene-D12, chrysene-D12 and acenaphthene-D10 were used as internal
standards for instrumental quantitation.
Materials: PAH analysis was carried out using a gas chromatography equipped with MS
5980C inert XL/CI MSD (Agilent Technologies). In addition, some equipment such as: vortex
machine, centrifuge Hermle Z336 (Germany) and 4-digit Ohaus balance (USA) were used for
sample preparation. All sample preparation equipment (e.g. centrifuge tubes) were washed with
soap and water and rinsed with acetone and n-hexane prior to use and between samples.
Samples: Blank sample was lean pork meat and grilled pork was purchased from a local
grocery store in Tan Phu, Ho Chi Minh City (Figure 2). These samples were used to examine the
sample processing procedures, calculate the PAHs recovery rate and test the method on the actual
samples. The meat samples were cut into small pieces and roasted to a mash, packed in foil bags
and stored in a freezer at -18°C to avoid the decomposition (Fig. 3).
(a)
(b)
(c)
Figure 2. Black sample (a); grilled pork sample (two sides: b and c)
52
Thu Dau Mot University Journal of Science
Issue 1(40)-2019
Figure 3. Blank meat sample (left); grilled meat sample (right) after grinded
Analysis method
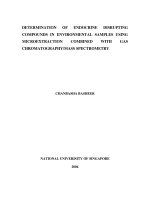
Sample preparation: Sample preparation in this study was followed a QuEChERS (QUick
Easy Cheap Effective Rugged Safe) method (Rejczak & Tuzimski, 2015). Figure 4 shows sample
extraction procedures: firstly, the samples are homogenized then extracted and fractionated using a
mixture of water-ACN and salts (MgSO4, NaCl) in centrifuge tubes. Polar compounds were soluble
in water which was absorbed by the salt mixture.
Homogenized sample
Weigh 5g sample in 50 mL centrifuge tube
Add IS solution, and quality control (QC)
spike solution (if necessary)
Add 5mL of DI water,
10 mL ACN
Vortex 1 min
Add 4g MgSO4
add 1g NaCl
Shake/vortex vigorously for 1 min
Centrifuge 6000 rpm at 5oC for 5 min
Remove the layer on the surface
Transfer the ACN layer to 15mL centrifuge tube
Add 0.9 g MgSO4,
0.3 g PSA, 0.3 g C18
Vortex 1 min, then centrifuge 6000rpm for 5 min
Transfer the ACN layer to an autosampler vial,
dry by N2 gas
Dissolve in 1mL n-hexane, filter by 0,45µm-filter.
Analyze by GC/MS
Figure 4. Sample preparation procedure by QuEChERS method Calibration
53
Nguyen Van Phuc
Determination of polycyclic aromatic hydrocarbons...
PAHs – insoluble/poorly soluble in water – were extracted in ACN solvent and other
compounds were removed by using absorbent (PSA, C18 and MgSO4). This extraction was
shaken/vortexed to increase the contact between the solvent/adsorbent and then separated by a
difference in density when centrifuged. The centrifuge tubes were covered with aluminum foil to
avoid contact with light, reducing the influences to the substances.
The final evaluate was purged with N2 gas to dryness, then dissolved in 1mL n-hexane and
filtered through a 0.45µm filter prior to GC/MS analysis.
Blank sample: Blank meat samples were treated by QuEChERS method (Figure 4) and no
PAHs were added.
Standard samples: Blank meat samples were also treated with QuEChERS, but at the
beginning, mixture of internal standards (phenanthrene-D10, perylene-D12, chrysene-D12 and
acenaphthene-D10) at concentration of 1ppb and mixture of PAHs at concentrations of 10, 25, 50,
75 and 100ppb respectively, were added.
Analysis method: Separation of the compounds was achieved on an Agilent J&W DB-1MS
column (30m x 0.25mm, 0.25μm) with helium (purity> 99.99%) as the carrier gas at a flow rate of
1.2μl/min, mass spectrometer transfer line, source and quadrupole temperatures were 280oC, 230oC
and 150oC respectively. The initial oven temperature was kept at 55oC, 0.5 min hold, ramp to 235oC
at 30oC/ min, then ramp to 300oC at 5oC/min, 0.5 min hold for a total run time of 20min. A 2μL
sample was injected to an inlet by auto sampler system with a pulsed splitless mode.
The MS spectrum analyzed the PAHs in two forms: TIC (total ion current) and SIM
(selective ion monitoring) in positive ion mode (Table 1).
RESULTS AND DISCUSSION
Quality assurance/control
Blank samples: Analytical results of blank meat samples in TIC and SIM modes were
presented in Figure 5. The blank chromatogram showed that there were some compounds such as:
ester, cholesterol ... but no PAHs was detected. Therefore, the blank meat sample could be used for
the calibration curve and the recovery rate.
(a)
54
Thu Dau Mot University Journal of Science
Issue 1(40)-2019
(b)
Figure 5. Chromatogram of the blank meat sample: TIC mode (a) and SIM mode (b)
Calibration
Figure 6 is an example chromatogram generated by spiking the sample blanks. The linear
calibration curves were obtained by plotting the ratio S(i)/SIS for each analytic versus its
concentration ratio C(i)/CIS , where S(i), C(i) is the peak area and concentration of each PAH and IS is
the corresponding internal standard. All curves had coefficients of determination r2 >0.99 with the
calibration range of 10-100ppb (Table 1).
Figure 6. Distribution of PAHs (concentration of 100ppb)
in the spiked sample blank for SIM mode
55
Nguyen Van Phuc
Determination of polycyclic aromatic hydrocarbons...
Table 1. Retention time, monitored SIM ion and regression equation for 16 PAHs by GC-MS
1
Naphthalene
4.51
SIM
ion
(m/z)
128
2
Acenaphthylene
5.77
No
tR
(min)
PAH
r2
Regression equation
Internal
standard (IS)
y = 0.0162x + 0.6698
0.9969 Phenanthrene-D10
152
y = 0.1316x - 0.4261
0.9969 Phenanthrene-D10
y = 0.2074x - 0.4979
0.9985 Phenanthrene-D10
3
Acenaphthene
5.93
153
4
Fluorene
6.34
166
y = 0.5705x + 3.2148
0.9987 Phenanthrene-D10
5
Phenanthrene
7.15
178
y = 0.2717x + 6.3254
0.9988 Phenanthrene-D10
6
Anthracene
7.19
178
y = 0.2734x + 0.4092
0.9997 Phenanthrene-D10
y = 0.3139x + 0.5823
0.9993 Phenanthrene-D10
7
Fluoranthene
8.51
202
8
Pyrene
8.82
202
y = 0.2654x - 0.4807
0.9997 Phenanthrene-D10
9
Benz[a]anthracene
11.15
228
y = 0.3636x - 0.9548
0.9985
Chysene-D12
10
Chrysene
11.23
228
y = 0.4572x - 0.8096
0.9993
Chysene-D12
y = 0.5538x - 0.6097
0.9990
Perylene-D12
11
Benzo[b]fluoranthene
14.02
252
12
Benzo[k]fluoranthene
14.08
252
y = 0.6886x - 0.5331
0.9979
Perylene-D12
13
Benzo[a]pyrene
14.85
252
y = 0.4294x - 0.3898
0.9998
Perylene-D12
14
Indeno[1,2,3_cd]pyrene
18.12
276
y = 0.1171x - 0.3482
0.9970
Perylene-D12
y = 0.3600x - 0.3985
0.9970
Perylene-D12
y = 0.2278x - 0.1975
0.9980
Perylene-D12
15
Dibenz[a,h]anthracene
18.21
278
16
Benzo[g,h,i]perylene
18.78
276
Recovery, reproducibility and the analysis limits
The recovery and reproducibility (RSD) were evaluated on spiked samples at concentration
of 10ppb and in replicates of five. The results analysis in Table 2 showed that the recoveries of 16
PAHs varied from 83.3% to 115.5% and the reproducibility (RSD) was 2.7% to 14.9%. These
relatively high values suggested that recoveries of PAHs were highly complex when the sample
matrix was in food form. This result was similar with some studies over the world on PAH analysis
in foods (Martin Rose et al., 2015; Alomirah et al., 2011; Ge Li et al., 2016).
Table 2. Recoveries, RSDs, limits of detection and quantification (MDL – MQL)
No
1
2
3
4
5
6
7
8
9
10
11
PAH
Naphthalene
Acenaphthylene
Acenaphthene
Fluorene
Phenanthrene
Anthracene
Fluoranthene
Pyrene
Benzo(a)anthracene
Chrysene
Benzo(b)fluoranthene
Recovery
(%)
RSD
(%)
87.0
87.3
83.3
97.9
104.7
91.3
88.5
112.4
107.8
109.1
113.4
6.5
6.5
14.0
7.9
9.1
11.6
14.9
10.4
5.7
12.9
2.7
56
Analysis limits
MDL
MQL
(µg/kg)
(µg/kg)
0.4
1.2
0.4
1.2
0.3
1.0
0.3
1.0
0.6
1.8
0.4
1.3
0.8
2.3
0.3
0.9
0.4
1.1
0.5
1.4
0.3
1.0
Thu Dau Mot University Journal of Science
Issue 1(40)-2019
12
13
14
15
Benzo(k)fluoranthene
Benzo(a)Pyrene
Indeno(1,2,3_c,d)pyrene
Dibenzo(a,h)anthracene
97.2
98.5
115.5
111.8
8.7
6.0
7.9
12.5
0.6
0.4
0.5
0.4
1.7
1.1
1.5
1.2
16
Benzo(g,h,i)perylene
111.1
11.0
0.4
1.2
The analytical limits of the method were obtained by reducing the PAHs concentration in
spike samples. The detection limit (MDL) and the quantitative limit (MQL) of the method were
estimated from the signal-to-noise ratio (S/N) of 3 and 10 respectively. In this study, the limits of
detection ranged from 0.3μg/kg to 0.8 μg/kg, which were satisfied with determination the low levels
of PAHs in food.
Method application on actual meat samples
PAHs are usually formed during food processing (drying, smoking) and food cooking at high
temperature (grilling, frying, roasting, baking) (Ledesma et al., 2014; Martin Rose et al., 2015).
Therefore, in this study some samples of grilled pork were used to test the analytical method by
determining PAHs content (Table 3).
Table 3. PAH concentration (ppb) in some grilled pork samples
Concentration
(ppb)
PAH
Naphthalene
Acenaphthylene
Acenaphthene
Fluorene
Phenanthrene
Anthracene
Fluoranthene
Pyrene
Benz[a]anthracene
Chrysene
Benzo[b]fluoranthene
Benzo[k]fluoranthene
Benzo[a]pyrene
Dibenz[a,h]anthracene
Indeno[1,2,3_c,d]pyrene
Benzo[g,h,i]perylene
Total 16 PAHs (ppb)
Samle 1
Sample 2
Sample 3
Sample 4
0.70
0.78
0.21
0.43
0.00
0.00
0.00
0.04
0.00
0.41
0.00
0.00
0.00
0.22
0.00
0.00
2.79
18.56
0.09
0.08
3.10
5.33
0.85
0.76
0.69
0.03
0.00
0.00
0.00
0.00
0.00
0.00
0.00
29.49
0.26
13.74
0.46
1.63
10.71
2.48
5.85
7.88
0.65
1.26
1.78
1.41
1.03
0.00
1.43
1.18
51.76
13.27
14.23
0.71
2.23
12.51
2.70
6.22
8.24
0.66
1.31
1.85
1.46
0.97
0.00
1.49
1.09
68.93
Results showed that there was the formation of PAH compounds in pork after grilling. The
total 16 PAHs concentrations increased from 2.79ppb to 68.93ppb when an increase in grilling
temperature and time was applied from sample 1 to sample 4. According to European Regulations,
the permitted levels of PAHs in meat products are: total PAHs <35μg/kg and benzo[a]pyrene
<2μg/kg (EC., 2006; EFSA., 2008). Thus, the third and fourth samples were likely to affect the
health of the consumer, especially in the case of frequently consumption of grilled meat. This
results were similar with some studies in the world when they found the high content of PAHs
produced by baking meat (Ledesma et al., 2014; Martin Rose et al., 2015; Essumang et al., 2013;
Alomirah et al., 2011).
57
Nguyen Van Phuc
Determination of polycyclic aromatic hydrocarbons...
CONCLUSION
The research had successfully developed the PAHs analysis process in meat products by
combining QuEChERS extraction and GC-MS analysis. The procedure used internal standard
reagents to quantify PAHs with a linear concentration from 10 to 100ppb and coefficients of
determination r2 > 0.99. In addition, the limit of detection for PAHs concentrations (0.3-0.8ppb)
allowed the quantification of the small level of PAHs present in food. Therefore, the method should
be applied and developed for related studies such as level of PAHs pollution in soil, water samples,
different matrix foods...
REFERENCES
Zuzana Zelinkova and Thomas Wenzl (2015). The Occurrence of 16 EPA PAHs in Food – a
Review. Polycyclic Aromatic Compounds, Taylor & Francis, (35), 248–284. doi:
10.1080/10406638.2014.918550.
Ledesma E., Rendueles M., and D. M., (2014). Benzo(a)pyrene penetration on a smoked meat
product during smoking time. Food Additives & Contaminants, 31(10), 1688-1698.
Orecchio S., Ciotti V. P., and C. L., (2009). Polycyclic aromatic hydrocarbons (PAHs) in coffee
brew samples: Analytical method by GC-MS, profile, levels and sources. Food and Chemical
Toxicology, 47(4), 819–826.
Luzardo O. P. et al.,( 2013). Influence of the method of production of eggs on the daily intake of
polycyclic aromatic hydrocarbons and organochlorine contaminants: An independent study in
the Canary Islands (Spain). Food and Chemical Toxicology, (60), 455–462.
Martin Rose, Joe Holland, Alan Dowding, Steve (R.G.) Petch, Shaun White, Alwyn Fernandes,
David Mortimer (2015). Investigation into the formation of PAHs in foods prepared in the
home to determine the effects of frying, grilling, barbecuing, toasting and roasting. Food and
Chemical Toxicology, (78), 1–9.
European Commission (EC) 2006. Commission regulation no 1881/2006 of 19 December 2006.
Setting maximum levels for certain contaminants in foodstuffs. Official Journal of the
European Union, L364/5. 2006.
European Food Safety Authority (EFSA) (2008). Scientific opinion of the panel on contaminants in
the food chain on a request from the European commission on polycyclic aromatic
hydrocarbons in food. The EFSA Journal, (724), 1–114.
Lauren Posnick Robin, Cơ quan Thực phẩm và Dược phẩm Mỹ (FDA). Sc.D.Series, 2006.
Daniel C. R. et al., (2011). Meat-cooking mutagens and risk of renal cell carcinoma. British Journal
of Cancer, 105(7), 1096–1104.
Essumang D. K., Dodoo D. K., and J.K. Adjei (2013). Effect of smoke generation sources and
smoke curing duration on the levels of polycyclic aromatic hydrocarbon (PAHs) in different
suites of fish. Food and Chemical Toxicology, (58), 86–94.
Manda P. et al., (2012). Evaluation of polycyclic aromatic hydrocarbons (PAHs) content in foods
sold in Abobo market, Abidjan, Côte d’Ivoire. Journal of Toxicology and Environmental
Health Sciences, 4(6), 99–105.
Alomirah H. et al., (2011). Concentrations and dietary exposure to polycyclic aromatic
hydrocarbons (PAHs) from grilled and smoked foods. Food Control, 22(12), 2028–2035.
58
Thu Dau Mot University Journal of Science
Issue 1(40)-2019
Alomirah H. et al., (2010). Benzo[a]pyrene and total polycyclic aromatic hydrocarbons (PAHs)
levels in vegetable oils and fats do not reflect the occurrence of the eight genotoxic PAHs.
Food Additives & Contaminants. Part A Chemistry, Analysis, Control, Exposure & Risk
Assessment, 27(6), 869–878.
Diggs D. L. et al., (2011). Polycyclic aromatic hydrocarbons and digestive tract cancers: a
perspective. Journal of Environmental Science and Health. Part C, Environmental
Carcinogenesis & Ecotoxicology Reviews, 29(4), 324–357.
Lê Hồng Dũng và ctv., (2012). Đánh giá mức độ ô nhiễm các chất gây ung thư nhóm polycyclic
aromatic hydrocarbon (PAH) trong thực phẩm ở Hà Nội và Thành phố Hồ Chí Minh.
Trần Cao Sơn, Lê Thị Hồng Hảo, Nguyễn Thị Tâm, Lê Đình Chi (2016). Simultaneous
determination of 16 polyaromatic hydrocarbons in meat and meat products by gas
chromatography tandem mass spectrometry. Tạp chí phân tích Hóa, Lý và Sinh học, 21(4).
Tomasz Rejczak, Tomasz Tuzimski (2015). A review of recent developments and trends in the
QuEChERS sample preparation approach. Open Chem, (13), 980 –1010.
Ge Li, Shimin Wu, Lin Wang, Casimir C. Akoh (2016). Concentration, dietary exposure and health
risk estimation of polycyclic aromatic hydrocarbons (PAHs) in youtiao, a Chinese traditional
fried food. Food Control, (59), 328–336.
59