Physical fitness among urban and rural Ecuadorian adolescents and its association with blood lipids: A cross sectional study
Bạn đang xem bản rút gọn của tài liệu. Xem và tải ngay bản đầy đủ của tài liệu tại đây (664.59 KB, 11 trang )
Andrade et al. BMC Pediatrics 2014, 14:106
/>
RESEARCH ARTICLE
Open Access
Physical fitness among urban and rural
Ecuadorian adolescents and its association with
blood lipids: a cross sectional study
Susana Andrade1,2*, Angélica Ochoa-Avilés1,2, Carl Lachat2,3, Paulina Escobar1, Roosmarijn Verstraeten2,3,
John Van Camp2, Silvana Donoso1, Rosendo Rojas1, Greet Cardon4 and Patrick Kolsteren2,3
Abstract
Background: Physical fitness has been proposed as a marker for health during adolescence. Currently, little is
known about physical fitness and its association with blood lipid profile in adolescents from low and
middle-income countries. The aim of this study is therefore to assess physical fitness among urban and rural
adolescents and its associations with blood lipid profile in a middle-income country.
Methods: A cross-sectional study was conducted between January 2008 and April 2009 in 648 Ecuadorian
adolescents (52.3% boys), aged 11 to 15 years, attending secondary schools in Cuenca (urban n = 490) and Nabón
(rural n = 158). Data collection included anthropometric measures, application of the EUROFIT battery, dietary intake
(2-day 24 h recall), socio-demographic characteristics, and blood samples from a subsample (n = 301). The
FITNESGRAM standards were used to evaluate fitness. The associations of fitness and residential location with blood
lipid profile were assessed by linear and logistic regression after adjusting for confounding factors.
Results: The majority (59%) of the adolescents exhibited low levels of aerobic capacity as defined by the
FITNESSGRAM standards. Urban adolescents had significantly higher mean scores in five EUROFIT tests (20 m
shuttle, speed shuttle run, plate tapping, sit-up and vertical jump) and significantly most favorable improved plasma
lipid profile (triglycerides and HDL) as compared to rural adolescents. There was a weak association between blood
lipid profile and physical fitness in both urban and rural adolescents, even after adjustment for confounding factors.
Conclusions: Physical fitness, in our sample of Ecuadorian adolescents, was generally poor. Urban adolescents had
better physical fitness and blood lipid profiles than rural adolescents. The differences in fitness did not explain those
in blood lipid profile between urban and rural adolescents.
Keywords: Adolescent, Physical fitness, Urban health, Dyslipidemia, Ecuador
Background
Non-communicable disease, predominantly cardiovascular
disease and type II diabetes, have become leading causes
of death and disability, accounting for 80% of total
deaths in low- and middle-income countries worldwide
[1]. Current evidence indicates that the development of
non-communicable disease starts early in life [2] and is
associated with poor physical fitness, low physical activity
* Correspondence:
1
Food Nutrition and Health Program, Universidad de Cuenca, Avenida 12 de
Abril s/n Ciudadela Universitaria, Cuenca, Ecuador EC010107
2
Department of Food Safety and Food Quality, Ghent University, Coupure
Links 653, 9000 Ghent, Belgium
Full list of author information is available at the end of the article
levels [3] and inadequate diet [4]. Physical fitness has a
closer association to the occurrence of both cardiovascular
disease, and cardiovascular risk factors, than do physical
activity levels [3,5]. Physical fitness, in contrast to physical
activity, is stable over several months within an individual
[6] and has therefore been proposed as a marker for
cardiovascular risk in children and adolescents [7].
Recently, low- and middle-income countries have experienced a rapid increase in the development of risk factors
for non-communicable disease among young people.
Ecuador is no exception. A recent study in a group of
urban and rural Ecuadorian adolescents [8] reported
that dyslipidemia, abdominal obesity and overweight
© 2014 Andrade et al.; licensee BioMed Central Ltd. This is an Open Access article distributed under the terms of the Creative
Commons Attribution License ( which permits unrestricted use, distribution, and
reproduction in any medium, provided the original work is properly credited. The Creative Commons Public Domain
Dedication waiver ( applies to the data made available in this article,
unless otherwise stated.
Andrade et al. BMC Pediatrics 2014, 14:106
/>
were prevalent in 34.2%, 19.7% and 18.0% of the population. Although elevated levels of dyslipidemia were
found in both urban and rural populations, dyslipidemia
was higher in the rural group. Unexpectedly, a previous
analysis showed that dietary intake was weakly associated with plasma lipid (Ochoa–Aviles unpublished
data). Therefore, it was hypothesized that an association
of blood lipids with physical fitness is probable, and is a
dimension of analysis that could further be explored.
There are few studies that have assessed physical fitness [9-13] and its association with cardiovascular risk
factors in low- and middle- income countries [14]. In
fact, only a single study in adolescents has investigated
a comprehensive assortment of physical fitness components such as: speed, muscular endurance/strength,
cardio-respiratory endurance and flexibility [11], and
only one has assessed the association of cardiorespiratory
fitness with dyslipidemia [14]. To the author’s knowledge
no studies thus far have assessed associations of blood
lipid levels with a similar variety of fitness components
(speed, muscular strength endurance, cardio-respiratory
endurance, flexibility and balance) according to residential
location (rural vs. urban). This is surprising considering
incidence of cardiovascular risk factors is known to vary
along with environmental factors, such as location of residence (urban vs. rural areas) [15]. Rural areas differ considerably to urban areas, i.e. in terms of available health
services, medical specialists [15], sport facilities or recreational areas [16], transportation (traffic and means of
transport), safety issues [17], food availability [4] and formal education, among others [15].
This study has two objectives: i) to assess the physical
fitness in a group of urban and rural Ecuadorian adolescents and ii) to analyze the associations of physical fitness
and lipid profile in adolescents according to residential
location.
Page 2 of 11
grouped in six strata according to (i) their classification
(public or private school) and (ii) school gender (male
only, female only and co-ed schools). In the first stage
of sampling, 30 schools were selected with a probability
proportionate to student population. In the second stage,
all students between 8th and 10th grade were listed, and
out of this sample 30 adolescents were randomly selected
within each school. In the rural area, all children from 8th,
9th and 10th grade attending all four schools of Nabón
were invited to participate.
Data on physical fitness were obtained from a sample of
158 and 490 in rural and urban adolescents, respectively.
There were no differences in mean age (P = 0.62) or BMI
(P = 0.36) between the total population and the sample of
adolescents who agreed to participate in the fitness test.
Power analysis showed that this sample size was sufficient
to estimate the physical fitness with a precision of 11.4%
and a power of 80%. A volunteering sub-sample of 301
adolescents from both the rural (n = 90) and the urban
(n = 211) area provided blood samples to determine biochemical parameters.
Ethical approval
Ethical committees from Universidad Central in QuitoEcuador and the Ghent University Hospital Belgium approved the protocols for anthropometry, physical fitness
and biochemical determinations (Nr 125 2008/462 and
2008100–97 respectively). Adolescents (acceptance rate
85%) and their parents or guardians (participation rate
90%) provided written consent for the study. Overall, adolescents were excluded from the sampling if they had
reported a concomitant chronic disease that interfered
with their normal diet and physical activity, had physical
disabilities or were pregnant. In the assessment of physical fitness, adolescents with chronic muscle pain or
bone fractures were not able to perform any of the tests
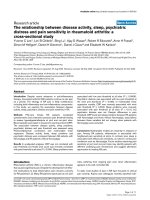
(Figure 1).
Methods
Participants
Outcome measurements
Data were collected in Cuenca city and Nabón canton,
which are both located in the Azuay province in the
south of Ecuador at 2550 and 3300 meters above sea
level, respectively. Cuenca is considered an urban area,
as 60% of the 505,000 habitants are city dwellers, while
Nabón is in a rural area with approximately 90% of
15,000 inhabitants living in the surrounding rural areas.
Data from the National Institute of Statistics in Ecuador
indicate that the estimated prevalence of poverty is substantially higher in Nabón compared to Cuenca (93% vs.
2% respectively) [18].
This cross-sectional study involved 773 students between the ages of 10 to 16 years old (Figure 1). A twostage cluster sampling of schools and classes was used
to select adolescents in the urban area. Schools were
Prior to data collection, medical doctors, nutritionists
and health professionals were trained for three full days
to assess outcomes: anthropometrics, physical fitness, unsatisfied basic needs and 24 hour recall questionnaires. A
manual with standardized procedures was developed for
the purpose of the study and used during the training.
Two biochemists were in charge of collecting and analyzing blood samples.
Anthropometrics
Anthropometric variables were measured in duplicate by
two independently trained staff following standardized
procedure [19]. The children wore light clothes, no
shoes and field workers made efforts to optimize the
privacy of the participants. Height was measured using a
Andrade et al. BMC Pediatrics 2014, 14:106
/>
Page 3 of 11
Figure 1 Flowchart for sample selection of study participants, Cuenca and Nabón, Ecuador 2009.
mechanical stadiometer model SECA 216 and recorded
to the nearest mm. Weight was measured using a digital
balance model SECA 803 and recorded to the nearest
100 g. The BMI (calculated as weight/height2) was used
to adjust the association between blood lipid and physical fitness parameters.
Physical fitness
Physical fitness was measured using the EUROFIT [20]
test battery, which is considered a valid and standardized
test for adolescents [21]. The reliability and validity of
fitness tests in adolescents has been widely documented
[11,21-24]. EUROFIT is a valid method to evaluate fitness
components [25], it offers advantages over other objective
methods such as AAPHERD, CAHPER and Canadian as it
assesses health-related fitness [25,26]. Furthermore, this
test is easy to apply and can be performed in large groups,
and requires few materials. A potential disadvantage of
EUROFIT could be that scoring might be considered subjective, since practice and motivation levels can influence
the score attained [20].
In each school the EUROFIT [20] test battery was used
to assess different dimensions of physical fitness with nine
tests: cardio-respiratory endurance (shuttle run 20 m measured in laps), strength (handgrip measured in kilogram-
force and vertical jump measured in centimeter), muscular
endurance (bent arm hang measured in seconds and situps measured in the number of sit-ups/30 seconds),
speed (shuttle run 10x5 m measured in seconds and
plate tapping as time needed to complete 25 cycles),
flexibility (sit and reach measured in centimeter) and
balance (flamingo balance measured as the number of
tries needed to keep balance for the duration of one minute). High scores indicate higher levels of physical fitness, apart from the shuttle run 10 × 5 m, plate tapping
and flamingo balance, for which lower scores indicate a
higher level of fitness. The physical fitness assessment
lasted approximately two hours per school. At the end
of each testing day, all forms used for data collection
were taken up and revised by the supervisors. In case of
missing registration forms, the researcher returned to
the school to collect them. A total of 125 (16.2%) adolescents did not perform the fitness tests, most of them
declined to participate (n = 91), or had otherwise experienced bone/muscle injury (n = 18) or had changed schools
(n = 13) (Figure 1).
The FITNESSGRAM standards [27] for age and gender
were used to classify adolescents into those who had
reached the Healthy Fitness Zone, defined as the minimum
level of aerobic capacity (in ml/kg/min units of VO2max)
Andrade et al. BMC Pediatrics 2014, 14:106
/>
that provides protection against health risks associated
with inadequate fitness. Aerobic capacity was determined
according to the results of the aerobic capacity test (20 m
shuttle run). For girls, standards values range from
40.2 ml/kg/min to 38.8 ml/kg/min across the developmental transition, 11 to 17 years old. For boys, values
start around 40.2 ml/kg/min, rising to 44.2 ml/kg/min
[27]. To obtain the VO2max from the result of the 20 m
shuttle run, the following validated equation was used
VO2max = 41.77 + 0.49 (laps) - 0.0029 (laps)2 - 0.62
BMI + 0.35 (gender* age); where gender = 0 for girls, 1
for boys [28].
Unsatisfied Basic Needs (UBN)
The Integrated Social Indicator System for Ecuador was
used to determine the socio-economic status per adolescent household. We adopted this method to enhance
comparability of our findings with national data. The
method classifies a household as “poor” when one or
more deficiencies in access to education, health, nutrition, housing, urban services (electricity, potable water
or waste recollection) and employment is reported. All
households with one, or no deficiencies, are classified as
“better off”. The unsatisfied basic needs data were used
to adjust the analysis the associations of physical fitness
and blood lipid parameters.
Energy intake
A detailed description of the dietary intake is described
elsewhere (Ochoa-Aviles unpublished data). The food intake data (total energy intake in particular) were used
primarily to adjust the associations of the physical fitness
and blood lipid parameters. To estimate food intake two
interview-administered 24 h dietary recalls were taken,
the first in a weekday and second on the weekend. The
procedures used to assess the dietary intake were in line
with the recommendations of current literature [29].
Local utensils were selected in order to standardize food
portion size. The Ecuadorian food composition database
is considered outdated, and therefore was not used. Following food composition databases were used instead: U.S
(USDA, 2012), Mexican (INNSZ, 2012), Central America
(INCAP/OPS, 2012) and Peruvian (CENAN/INS, 2008).
The data was entered in Lucille, a food intake program
developed by Gent University (Gent University, http://
www.foodscience.ugent.be/nutriFOODchem/foodintake,
Gent, Belgium). The energy intake was analyzed using Stata
version 11.0 (Stata Corporation, Texas, USA).
Blood lipid profile
After an overnight fast of minimum 8 hours, a blood sample of 10 ml was collected by venipuncture at the antecubital vein. The blood samples were kept on ice without
anticoagulant. Subsequently, serum was separated by two
Page 4 of 11
centrifugations at 4000 rpm for 5 min. Serum total cholesterol (TC; CHOD-PAP kit, Human, Wiesbaden-Germany)
and triglycerides (TG; GPO-PAP kit, Human, WiesbadenGermany) were analyzed by a calorimetric enzymatic
method [30] on a Genesys 10 Thermo Scientific spectrophotometer (Madison, Wisconsin-USA). High-density
lipoprotein cholesterol (HDL) was separated after sodium
phosphotungstate-magnesium chloride precipitation [31].
The Friedewald formula was used to calculate low-density
lipoprotein cholesterol (LDL) [32].
The intra-assay and inter-assay coefficients of variation for serum total cholesterol were 3.3% and 5.3%
and for triglycerides, 5.7% and 0.9% respectively. The
acceptable level was for TC < 170 mg/dl, TG < 150 mg/dl,
HDL > 35 mg/dl and LDL < 110 mg/dl. The acceptable
levels for TC, HDL and LDL were in accordance with
guidelines of the National Cholesterol Education Program
[33] for children and adolescents, while the acceptable
level of TG complies with the consensus definition of
metabolic syndrome in children and adolescents [34].
Adolescents were classified as having dyslipidemia when
at least one of the lipid profile parameters reached risk
level [35].
Data quality and analysis
Data were entered in duplicate into EpiData (EpiData
Association, Odense, Denmark) by two independent researchers and cross-checked for errors. Any discrepancy
was corrected using the original forms. Data were analyzed using Stata version 11.0 (Stata Corporation, Texas,
USA). The analysis was adjusted for the cluster sampling
design by using the Stata svy command and the level of
significance was set at p < 0.05. Normality of data was
checked using the skewness and kurtosis test. Dependent
variables that were not normally distributed were log
transformed before inclusion in the models. In this case,
beta coefficients were back transformed and expressed
as percentage differences (estimate-1*100). Prior to analysis, differences between the total sample and subsample
with blood parameters were evaluated using a t-test for
numerical data and chi-square test for categorical data.
The characteristics of sample and outcomes of the study
are presented as mean (standard deviation) by gender and
location of residence (rural/urban).
Linear regression models were used for continuous
outcomes to test: (i) differences in physical fitness, blood
lipid profile and anthropometric variables by gender and
by residential location, all of which were adjusted by
BMI and gender, when appropriate, (ii) physical fitness
differences among adolescents who did, or did not, reach
the Healthy Fitness Zone adjusted by BMI and gender,
(iii) associations between physical fitness and BMI (model:
Fitness = β0 + β1 residential location + β2 gender + β3
BMI + β4UBN + β5BMI*residence + е), and (iv) associations
Andrade et al. BMC Pediatrics 2014, 14:106
/>
between blood lipid level with physical fitness (model:
Lipids = β0 + β1fitness + β2 residential location + β3gender +
β4BMI + β5UBN + β6energy intake per person + β7fitness*
residence + е). Logistic regression was used to test the association of physical fitness with dyslipidemia. The associations of physical fitness with BMI and blood lipid were
stratified for residential location when interaction terms
were significant (pinteraction < 0.1). As this study was exploratory and not confirmatory, we did not adjust for multiple testing [36]. Nevertheless, we also report our results
on associations between blood lipid profiles and EUROFIT
tests after applying a Bonferroni correction using an
adjusted p-value of 0.005.
Results
In this study data from 648 adolescents were analyzed
(83.3% of total sample). The average age was 13.6 ±
1.2 years and 52.3% of the population was male. In the
rural area, more females (61.4%; n = 97) participated
(p < 0.001) than in the urban area (43.3%; n = 212). According to the result of the aerobic capacity test, 59%
of the adolescents (55.0% urban and 73.5% rural) fell
below the Healthly Fitness Zone. Physical fitness with
respect to the other EUROFIT tests was lower among
adolescents whose aerobic capacity was below the Healthy
Fitness Zone, with significant differences in all tests
(p < 0.05) except for the plate tapping (p = 0.12).
There was no significant difference in mean age (p =
0.54), BMI (p = 0.35), cardiopulmonary fitness (p = 0.99),
speed shuttle run (p = 0.44), plate tapping (p = 0.71), sit
and reach test (p = 0.54), sit-up (p = 0.30), vertical jump
(p = 0.89), bent arm hang (p = 0.11), handgrip (p = 0.55)
and flamingo (p = 0.09) tests between the subsample
providing blood samples and the total population that
participated in physical fitness assessment. Only the gender balance (p = 0.03) was marginally different between
the subsample who provided blood sample and the
whole sample (52.8% girls in the subsample versus 47.7%
girls in the total sample).
Differences in physical fitness, anthropometric indexes
and blood lipids by gender and by residence are shown
in Table 1. After adjusting for BMI, boys showed higher
levels of cardiorespiratory, speed, strength, endurance
and balance in all EUROFIT tests compared with girls,
except for the sit and reach test (p < 0.01). Blood lipid
levels, however, showed no significant gender differences, with the exception of triglyceride levels (p = 0.03),
which were higher in girls, after adjustment for BMI. With
respect to residential location, urban adolescents had a
higher mean score in the 20 m shuttle test (p = 0.01),
speed shuttle run (p < 0.01), plate tapping (p < 0.01), sit-up
(p < 0.01) and vertical jump (p < 0.01). In terms of
blood lipid profiles, mean triglycerides (p = 0.02) and
HDL (p < 0.01) revealed urban adolescents had an
Page 5 of 11
improved blood lipid profiles as compared to rural adolescents. Therefore, the proportion of the population
with dyslipidemia was significantly lower in the urban
area than in the rural area (28.9% vs. 46.7%, P < 0.01).
The associations between fitness and BMI are shown in
Table 2. The interaction in terms of BMI-residence was
significant for speed shuttle run, plate tapping, sit up, vertical jump, bent arm hang and the proportion adolescents
who reached the Healthy Fitness Zone. In the total sample, BMI was significantly associated with low performance on the 20 m shuttle test and flamingo, and with high
performance on hang grip (p < 0.01 for all tests). When
the associations between the fitness tests and BMI were
analyzed according to residential location, the results
showed that the proportion of adolescents that reach the
Healthy Fitness Zone in both urban and rural areas decreased significantly as mean BMI increased. In addition,
in both rural and urban areas the improved scores the performance on the speed shuttle run and longer duration of
bent arm hang were significant, and inversely associated
with BMI. In both areas, the associations between BMI
with plate tapping and vertical jump test were not significant. The only difference, when considering residential
location, was the association between the sit up test and
BMI which was only significant in urban adolescents.
The interaction terms of residence x physical fitness
were highly significant for cholesterol and LDL. The
interaction term for cholesterol was significant with five
EUROFIT tests, while for LDL, interaction terms were
significant with four EUROFIT tests. In addition, the association between cholesterol/LDL with the proportion
of adolescents who reached the Healthy Fitness Zone
was significantly different between urban and rural adolescents (Table 3).
The associations between the physical fitness tests and
blood lipid profile were weak (Table 4). Overall, dyslipidemia was negatively related to performance in bent arm
hang. There were also significant associations between
the plate-taping test with HDL and triglycerides. As time
increased in seconds for the EUROFIT test, HDL decreased and triglycerides increased. In the urban area
there was an inverse association of bent-arm-hang and
handgrip with cholesterol and LDL. In the rural area, adolescents who reached the Healthy Fitness Zone according to the FITNESSGRAM standards had significantly
lower cholesterol and LDL levels. Although, after the
Bonferroni correction only the association between cholesterol levels and the adolescents who reached the Healthy
Fitness Zone according to the FITNESSGRAM standards
remained significant.
Discussion
To our knowledge, this is the first study in a middleincome country that estimates physical fitness in urban
Andrade et al. BMC Pediatrics 2014, 14:106
/>
Page 6 of 11
Table 1 Anthropometry, physical fitness and blood lipids of Ecuadorian adolescents stratified by gender and by
residential location
Boys
n
Girls
Mean (SD)
n
Pa
Urban
Mean (SD)
n
Mean (SD)
Pb
Rural
n
Mean (SD)
Age
334 13.6 (1.2)
306 13.6 (1.2)
0.36
487 13.7 (1.1)
153 13.5 (1.5)
0.48
Body mass index (kg/m^2)
334 19.9 (3.1)
306 20.5 (3.0)
0.02
482 20.3 (3.1)
158 20.0 (2.9)
0.39
Weight (kg)
336 45.9 (10.3)
307 45.3 (8.3)
0.76
485 46.7 (9.5)
158 42.3 (8.3)
<0.01
Height (cm)
336 151.6 (10.3) 307 149.1 (6.9)
<0.01 485 151.9 (8.7)
158 145.9 (7.9)
<0.01
20 m shuttle test (laps)
313 3.6 (1.4)
285 2.8 (0.9)
<0.01 442 3.4 (1.3)
156 2.7 (0.9)
0.01
20 m shuttle test (ml/kg/min)
303 43.0 (5.0)
279 35.4 (3.9)
<0.01 431 40.2 (6.0)
151 37.1 (5.0)
0.02
279 15.1 (35.8)
<0.01 431 45.0 (49.8)
151 26.5 (44.3)
0.19
Physical fitness
Cardiopulmonary fitness
FITNESSGRAM (% who are on the Healthy Fitness Zone) 303 63.4 (48.3)
Speed-agility
Speed shuttle run (s)
338 23.3(2.0)
309 26.6 (2.7)
<0.01 489 24.4 (2.6)
158 26.3 (3.2)
<0.01
Plate tapping (s)
339 14.6 (2.1)
309 17.0 (2.5)
<0.01 490 15.3 (2.2)
158 17.2 (3.0)
<0.01
338 19.0 (6.6)
309 20.4 (7.0)
<0.01 489 19.4 (6.8)
158 20.5 (6.7)
0.52
Sit-up (number/30 s)
337 16.1 (3.7)
308 11.4 (3.9)
<0.01 488 14.7 (4.2)
157 11.4 (4.3)
<0.01
Vertical jump (cm)
337 29.1 (6.8)
308 23.6 (5.7)
<0.01 487 27.9 (6.5)
158 22.4 (6.2)
<0.01
Bent arm hang (s)
332 10.0 (9.1)
308 3.2 (3.0)
<0.01 483 7.3 (7.8)
157 7.1 (8.4)
0.21
Handgrip (kgf)
338 24.7 (8.0)
309 20.4 (4.8)
<0.01 489 23.2 (7.1)
158 21.2 (6.3)
0.35
322 13.8 (5.4)
285 15.4 (5.2)
0.02
143 14.7 (5.5)
0.99
Flexibility
Sit and reach (cm)
Muscle strength and endurance
Balance
Flamingo (trying/1 min)
464 14.5 (5.3)
Blood lipid profile
Cholesterol (mg/dL)
142 144.8 (32.7) 159 147.8 (31.7) 0.65
211 144.5 (31.3) 90
159.7 (33.8) 0.53
HDL (mg/dL)
142 51.1 (12.8)
159 48.6 (11.5)
0.24
211 51.1 (11.9)
90
46.6 (12.4)
<0.01
LDL (mg/dL)
142 75.3 (30.9)
159 78.4 (26.8)
0.66
211 74.7 (28.1)
90
82.1 (30.0)
0.42
Triglyceride
142 91.9 (48.0)
159 104.2 (58.4) 0.04
211 93.6 (54.3)
90
109.5 (52.0) 0.02
a
p-value adjusted for BMI and clustering, bp-value adjusted for gender and clustering.
and rural adolescents and explores its associations with
blood lipid profiles. The findings show that more than
half of the sample exhibits unhealthy levels of physical
fitness. Furthermore, adolescents who had a low aerobic
capacity as defined by the FITNESSGRAM had lower
scores for physical tests, such as speed-agility, flexibility,
muscle strength-endurance and balance. Our findings
also show that urban adolescents were fitter than rural
adolescents for five of the fitness test. Nevertheless, these
differences in physical fitness did not explain those in lipid
profile between urban and rural adolescents.
Two out of three Ecuadorian adolescents in our sample
had early cardiovascular risk, defined by low aerobic capacity (20 m shuttle run). This proportion was higher than
the proportion reported in Spanish [37] and Portuguese
[38] adolescents. Furthermore, the group of adolescents
who had a lower aerobic capacity also showed lower
scores for other physical fitness components such as
muscle strength and endurance. Previous research indicates that such low fitness levels can linger on into
adulthood [39] where low cardiorespiratory fitness
[40] or low muscular strength [41] is associated with
increased mortality risk.
In general, the absolute physical fitness of our population was worse than estimates in the majority of previous studies. Adolescents from our sample had a lower
cardiopulmonary performance (3.2 ± 1.3 laps) compared
with Spanish [42] (6.1 ± 2.0 laps) and Belgian [43] (6.3 ±
2.3 laps) adolescents. The estimates from the speed agility components of the physical test (speed shuttle run
10 × 5 m, plate taping) were also lower compared with
Spanish [42], Greek [44], Polish [45] and Belgian [43]
adolescents [42-45]. The sit and reach scores were lower
than those from Mexico [11], Spain [42], Poland [45] or
Andrade et al. BMC Pediatrics 2014, 14:106
/>
Page 7 of 11
Table 2 Association between physical fitness and BMI of Ecuadorian adolescents stratified by residential location
Physical fitness
Interaction BMI & residence
All
pa
Β%
pa
Urban
Β%
pa
Rural
Β%
pa
20 m shuttle test (laps)
0.24
−2.39
<0.01
-
-
-
-
FITNESSGRAM (% who are on the Healthy Fitness Zone)
0.02
-
-
−6.49
<0.01
−3.82
0.03
<0.01b
-
-
0.47
<0.01
0.92
<0.01
b
<0.01
-
-
−0.13
0.52
0.90
0.11
0.63
−0.14
0.77
-
-
-
-
Sit-up (number/30 s)
0.09b
-
-
−1.60
<0.01
−2.50
0.20
Vertical jump (cm)
0.06b
-
-
−0.70
0.11
1.37
0.31
Bent arm hang (s)
b
0.06
-
-
−11.70
<0.01
−10.45
0.01
Handgrip (kgf)
0.13
3.67
<0.01
-
-
-
-
2.26
<0.01
-
-
-
-
Cardiopulmonary fitness
Speed-agility
Speed shuttle run (s)
Plate tapping (s)
Flexibility
Sit and reach (cm)
Muscle strength and endurance
Balance
Flamingo (trying/1 min)
a
0.58
b
Analysis adjusted for gender, socio economics status and cluster design, Significant interactions.
Belgium [43]. However, the large variation between studies, when considering the results from muscle strength
and endurance tests (sit-ups, vertical jump, bent-arm hang
and handgrip), renders comparison to the present study
difficult. For sit-ups we obtained lower absolute values
compared to estimates from Spain [42], Poland [45],
Turkey [10] or Belgium [43]. Also, the estimates from the
handgrip test were lower than those from previous studies
[10,11,42,44,45]. Conversely, for the sit and reach test,
we obtained a higher score compared with Greek [44]
and Turkish [10] adolescents. In our results for sit-ups
our adolescents averaged higher scores than adolescents
in a Mexican study [11]. The favorable fitness scores in
European as compared to Ecuadorian adolescents may
Table 3 Significance of physical fitnessXresidence interaction terms in relation to blood lipid profile in Ecuadorian
adolescents, Cuenca- Nabón, Ecuador, 2009
Interaction fitness X residencea
Physical fitness
Dyslipidemia
Cholesterol
HDL
LDL
Triglyceride
20 m shuttle test (laps)
0.30
0.17
0.17
0.15
0.27
FITNESSGRAM (% who are on the Healthy Fitness Zone)
0.51
<0.01
0.17
<0.01
0.95
Speed shuttle run (s)
0.52
0.08
0.50
0.05
0.27
Plate tapping (s)
0.09
0.20
0.06
0.14
0.86
0.80
0.01
0.47
<0.01
0.69
Cardiopulmonary fitness
Speed-agility
Flexibility
Sit and reach (cm)
Muscle strength and endurance
Sit-up (number/30 s)
0.24
<0.01
0.68
<0.01
0.41
Vertical jump (cm)
0.99
0.10
0.79
0.18
0.58
Bent arm hang (s)
0.54
0.03
0.86
<0.01
0.22
Handgrip (kgf)
0.06
0.72
0.22
0.23
0.02
0.99
0.64
0.26
0.32
0.22
Balance
Flamingo (trying/1 min)
a
Analysis were adjusted for gender, BMI, socio economics status, energy intake per day and cluster design.
Significant level set to p ≤ 0.10.
Andrade et al. BMC Pediatrics 2014, 14:106
/>
Page 8 of 11
Table 4 Associations of physical fitness on blood lipids in Ecuadorian adolescents, Cuenca-Nabon, Ecuador, 2009
Dyslipidemia Cholesterol
Test eurofit
Urban
HDL
LDL
Rural
Triglyceride
Urban
Rural
Cardiopulmonary fitness
β
pa
β%
20 m shuttle test (laps)
0.85
0.20
−1.54 0.18 −2.70 0.11
FITNESSGRAM (% who are on the Healthy
Fitness Zone)
0.85
0.46
−5.25 0.14 −8.91 <0.01 −5.31 0.08 −3.31 0.46 −11.71 0.04 −4.03 0.67
pb
β%
pb
β%
pa
β%
pb
β%
−0.53 0.65 −1.72 0.34 −5.70
pb
β%
pa
0.13 −0.23 0.95
Speed-agility
Speed shuttle run (s)
1.00
0.48
0.07
0.32 0.10
0.27
0.003 0.97 0.06
0.60 0.23
0.32 0.15
0.29
Plate tapping (s)
0.99
0.99
0.04
0.60 −0.03 0.77
−0.10 0.05 0.06
0.62 −0.05
0.75 0.31
<0.01
1.00
0.94
−0.13 0.47 −0.81 0.08
−0.25 0.26 −0.10 0.72 −1.48
0.11 0.64
0.13
Sit-up (number/30 s)
0.97
0.34
−0.17 0.60 −0.66 0.14
−0.17 0.69 −0.22 0.71 −1.30
0.06 0.04
0.96
Vertical jump (cm)
1.00
0.57
−0.28 0.34 −0.21 0.23
0.00
0.99 −0.50 0.25 −0.25
0.70 −0.22 0.56
Bent arm hang (s)
0.99
0.05
−0.05 0.03 −0.04 0.60
0.00
0.60 −0.06 0.04 −0.06
0.58 0.00
Handgrip (kgf)
0.99
0.92
−0.64 0.02 −0.34 0.27
−0.28 0.19 −0.75 0.05 −0.84
0.09 −0.01 0.97
0.99
0.63
−0.13 0.64 −0.51 0.34
0.17
0.43 −0.08 0.83 −1.19
0.17 −0.01 0.97
Flexibility
Sit and reach (cm)
Muscle strength and endurance
0.97
Balance
Flamingo (trying/1 min)
Results were stratified by location when the interaction term was significant (P < 0.1).
a
p-value adjusted for gender, BMI, socio economic status, energy intake per person, residential location and clustering.
b
p-value adjusted for gender, BMI, socio economic status, energy intake per person and cluster design.
Significant level set to p ≤ 0.05.
be a reflection of the favorable environmental conditions for physical activity found in Europe [46], as well
as a longer tradition of health promotion programs [47],
and genetic factors [48,49]. This hypothesis may be reinforced by the fact that our results were similar when
compared to those from Mexican [11] and Colombian
[13] studies, which have similar environmental and genetic patterns to those of Ecuador [48].
Compared with rural adolescents, the urban participants
in our sample had a significantly better performance for
the cardiopulmonary, speed-agility, and muscle strength
and endurance components of the fitness test. Although
these findings are in line with measurements in Mexican
[11] and Polish [45] adolescents, most literature consists
of contradictory results with regard to comparison of performance between urban and rural adolescents [10,50-52].
Therefore, explaining the difference between urban and
rural adolescents remains speculative. Firstly, the urban
adolescents in our sample were taller and heavier than
rural adolescents. It has been reported that the physical
fitness is influenced by body size. Taller and heavier (not
necessarily overweight or obese) children may therefore
have an advantage on strength, speed, power and endurance components [53]. Secondly, urbanization and better
social conditions in urban areas may mean that urban
adolescents have increased access to sport facilities
compared to rural adolescents [54-56]. Organized sports
facilities are more common in urban areas and might
result in higher levels of cardio-respiratory and muscular
fitness in urban adolescents [42]. Thirdly, we observed
that urban schools had specialized physical education
teachers in their physical education programs, while these
kinds of specialized teachers were virtually absent in rural
areas. In addition, a lower availability of sport facilities in
rural schools might result in a lower variety of sport activities. The latter was confirmed during our observations in
the schools themselves. As a point of potential bias, urban
adolescents are possibly more familiar with physical fitness
tests than rural adolescents [11,44]. Fourthly, chronic undernutrition during childhood instigates mechanisms of
adaptation such as growth stunting and reduced muscle
mass. The latter are potentially related to the physical
fitness impairment during adolescence and adulthood [25].
Indeed, chronic undernutrition mainly affects children
in rural areas in Ecuador [18].
To our knowledge, only a few studies have analyzed
the association of blood lipid profile with multiple components of physical fitness. These studies have reported
that increased cardiorespiratory fitness and muscular
strength are associated with favorable lipid profiles in
adolescence [7,24,38,57]. These associations were partially confirmed in our study. Total cholesterol and
triglycerides were negatively associated with muscular
strength in the urban area, whilst in the rural population
these lipids were negatively associated with cardiorespiratory fitness.
Andrade et al. BMC Pediatrics 2014, 14:106
/>
We report that differences in blood lipid profile among
urban and rural adolescents are not explained by differences in physical fitness, even after adjusting for BMI
and total energy intake. The association found in this
study between blood lipids and fitness was adjusted for
BMI and total energy intake, as these factors have previously been found associated with blood lipids [4,7]. Mean
energy intake was not significantly different (P = 0.08)
between urban (1863 ± 181 kcal/day) and rural (1766 ±
153 kcal/day) adolescents. (Ochoa-Avilés unpublished
data). In our sample, the relationship of different blood
lipid parameters with each of the EUROFIT tests according to residential location was generally weak and
non-significant.
Another possible explanation for the differences in
blood lipid profile among urban and rural adolescents
may be the differences in moderate to vigorous physical
activity [58], or body fat distribution [59]. Physical activity
and fitness have been found independently associated with
certain blood lipid levels among children and adolescents
[6]. For example, the favorable TG and HDL levels are
inversely associated with moderate to vigorous physical
activity, independent of time spent sedentary [58] and
fitness [6]. In our sample, the time spent on moderate
to vigorous physical activity could be longer in urban
adolescents compared to rural adolescents because of
differences in the availability of sport facilities and organized group sports, detailed earlier in this discussion. In
addition, qualitative research performed in adolescents
from Cuenca and Nabón has shown that rural adolescents
felt an inability to perform physical activity in contrast to
the urban adolescents (Van Royen unpublished data). This
fact could lead to differences in physical activity levels between urban and rural adolescents, as self-efficacy is an
important determinant of physical activity in adolescence
[60]. On the other hand, total cholesterol, LDL, HDL
and TG also have been associated with fat distribution
measured by skin-fold thickness. Lean adolescents, as
determined using the skin-fold system, have been found
to have healthier blood lipid profiles compared to their
heavier peers [61]. However, skin-fold thickness was not
a parameter measured in the present study.
There are a few limitations of this study. Firstly, its
cross-sectional nature of only allows us to establish associations and not causality. Secondly, we did not measure
important variables associated with blood lipids such as
physical activity, pubertal stage, sex hormone level, skinfold thickness and familial health background. Third, the
blood lipid determinations were conducted only in a
subsample. Nevertheless, there were no differences in
physical fitness and BMI between the subsample and the
total sample. Fourth, reliability and validity of EUROIFIT
were not done in our sample. Although, EUROFIT has
shown good validity in previous studies performed in
Page 9 of 11
the region [11]. We followed the EUROFIT guidelines in
order to avoid source of bias, such as learning effect, or
low motivation of adolescents to do their best performance during each test [20]. Measurements of the 20 m
shuttle run could be influenced by the temperature and
weather conditions during the test. In Cuenca and
Nabón, however, the average temperature and altitude
are similar. In addition, the estimation of VO2max from
the FITNESSGRAM standards of the 20 m shuttle run is
known to vary with the equation used. A previous study
[28] has tested the degree of agreement between various
equations used to estimate VO2max and the actual the
VO2max. In the present study, we used the equation that
shows the highest agreement. Finally, our results could
be compared with only one other similar study in a lowand middle- income country, which hinders comparison
of our findings with previous data in similar populations.
The trial included adolescents from high altitude urban
and rural areas of Ecuador that are characterized by
mixed mestizo (in urban area) and Amerindian (in rural
area) ethnicities [49]. The external validity of our findings is hence limited to urban and rural schools in the
regions that share these characteristics [62].
Conclusions
The results from our study suggest that 59% of Ecuadorian
adolescents have poor physical fitness. Even though urban
participants showed better scores in the majority of
EUROFIT tests, physical fitness of the total population
was lower compared to that of adolescents from other
countries. These findings call for specific health promotion programs aimed to improve physical fitness among
Ecuadorian adolescents. Differences in fitness did not
explain differences in blood lipid profile between urban
and rural adolescents. We only found a weak association
between physical fitness and blood lipid profile, even after
adjustment for energy intake. Additional studies are
needed to clarify the frequent occurrence of unfavorable
blood lipid profiles among rural participants. Such studies
might explore associations with physical activity levels,
body fat distribution, risk factors at early ages, familial
hypercholesterolemia and ethnic differences.
Abbreviations
LMICs: Low- and middle- income countries; BMI: Body mass index;
EUROFIT: European tests of physical fitness; VO2max: Maximal oxygen uptake;
TC: Total cholesterol; TG: Triglycerides; HDL: High-density lipoprotein
cholesterol; LDL: Low density lipoprotein cholesterol; UBN: Unsatisfied basic
needs.
Competing interests
The authors declare that they have no competing of interests.
Authors’ contributions
AS and OA designed the study, coordinated and participated in its
implementation, performed the analysis and interpretation of results, drafted
the article, and approved the version to be published. LC and KP designed
the study, performed the analysis and interpretation of results, contributed
Andrade et al. BMC Pediatrics 2014, 14:106
/>
with important intellectual improvements of the article, reviewed the article
and approved the final version. EP and VR designed the study, participated
on implementation and quality assurance, contributed with important
intellectual improvements of the article, reviewed the article and approved
the final version. VJ, DS, RR and CG contributed to the interpretation of
results, contributed with important intellectual improvements of the article,
reviewed the article and approved the final version.
Acknowledgements
This work was supported by grant from VLIR-UOS and Nutrition Third World
and conducted within the cooperation between the University of Cuenca
(Ecuador) and the University of Ghent (Belgium). We are grateful to the
parents, schools, students, authorities, interviewers and all the members of
the ACTIVITAL project, especially to Diana Andrade, Johana Ortiz, Jorge Luis
García, and Marlene Gía. We thank Kathrin Smith for the English revision.
Author details
1
Food Nutrition and Health Program, Universidad de Cuenca, Avenida 12 de
Abril s/n Ciudadela Universitaria, Cuenca, Ecuador EC010107. 2Department of
Food Safety and Food Quality, Ghent University, Coupure Links 653, 9000
Ghent, Belgium. 3Nutrition and Child Health Unit, Department of Public
Health, Prince Leopold Institute of Tropical Medicine, Nationalestraat 155,
2000 Antwerp, Belgium. 4Department of Movement and Sports Sciences,
Ghent University, Watersportlaan 2, 9000 Gent, Belgium.
Received: 27 September 2013 Accepted: 11 April 2014
Published: 18 April 2014
References
1. World Health Organization: World health statistics 2011. Geneva: World
Health Organization; 2011.
2. McGill HC Jr, McMahan CA, Herderick EE, Malcom GT, Tracy RE, Strong JP:
Origin of atherosclerosis in childhood and adolescence. Am J Clin Nutr
2000, 72:1307S–1315S.
3. Williams PT: Physical fitness and activity as separate heart disease risk
factors: a meta-analysis. Med Sci Sports Exerc 2001, 33:754–761.
4. Perichart-Perera O, Balas-Nakash M, Rodriguez-Cano A, Munoz-Manrique C,
Monge-Urrea A, Vadillo-Ortega F: Correlates of dietary energy sources with
cardiovascular disease risk markers in Mexican school-age children. J Am
Diet Assoc 2010, 110:253–260.
5. Sassen B, Cornelissen VA, Kiers H, Wittink H, Kok G, Vanhees L: Physical
fitness matters more than physical activity in controlling cardiovascular
disease risk factors. Eur J Cardiovasc Prev Rehabil 2009, 16:677–683.
6. Ekelund U, Anderssen SA, Froberg K, Sardinha LB, Andersen LB, Brage S:
Independent associations of physical activity and cardiorespiratory
fitness with metabolic risk factors in children: the European youth heart
study. Diabetologia 2007, 50:1832–1840.
7. Ortega FB, Ruiz JR, Castillo MJ, Sjostrom M: Physical fitness in childhood
and adolescence: a powerful marker of health. Int J Obes (Lond) 2008,
32:1–11.
8. Ochoa-Aviles A, Andrade S, Huynh T, Verstraeten R, Lachat C, Rojas R,
Donoso S, Manuel YKB, Kolsteren P: Prevalence and socioeconomic
differences of risk factors of cardiovascular disease in Ecuadorian
adolescents. Pediatr Obes 2012, 7:274–283.
9. Karkera A, Swaminathan N, Pais SM, Vishal K, Rai BS: Physical fitness and
activity levels among urban school children and their rural counterparts.
Indian J Pediatr 2013, 82(4):356–361.
10. Ozdirenc M, Ozcan A, Akin F, Gelecek N: Physical fitness in rural children
compared with urban children in Turkey. Pediatr Int 2005, 47:26–31.
11. Pena Reyes ME, Tan SK, Malina RM: Urban–rural contrasts in the physical
fitness of school children in Oaxaca, Mexico. Am J Hum Biol 2003,
15:800–813.
12. Wang JH, Wu MC, Chang HH: Urban–rural disparity in physical fitness of
elementary schoolchildren in Taiwan. Pediatr Int 2013, 55:346–354.
13. Mojica GT, Poveda JG, Pinilla MI, Lobelo F: Sobrepeso, inactividad física y
baja condición física en un colegio de Bogotá, Colombia. Archivos
Latinoamericanos de Nutricion 2008, 58(3):265–273.
14. Campos H, Bailey SM, Gussak LS, Siles X, Ordovas JM, Schaefer EJ: Relations
of body habitus, fitness level, and cardiovascular risk factors including
lipoproteins and apolipoproteins in a rural and urban Costa Rican
population. Arterioscler Thromb 1991, 11:1077–1088.
Page 10 of 11
15. Hartley D: Rural health disparities, population health, and rural culture.
Am J Public Health 2004, 94:1675.
16. Moore JB, Jilcott SB, Shores KA, Evenson KR, Brownson RC, Novick LF: A
qualitative examination of perceived barriers and facilitators of physical
activity for urban and rural youth. Health Educ Res 2010, 25:355–367.
17. Moore JB, Brinkley J, Crawford TW, Evenson KR, Brownson RC: Association
of the built environment with physical activity and adiposity in rural and
urban youth. Prev Med 2013, 56:145–148.
18. INEC: Pobreza por Ingresos ENEMDU. Quito-Ecuador: INEC; 2010. Available from:
[ />dic-2010/Resul_Pobreza_xIngr_NacUrRu_Dic2010.pdf]
19. Cogill B: Anthropometric indicators measurement guide. Washington (D. C.):
Food and Nutrition Technical Assistance Project, Academy for Educational
Development; 2003:92. Available from: [ />Anthropometric%20measurement%202003.pdf]
20. Adam C, Klissouras V, Ravazzolo M, Renson R, Tuxworth W: Eurofit: European
test of physical fitness. Rome: Council of Europe, Committee for the
Development of Sport; 1988.
21. Castro-Pinero J, Artero EG, Espana-Romero V, Ortega FB, Sjostrom M, Suni J,
Ruiz JR: Criterion-related validity of field-based fitness tests in youth: a
systematic review. Br J Sports Med 2010, 44:934–943.
22. Mac Donncha C, Watson AW, McSweeney T, O’Donovan DJ: Reliability of
Eurofit physical fitness items for adolescent males with and without
mental retardation. APAQ 1999, 16:86–95.
23. Castro-Pinero J, Chillon P, Ortega FB, Montesinos JL, Sjostrom M, Ruiz JR:
Criterion-related validity of sit-and-reach and modified sit-and-reach test
for estimating hamstring flexibility in children and adolescents aged
6–17 years. Int J Sports Med 2009, 30:658–662.
24. Ruiz J, Ortega F, Gutierrez A, Meusel D, Sjöström M, Castillo M: Healthrelated fitness assessment in childhood and adolescence: a European
approach based on the AVENA, EYHS and HELENA studies. J Public Health
2006, 14:269–277.
25. Malina RM, Katzmarzyk PT: Physical activity and fitness in an international
growth standard for preadolescent and adolescent children. Food Nutr
Bull 2006, 27:S295–S313.
26. Vanhees L, Lefevre J, Philippaerts R, Martens M, Huygens W, Troosters T,
Beunen G: How to assess physical activity? How to assess physical
fitness? Eur J Cardiov Prev R 2005, 12:102–114.
27. The Cooper Institute: Physical fitness test. Dallas, TX: The Cooper Institute; 2011.
Available from: [ />%20Chart.pdf]
28. Boiarskaia EA, Boscolo MS, Zhu W, Mahar MT: Cross-validation of an
equating method linking aerobic FITNESSGRAM(R) field tests. Am J Prev
Med 2011, 41:S124–S130.
29. Gibson RS, Ferguson EL: An interactive 24-hour recall for assessing the
adequacy of iron and zinc intakes in developing countries. International Life
Sciences Institute: Washington, DC; 2008.
30. Trinder P: Enzymatic method of triglycerides. Ann Clin Biochem 1969, 6:24–27.
31. Gordon T, Castelli WP, Hjortland MC, Kannel WB, Dawber TR: High density
lipoprotein as a protective factor against coronary heart disease: the
Framingham study. Am J Med 1977, 62:707–714.
32. DeLong DM, DeLong ER, Wood PD, Lippel K, Rifkind BM: A comparison of
methods for the estimation of plasma low- and very low-density
lipoprotein cholesterol. The lipid research clinics prevalence study.
JAMA 1986, 256:2372–2377.
33. Lauer RM, Barness LA, Clark R, Deckelbaum RJ, Finberg L, Kwiterovich PO Jr,
McBride PE, Schieken RM, Scott LW, Strong JP, Weidman WH, Ziegler EE,
Cleeman JI, Ernst N, Harlan WR, Rifkind B, Rossouw JE, Quint-Adler L, McNeil
CT: Highlights of the report of the expert panel on blood cholesterol
levels in children and adolescents. National cholesterol education
program expert panel on blood cholesterol levels in children and
adolescents. Am Fam Physician 1992, 45:2127–2136.
34. Zimmet P, Alberti KG, Kaufman F, Tajima N, Silink M, Arslanian S, Wong G,
Bennett P, Shaw J, Caprio S: The metabolic syndrome in children and
adolescents - an IDF consensus report. Pediatr Diabetes 2007, 8:299–306.
35. American Academy of Pediatrics. Committee on Nutrition: Cholesterol in
childhood. Pediatr 1998, 101:141–147.
36. Streiner DL, Norman GR: Correction for multiple testing: is there a
resolution? CHEST J 2011, 140:16–18.
37. Ortega FB, Ruiz JR, Castillo MJ, Moreno LA, Gonzalez-Gross M, Warnberg J,
Gutierrez A: Low level of physical fitness in Spanish adolescents.
Andrade et al. BMC Pediatrics 2014, 14:106
/>
38.
39.
40.
41.
42.
43.
44.
45.
46.
47.
48.
49.
50.
51.
52.
53.
54.
55.
56.
57.
58.
Relevance for future cardiovascular health (AVENA study)]. Rev Esp Cardiol
2005, 58:898–909.
Moreira C, Santos R, de Farias Junior JC, Vale S, Santos PC, Soares-Miranda L,
Marques AI, Mota J: Metabolic risk factors, physical activity and physical
fitness in Azorean adolescents: a cross-sectional study. BMC Public Health
2011, 11:214.
Janz KF, Dawson JD, Mahoney LT: Tracking physical fitness and physical
activity from childhood to adolescence: the muscatine study. Med Sci
Sports Exerc 2000, 32:1250–1257.
Blair SN, Kohl H, Barlow CE, Paffenbarger R, Gibbons LW, Macera CA:
Changes in physical fitness and all-cause mortality. JAMA 1995,
273:1093–1098.
FitzGerald SJ, Barlow CE, Kampert JB, Morrow J, Jackson AW, Blair SN:
Muscular fitness and all-cause mortality: prospective observations.
J Phys Activ Health 2004, 1:7–18.
Chillon P, Ortega FB, Ferrando JA, Casajus JA: Physical fitness in rural and
urban children and adolescents from Spain. J Sci Med Sport 2011,
14:417–423.
Deforche B, Lefevre J, De Bourdeaudhuij I, Hills AP, Duquet W, Bouckaert J:
Physical fitness and physical activity in obese and nonobese Flemish
youth. Obes Res 2003, 11:434–441.
Tsimeas PD, Tsiokanos AL, Koutedakis Y, Tsigilis N, Kellis S: Does living in
urban or rural settings affect aspects of physical fitness in children? An
allometric approach. Br J Sports Med 2005, 39:671–674.
Wilczewski ASM, Krawczyk B: Physical development and fitness of children
from urban and rural areas as determined by EUROFIT test battery.
Biology Sport 1996, 13:113–126.
Hallal PC, Andersen LB, Bull FC, Guthold R, Haskell W, Ekelund U: Global
physical activity levels: surveillance progress, pitfalls, and prospects.
Lancet 2012, 380:247–257.
Dobbins M, Husson H, DeCorby K, LaRocca RL: School-based physical
activity programs for promoting physical activity and fitness in children
and adolescents aged 6 to 18. Cochrane Database Syst Rev 2013, 2,
CD007651.
Costa AM, Breitenfeld L, Silva AJ, Pereira A, Izquierdo M, Marques MC:
Genetic inheritance effects on endurance and muscle strength: an
update. Sports Med 2012, 42:449–458.
Gonzalez-Andrade F, Sanchez D, Gonzalez-Solorzano J, Gascon S, MartinezJarreta B: Sex-specific genetic admixture of Mestizos, Amerindian
Kichwas, and Afro-Ecuadorans from Ecuador. Hum Biol 2007, 79:51–77.
Adamo KB, Sheel AW, Onywera V, Waudo J, Boit M, Tremblay MS: Child
obesity and fitness levels among Kenyan and Canadian children from
urban and rural environments: a KIDS-CAN research alliance study.
Int J Pediatr Obes 2011, 6:e225–e232.
Tambalis KD, Panagiotakos DB, Sidossis LS: Greek children living in rural
areas are heavier but fitter compared to their urban counterparts: a
comparative, time-series (1997–2008) analysis. J Rural Health 2011,
27:270–277.
Albarwani S, Al-Hashmi K, Al-Abri M, Jaju D, Hassan MO: Effects of overweight and leisure-time activities on aerobic fitness in urban and rural
adolescents. Metab Syndr Relat Disord 2009, 7:369–374.
Malina RM, Bouchard C, Bar-Or O: Growth, maturation, and physical activity.
United States: Human Kinetics; 2004.
Papas MA, Alberg AJ, Ewing R, Helzlsouer KJ, Gary TL, Klassen AC: The built
environment and obesity. Epidemiol Rev 2007, 29:129–143.
Davison KK, Lawson CT: Do attributes in the physical environment
influence children’s physical activity? A review of the literature. Int J
Behav Nutr Phys Act 2006, 3:19.
Gordon-Larsen P, Nelson MC, Page P, Popkin BM: Inequality in the built
environment underlies key health disparities in physical activity and
obesity. Pediatr 2006, 117:417–424.
García-Artero E, Ortega FB, Ruiz JR, Mesa JL, Delgado M, González-Gross M,
García-Fuentes M, Vicente-Rodríguez G, Gutiérrez Á, Castillo MJ: Lipid and
metabolic profiles in adolescents are affected more by physical fitness
than physical activity (AVENA study) (Spanish). Revista Española de
Cardiología 2007, 60:581–588.
Ekelund U, Luan J, Sherar LB, Esliger DW, Griew P, Cooper A: Moderate to
vigorous physical activity and sedentary time and cardiometabolic risk
factors in children and adolescents. JAMA 2012, 307:704–712.
Page 11 of 11
59. Browning LM, Hsieh SD, Ashwell M: A systematic review of waist-to-height
ratio as a screening tool for the prediction of cardiovascular disease and
diabetes: 0.5 could be a suitable global boundary value. Nutr Res Rev
2010, 23:247–269.
60. Craggs C, Corder K, van Sluijs EM, Griffin SJ: Determinants of change in
physical activity in children and adolescents: a systematic review. Am J
Prev Med 2011, 40:645–658.
61. Tresaco B, Moreno LA, Ruiz JR, Ortega FB, Bueno G, Gonzalez-Gross M,
Warnberg J, Gutierrez A, Garcia-Fuentes M, Marcos A, Castillo MJ, Bueno M:
Truncal and abdominal fat as determinants of high triglycerides and low
HDL-cholesterol in adolescents. Obesity (Silver Spring) 2009, 17:1086–1091.
62. Wang S, Ray N, Rojas W, Parra MV, Bedoya G, Gallo C, Poletti G, Mazzotti G,
Hill K, Hurtado AM, Camrena B, Nicolini H, Klitz W, Barrantes R, Molina JA,
Freimer NB, Bortolini MC, Salzano FM, Petzl-Erler ML, Tsuneto LT, Dipierri JE,
Alfaro EL, Bailliet G, Bianchi NO, Llop E, Rothhammer F, Excoffier L,
Ruiz-Linares A: Geographic patterns of genome admixture in Latin
American Mestizos. PLoS Genet 2008, 4:e1000037.
doi:10.1186/1471-2431-14-106
Cite this article as: Andrade et al.: Physical fitness among urban and
rural Ecuadorian adolescents and its association with blood lipids: a
cross sectional study. BMC Pediatrics 2014 14:106.
Submit your next manuscript to BioMed Central
and take full advantage of:
• Convenient online submission
• Thorough peer review
• No space constraints or color figure charges
• Immediate publication on acceptance
• Inclusion in PubMed, CAS, Scopus and Google Scholar
• Research which is freely available for redistribution
Submit your manuscript at
www.biomedcentral.com/submit