Blood pressure percentiles by age and height for non-overweight Chinese children and adolescents: Analysis of the china health and nutrition surveys 1991–2009
Bạn đang xem bản rút gọn của tài liệu. Xem và tải ngay bản đầy đủ của tài liệu tại đây (365.68 KB, 9 trang )
Yan et al. BMC Pediatrics 2013, 13:195
/>
RESEARCH ARTICLE
Open Access
Blood pressure percentiles by age and height for
non-overweight Chinese children and
adolescents: analysis of the china health and
nutrition surveys 1991–2009
Weili Yan1*, Fang Liu2, Xuesong Li3, Lin Wu2, Yi Zhang1, Yi Cheng1, Wenhao Zhou4 and Guoying Huang2
Abstract
Background: Hypertension is an important health problem in China and raised blood pressure in children may
lead to future hypertension. Accordingly we aimed to provide a reference blood pressure table for age, gender and
height in Chinese children.
Methods: A reference sample of subjects was drawn from the Chinese Health and National Survey 1999–2009 aged
7–17 years after excluding overweight and obese children, the 50th, 90th and 95th percentiles of systolic and
diastolic blood pressure (SBP and DBP)are presented corrected for height and age by gender. These values are
compared with existing Chinese and US recommendations.
Results: Results for the 50th, 90th and 95th percentile of SBP and DBP for 6245 boys and 5707 girls were presented
by age and height percentiles. These observations were lower than existing Chinese recommendations before
13 years of age at median heightbut went higher in those >13 years old. At same age and height, SBP levels of
American children were overall higher than Chinese counterparts from this study by average 9–10 mm Hg, but DBP
did not show overall or significant difference.
Conclusions: The first height-specific blood pressure reference values are proposed for Chinese children and
adolescents aged 7–17 years. These are lower than existing US reference values and current Chinese cutoffs.
Keywords: Adolescents, Blood pressure, Hypertension, Prevention, Reference
Background
High blood pressure in children and adolescents is more
common and is associated with increasing childhood
obesity in western countries [1-3] as well as in China
[4,5]. Prehypertension and hypertension in childhood are
associated with a 2.5 fold increase likelihood of adult
hypertension [6,7]. In addition, childhood hypertension
correlates with early atherosclerosis, impaired arterial
compliance [8-10], cardiac structural changes [11], and
additional risk factors for metabolic syndrome. In a recent longitudinal study of 342 children aged 11–15 years,
childhood BP was found to predict early adulthood
* Correspondence:
1
Department of Clinical Epidemiology, Children’s Hospital of Fudan
University, 399 Wanyuan Road, Shanghai 201102, China
Full list of author information is available at the end of the article
dyslipidaemia, independently of body mass index (BMI)
[12]. For the pediatric population, the percentile of blood
pressure is used since blood pressure changes with age
and body size. The 90th and 95th percentiles of blood
pressure by age and height are recommended by the
fourth report on the diagnosis, evaluation and treatment
of high blood pressure in children and adolescents to
define prehypertension and hypertension respectively [13].
National blood pressure cutoffs by age groups for
Chinese children were first published in 1992, and
updated in 2010 [14], however, height was not taken
into account in either of them. In order to achieve
more accurate blood pressure evaluation in children,
the aim of this study is to establish mercury blood
pressure reference values by age and height Chinese
children and adolescents aged 7–17 years based on the
© 2013 Yan et al.; licensee BioMed Central Ltd. This is an open access article distributed under the terms of the Creative
Commons Attribution License ( which permits unrestricted use, distribution, and
reproduction in any medium, provided the original work is properly cited.
Yan et al. BMC Pediatrics 2013, 13:195
/>
nationally representative study sample, China Health
and Nutrition Survey (CHNS).
Methods
We used data from the China Health and Nutrition
Survey (CHNS) [15-17]. General information, methods
and dataset information can be accessed from the website
( [15-17]. Briefly,
participants were sampled from seven Chinese provinces
(namely Jiangsu, Shandong, Henan, Hubei, Human,
Guangxi and Guizhou). The survey design and methods
have been described in detail elsewhere previously [16,17].
After exclusion of overweight and obese students based
on the Chinese recommendation [18], boys and girls aged
7–17 years were included in this analysis. The University
of North Carolina and the China Center for Disease
Control and Prevention had reviewed and approved the
procedures for data collection and all subjects and/or
their parents/guardians have provided written informed
consent.
Measurements and definitions
Blood pressure was measured using mercury sphygmomanometer according to the standard protocol by trained
and qualified observers, which was described elsewhere
[5]. Korotkoff phase 1 and Korotkoff phase 5 were used
for defining systolic blood pressure (SBP) and diastolic
blood pressure (DBP). Appropriate size of cuff was used to
measure blood pressure for children using the right arm.
The mean of 2 measurements was analyzed. Height and
weight were measured to calculate body mass index
(BMI, weight in kilograms divided by the square of height
in meters). Overweight and obese were defined according
to the age- and gender-specific BMI reference standard for
Chinese children and adolescents [18].
Statistical methods
Percentiles of height as a function of age were obtained
by smoothed centile curves modeled using LMS method
[19] with the program LMSChartMaker Pro 2.3. The
reference curves of blood pressure by age and height
were simultaneously fitted by using an extension of the
LMS method [19], namely the generalized additive model
for location scale and shape (GAMLSS) with the Box-Cox
power exponential (BCPE) distribution family or BOXCOC-t, fitted with GAMLSS 4.1-5 in the free statistical software R2.15.0 ( GAMLSS is a
generalization of the LMS method where Y has a specified
frequency distribution D (μ,σ,ν,τ), the 4 parameters define
the location, scale and shape of the blood pressure distribution with age and height. Linear effect and additive
effect of age and height (two covariates) on SBP and
DBP were modeled simultaneously to obtain the optimal
models by minimizing the Schwarz Bayesian Criterion
Page 2 of 9
(SBC). The all possible functions of age and height as well
as the interactions of which were considered in the modeling, the most fitted model were achieved. The reference
values of 50th, 90th, and 95th percentiles of SBP and DBP
were computed by age and height (exact heights according
to the 5th, 25th, 50th, 75th and 95th percentiles) for boys
and girls respectively.
To make comparisons with the existing Chinese blood
pressure recommendations for children [14], heights and
BMI were standardized according to the same reference
populations, the Chinese National Survey on Constitution
and Health (CNSCH 2005) [20]. Since height percentiles
were not considered in the existing recommendation [14],
blood pressure reference values with median height of this
study were used to make comparisons.
Differences in proposed SBP and DBP cutoff values
(the 50th, 90th and 95th percentiles) for Chinese boys
and girls were compared with the Fourth Report on the
Diagnosis, Evaluation, and Treatment of High Blood
Pressure in Children and Adolescents of the US [13] at
Table 1 Baseline characteristics of the reference
population of nonoverweight
Age, yrs
7-10
11-13
14-17
Children excluded because of overweight/obese, n
Boys
127
138
128
Girls
134
156
127
Boys
1755
2775
2294
Girls
1656
2517
2074
Boys
25.0 ± 5.3
35.7 ± 9.1
51.2 ± 9.6
Girls
24.1 ± 5.1
35.6 ± 8.5
47.4 ± 7.2
Boys
125.1 ± 8.4
143.0 ± 11.1
163.3 ± 8.9
Girls
124.1 ± 8.8
143.7 ± 10.2
155.8 ± 6.8
Boys
101.8-153.0
96.0-178.0
130.6-189.0
Girls
98.0-152.3
115.0-171.5
130.0-180.5
Boys
15.2 ± 1.3
16.6 ± 1.8
18.9 ± 2.0
Girls
14.9 ± 1.3
16.6 ± 2.0
19.1 ± 2.0
Boys
90.7 ± 11.9
96.4 ± 11.7
106.7 ± 12.4
Girls
89.8 ± 11.4
96.6 ± 12.0
104.0 ± 10.7
Boys
59.7 ± 9.4
63.4 ± 8.8
69.4 ± 9.3
Girls
58.9 ± 9.6
63.4 ± 8.9
68.6 ± 8.1
Children included, n
Weight, kg
Height, cm
Height range, cm
BMI, kg/m2
SBP, mm Hg
DBP, mm Hg
Children and Adolescents (6245 boys and 5704 girls aged 7–17 yrs).
Yan et al. BMC Pediatrics 2013, 13:195
/>
Page 3 of 9
Table 2 Age-height-specific references: median, the 90th and 95th percentiles of SBP and DBP values for boys aged
7–17 years
Age, years
Height, cm
Percentiles of height
SBP percentiles, mm Hg
DBP, mm Hg
s*
50th
90th
95th
s*
50th
90th
95th
96
101
0.16
55
67
70
7
109.0
5th
0.13
82
7
115.0
25th
0.12
84
99
104
0.16
56
68
71
7
120.0
50th
0.12
86
101
106
0.16
57
69
72
7
125.0
75th
0.12
88
103
108
0.15
59
70
74
7
130.0
95th
0.12
90
105
110
0.15
60
71
75
8
113.7
5th
0.12
84
99
103
0.16
56
68
71
8
119.5
25th
0.12
86
101
105
0.15
58
69
72
8
124.5
50th
0.12
88
103
108
0.15
59
70
73
8
128.2
75th
0.12
90
105
109
0.15
60
71
74
8
135.4
95th
0.12
92
107
112
0.15
61
73
76
9
119.5
5th
0.12
87
101
106
0.15
58
69
72
9
125.4
25th
0.12
89
104
108
0.15
59
70
74
9
130.0
50th
0.12
91
105
110
0.15
60
72
75
9
135.1
75th
0.12
93
107
112
0.15
61
73
76
9
143.0
95th
0.11
96
111
115
0.14
63
75
78
10
122.0
5th
0.12
88
102
107
0.15
58
70
73
10
129.0
25th
0.12
91
105
110
0.15
60
71
75
10
134.0
50th
0.12
92
107
112
0.14
61
72
76
10
140.0
75th
0.11
95
110
114
0.14
62
74
77
10
146.4
95th
0.11
97
112
117
0.14
64
75
79
11
126.7
5th
0.12
90
104
109
0.15
60
71
74
11
134.0
25th
0.12
93
107
112
0.14
61
72
76
11
139.3
50th
0.11
95
109
114
0.14
62
74
77
11
144.6
75th
0.11
97
112
116
0.14
64
75
78
11
153.0
95th
0.11
100
115
119
0.13
66
77
80
12
133.0
5th
0.11
93
107
111
0.14
61
72
75
12
139.5
25th
0.11
95
110
114
0.14
63
74
77
12
145.5
50th
0.11
97
112
116
0.13
64
75
78
12
152.0
75th
0.11
100
115
119
0.13
66
77
80
12
162.0
95th
0.11
104
119
123
0.13
68
79
82
13
135.0
5th
0.11
94
108
112
0.14
62
73
76
13
145.0
25th
0.11
98
112
116
0.13
64
75
78
13
152.0
50th
0.11
100
115
119
0.13
66
77
80
13
158.1
75th
0.11
103
117
122
0.13
67
78
81
13
168.1
95th
0.10
106
121
126
0.12
69
80
84
14
142.0
5th
0.11
97
111
115
0.13
64
74
78
14
152.0
25th
0.11
101
115
119
0.13
66
77
80
14
159.5
50th
0.11
103
118
122
0.13
68
78
82
14
165.0
75th
0.10
106
120
125
0.12
69
80
83
14
172.5
95th
0.10
108
123
128
0.12
70
81
85
15
147.9
5th
0.11
99
114
118
0.13
65
76
79
15
157.0
25th
0.11
103
117
121
0.12
67
78
81
Yan et al. BMC Pediatrics 2013, 13:195
/>
Page 4 of 9
Table 2 Age-height-specific references: median, the 90th and 95th percentiles of SBP and DBP values for boys aged
7–17 years (Continued)
15
163.0
50th
0.10
105
120
124
0.12
68
79
82
15
168.3
75th
0.10
107
122
126
0.12
70
80
84
15
175.0
95th
0.10
110
124
129
0.12
71
82
85
16
153.0
5th
0.11
102
116
120
0.12
66
77
80
16
160.5
25th
0.10
104
119
123
0.12
68
79
82
16
165.0
50th
0.10
106
121
125
0.12
69
80
83
16
170.0
75th
0.10
108
123
127
0.12
70
81
84
16
177.0
95th
0.10
111
125
130
0.12
72
83
86
17
155.0
5th
0.10
103
117
121
0.12
67
78
80
17
163.0
25th
0.10
106
120
124
0.12
69
79
82
17
167.5
50th
0.10
107
122
126
0.12
70
80
83
17
172.0
75th
0.10
109
124
128
0.12
71
81
84
17
180.0
95th
0.10
112
127
131
0.11
73
83
86
Notes
SBP, systolic blood pressure; DBP, diastolic blood pressure.
*s, the coefficient of variation of blood pressure.
given age (7–17 years) and the median height (cm).
Since the height distributions of the two reference samples
are not comparable, it is difficult to compare the corresponding height–depended 50th, 90th and 95th blood
pressure percentiles directly, therefore, the expected SBP
and DBP of US counterparts with the median height of
Chinese reference population were computed based on
the equations. For example, the 50th, 90th and 95th percentiles of SBP and DBP for an US boy aged 7 with the
median height of 120 cm, were calculated as 97, 111,
118 mm Hg as well as 57, 72, and 80 mm Hg, based on
the US equation [13] presented in the table B1 of the
Fourth report [13]. Stata 11.0 (StataCorp LP, StataCorp,
Texas 77845 USA) were used for conventional descriptive
analysis.
Independent software called “Blood Pressure Calculator
“has been developed based on the fitted models of blood
pressure from this study.
Results
Based on Chinese national BMI cutoff points, a total of
620 boys and 445 girls (8.2%) were excluded from the
original study sample (n = 13014) because of being overweight or obese. The remaining reference sample consists
of children and adolescents aged 7–17 years (including
6245 boys and 5704 girls) with complete data on age, gender, height and three SBP and DBP readings. The characteristics of subjects were given in Table 1. It shows that
the mean body weight, height, BMI, SBP and DBP increase
with the age groups, the ranges of height for the three age
groups vary from 50.5 cm to 58.4 cm.
The optimal models for the 4 parameters of SBP and
DBP distribution for boys and girls were fitted. It
showed that BCPE model was the best fitted model for
SBP for boys and DBP for both genders, BCT model was
the best fitted model for SBP of girls. Reference values
of the 50th, 90th, and 95th percentiles of SBP and DBP,
were computed by age and exact heights according to
the 5th, 25th, 50th, 75th and 95th percentiles ) for boys
and girls respectively and presented as Table 2 (for boys)
and Table 3 (for girls). At adolescents aged 17 years old
with the median height (167.5 cm for boys and 157.8 cm
for girls), the median SBP were 107 for boys and 105 for
girls; the 90th percentiles of SBP and DBP were 122 mm
Hg and 80 mm Hg for boys and 118 mm Hg and 79 mm
Hg for girls respectively, which were very close to the
cutoff of 120 /80 mm Hg for identifying prehypertension
for all ages recommended by the fourth report [13]. The
95th percentile of SBP and DBP were 126 mm Hg and
83 mm Hg for boys, and 122 mm Hg and 82 mm Hg
for girls respectively, which are lower than the recommended optimal blood pressure of 130/85 mm Hg for
adults [21].
Comparison with available Chinese reference blood
pressure tables
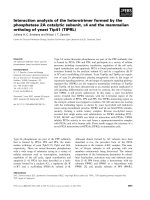
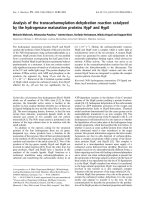
Figure 1 showed the 90th percentiles of SBP and DBP
for boys and girls aged 7–17 years by the 5th, 50th and
95th percentiles of height compared with that from the
study by Mi J et al. [14]. It showed that SBP values for
children at all ages with the median height proposed by
this study were 5–10 mm Hg lower. DBP was 2–3 mm
Hg higher before age of 14, but tended to be similar
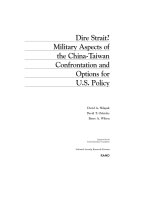
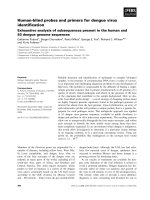
afterwards. As shown in Figure 2, the reference sample
of current study is shorter (0.88 SD for boys and 0.7 SD
for girls) and thinner (0.68 SD for boys and 0.47 SD for
Yan et al. BMC Pediatrics 2013, 13:195
/>
Page 5 of 9
Table 3 Age-height-specific references: median, the 90th and 95th percentiles of SBP and DBP values for girls aged
7–17 years
Age, years
Height, cm
Percentile of height
SBP, mm Hg
DBP, mm Hg
s*
50th
90th
95th
s*
50th
90th
95th
96
100
0.14
54
64
67
7
108.0
5th
0.12
82
7
114.2
25th
0.12
84
98
103
0.14
56
66
69
7
118.2
50th
0.12
86
100
104
0.14
56
67
70
7
122.0
75th
0.12
87
101
105
0.14
57
68
71
7
129.6
95th
0.12
89
103
108
0.14
59
70
73
8
113.2
5th
0.12
85
99
103
0.14
56
66
69
8
119.3
25th
0.12
87
101
105
0.14
57
67
70
8
123.0
50th
0.12
88
102
106
0.14
58
68
71
8
128.5
75th
0.12
89
104
108
0.14
59
70
72
8
135.0
95th
0.11
91
106
110
0.14
60
71
74
9
119.0
5th
0.12
87
101
105
0.14
57
68
70
9
124.5
25th
0.12
89
103
107
0.14
59
69
72
9
130.0
50th
0.11
91
105
109
0.14
60
70
73
9
134.8
75th
0.11
92
106
110
0.14
61
71
74
9
143.0
95th
0.11
95
109
113
0.14
62
73
76
10
123.0
5th
0.12
89
103
107
0.13
59
69
72
10
219.6
25th
0.09
119
133
137
0.13
78
92
95
10
135.2
50th
0.11
93
107
111
0.13
61
72
75
10
140.0
75th
0.11
94
108
112
0.13
62
73
76
10
148.0
95th
0.11
97
111
115
0.13
64
75
78
11
128.0
5th
0.11
91
105
109
0.13
60
70
73
11
135.0
25th
0.11
94
107
111
0.13
62
72
75
11
141.1
50th
0.11
95
109
113
0.13
63
73
76
11
147.7
75th
0.11
97
111
115
0.13
64
75
78
11
156.0
95th
0.10
100
114
118
0.13
66
77
80
12
132.6
5th
0.11
94
107
111
0.12
62
72
74
12
142.0
25th
0.11
96
110
114
0.12
63
74
77
12
147.0
50th
0.11
98
112
116
0.12
64
75
78
12
153.0
75th
0.10
100
114
118
0.12
66
76
79
12
159.4
95th
0.10
102
116
120
0.12
67
78
81
13
138.2
5th
0.11
96
109
113
0.12
63
73
76
13
146.3
25th
0.10
98
112
116
0.12
65
75
78
13
151.2
50th
0.10
100
114
118
0.12
66
76
79
13
156.1
75th
0.10
101
115
119
0.12
67
77
80
13
162.0
95th
0.10
103
117
121
0.12
68
79
82
14
143.0
5th
0.10
98
112
116
0.12
65
75
77
14
150.0
25th
0.10
100
114
118
0.12
66
76
79
14
154.2
50th
0.10
102
115
119
0.12
67
77
80
14
158.9
75th
0.10
103
117
121
0.12
68
78
81
14
165.0
95th
0.10
105
118
122
0.12
69
80
83
15
144.2
5th
0.10
99
113
116
0.11
65
75
78
15
151.0
25th
0.10
101
115
119
0.11
67
77
80
Yan et al. BMC Pediatrics 2013, 13:195
/>
Page 6 of 9
Table 3 Age-height-specific references: median, the 90th and 95th percentiles of SBP and DBP values for girls aged
7–17 years (Continued)
15
155.6
50th
0.10
103
116
120
0.11
68
78
81
15
160.0
75th
0.10
104
117
121
0.11
68
79
82
15
165.8
95th
0.10
106
119
123
0.11
70
80
83
16
145.8
5th
0.10
100
114
118
0.11
66
76
79
16
152.9
25th
0.10
102
116
120
0.11
67
77
80
16
157.0
50th
0.10
104
117
121
0.11
68
78
81
16
161.0
75th
0.10
105
118
122
0.11
69
79
82
16
167.6
95th
0.09
107
120
124
0.11
70
81
84
17
145.6
5th
0.10
101
114
118
0.11
66
76
79
17
153.1
25th
0.10
103
116
120
0.11
68
78
80
17
157.8
50th
0.09
105
118
122
0.11
69
79
82
17
162.4
75th
0.09
106
119
123
0.11
70
80
83
17
168.0
95th
0.09
108
121
125
0.11
71
81
84
Notes
SBP, systolic blood pressure; DBP, diastolic blood pressure.
*s, the coefficient of variation of blood pressure.
SBP, mm Hg
A
140
p50_ncn
130
P90__ncn
120
P95_ncn
p50_gamlss
110
P90__gamlss
100
P95_gamlss
of SBP proposed by the current study were lower than
the existing national non-height specific reference, the
differences tended to decrease after 14 years old. However, the three centile curves of the current study were
lower than then existing national reference curves before
B
100
p50_ncn
DBP, mm Hg
girls) compared with the reference sample used by
national recommendation [14] than the reference sample
used the earlier study [14].
Height is not taken into account in the earlier national
recommendation. The 50th, 90th and 95th centile curves
90
90
P90__ncn
80
P95_ncn
p50_gamlss
70
P90__gamlss
P95_gamlss
60
50
80
40
7
8
7
9 10 11 12 13 14 15 16 17
8
Exact age, y
130
125
120
115
110
105
100
95
90
85
80
10 11 12 13 14 15 16 17
Exact age, y
p50_ncn
D
P90__ncn
P95_ncn
p50_gamlss
P90__gamlss
P95_gamlss
DBP, mm Hg
SBP, mm Hg
C
9
100
p50_ncn
90
P90__ncn
80
P95_ncn
p50_gamlss
70
P90__gamlss
60
P95_gamlss
50
40
7
8
9 10 11 12 13 14 15 16 17
Exact age, y
7
8
9 10 11 12 13 14 15 16 17
Exact age, y
Figure 1 The 50th, 90th and 95th percentile of SBP and DBP for non-overweight Chinese (CHNS) with the median height compared
with the national recommendation [14]. A,SBP for boys; B, DBP for boys; C, SBP for girls; D, DBP for girls. Pn_ncn indicates the existing
national centile curves, Pn_gamlss indicates proposed centile curves by the current study.
Yan et al. BMC Pediatrics 2013, 13:195
/>
Page 7 of 9
A
B
1
Z_ Height
ncn: mean Z_Ht =0.20
gamlss: mean Z_Ht =-0.52
ncn: mean Z_Ht =0.21
gamlss: mean Z_Ht =-0.66
0.5
0
7
8
9
10
11
12
13
14
15
16
7
17
8
9
10
11
12
13
14
15
16
17
-0.5
Zht_ncn
-1
C
Zht_gamlss
Zht_ncn
D
ncn: mean Z_BMI =0.34
gamlss: mean Z_BMI =-0.34
0.6
Zht_gamlss
ncn: mean Z_BMI=0.20
gamlss: mean Z_BMI =-0.27
0.4
0.2
Z_BMI
0
7
8
9
10
11
12
13
14
15
16
17
7
8
9
10
11
12
13
14
15
16
17
-0.2
-0.4
-0.6
ZBMI_ncn
ZBMI_gamlss
ZBMI_ncn
ZBMI_gamlss
Figure 2 Standardized BMI(Z_BMI) and height (Z-Ht) of the reference study sample from the current study and the earlier national
recommendation. The standardized height (Z-Ht) and BMI (Z_BMI) of reference sample of the current study was compared with that from the
national recommendation [14], showing that the reference sample of current study is shorter (0.88 SD for boys and 0.70 SD for girls) and thinner
(0.68 SD for boys and 0.47 SD for girls) compared with the reference sample used by national recommendation [14]. A, Z_height for boys;
B, Z_height for girls; C, Z_BMI for boys; D, Z_BMI for girls.
age of 11–12 years but exceeded it up to 17 years old to
the similar extent with the age of 7. This trend remained
similar in boys and girls.
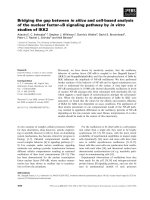
Comparison with US national reference tables
Compared with the international blood pressure table
recommended by the Fourth report [13] (Figure 3), the
50th, 90th and 95th percentiles of SBP in Chinese boys
and girls were averagely 9–10 mm Hg lower than the
expected values for the American counterparts; however,
there were no clear difference in DBP percentiles.
Discussion
We present the first height percentile specific-blood
pressure references in China and compare these with the
earlier ones also international values. These new cutoffs
will be more accurate for evaluating blood pressure
levels for children and adolescents with extreme heights.
The proposed 90th and 95th percentiles of blood pressure
may be used to detect prehypertension and hypertension
in Chinese pediatric population. The using of nonoverweight reference sample may makes the proposed
blood pressure cutoff points more sensitive to identify
children with elevated blood pressure because of with risk
factors such as being overweight or obese. The 99th
percentiles are not proposed based on the thinking that
children with blood pressure measurements over it will
not be directly diagnosed as hypertension, instead, additional blood pressure measurements will be suggested.
Height is a key covariate associated with blood pressure
levels. The ignoring of height of the blood pressure references may result in inaccurate blood pressure evaluation
in pediatric practice especially for children who are very
short or tall. Since there may be significant difference in
height distribution between the current study sample and
others, the blood pressure cutoffs for exact height values
instead of height percentile categories are proposed to
make it more practical and accurate for individual blood
pressure assessment.
Compared with the existing national age-specific blood
pressure recommendations [14], the blood pressure percentiles for age proposed by the current study were
lower. In the earlier recommendations [14], only function of age on blood pressure was considered, the blood
pressure percentiles could be understand as the functions of age and average height of the study population.
It may be appropriate for those with average height,
while it may make inaccurate estimation of blood pressure for children with extreme heights. The current
study uses new statistical method GAMLSS model,
which is able to handle two and more covariates to allowance to fit functions of both age and height to blood
Yan et al. BMC Pediatrics 2013, 13:195
/>
Page 8 of 9
A
B
100
140
90
p50_cn
130
120
SBP, mm Hg
p90_cn
110
p95_cn
100
p50_us
90
p90_us
7
8
80
p90_cn
70
p95_cn
p90_us
p95_us
40
9 10 11 12 13 14 15 16 17
Age,
p50_us
60
50
p95_us
80
C
DBP, mm Hg
p50_cn
7
8
9
years
10
11
12
Age,
D
140
13
14
15
16
17
years
100
p50_cn
120
p90_cn
110
p95_cn
p50_us
100
DBP, mm Hg
SBP, mm Hg
90
130
p90_us
90
p95_us
80
p50_cn
80
p90_cn
70
p95_cn
p50_us
60
p90_us
50
p95_us
40
7
8
9 10 11 12 13 14 15 16 17
7
8
9
10 11 12 13 14 15 16 17
Figure 3 The 50th, 90th and 95th percentile of SBP and DBP for the median height for Chinese (CHNS) and American boys (A) and
girls (B). SBP and DBP values for American children with the given age (years) and height (cm) were computed based on SBP and DBP
equations from the table B1 of the Fourth Report [13], without exclusion of overweight or obese children. It shows that American boys and girls
at given age and height (cm) according to Chinese children had higher SBP and DBP percentile levels (the 50th, 90th and 95th ). A, SBP for boys;
B, DBP for boys; C, SBP for girls; D, DBP for girls. Pn _ncn indicates the existing national centile curves, Pn_us indicates corresponding expected
centile curves of American children based on equations in Table B1 in [13].
pressure levels. Compared with the earlier recommendation [14], the percentiles proposed by the current
study will be more accurate especially for those children
with extreme heights. In addition, exclusion of overweight
and obese subjects from the reference population of the
current study makes lower BMI levels compared with that
used by the earlier study (BMI Z-score difference is averagely 0.68SD for boys and 0.47SD for girls). The corresponding lower cutoffs of blood pressure we propose are
expected to be more sensitive to identify obesity-related
high blood pressure in children.
In overall, the blood pressure percentiles we proposed
are lower than the international one for American children [13], which also consider both functions of age and
height on blood pressure levels. The racial difference of
blood pressure reference values for given age and height
supports the necessity of establishing blood pressure
references for Chinese children and adolescents, in
order to achieve early prevention of childhood hypertension in the country.
Given the complex calculations for individual assessment of blood pressure in practice, a Blood Pressure
Calculator has been developed based on the fitted
models of blood pressure from this study. After
inputting age, gender, height, SBP and DBP levels, it will
return SBP and DBP percentiles and blood pressure
status (normotensive, prehyepertensive or hypertensive).
This calculator may greatly help individual clinical
evaluation of blood pressure in hospitals and public
health settings.
Our study has some limitations. The sample size of
boys and girls aged 7–17 years are relatively small compared with the total population of China, and survey
fields cover only 7 east coast provinces. However, we
choose to use CHNS data is based on the considerations
that the CHNS study are jointly funded by Chinese government and American organizations, the methodology
of blood pressure measurement, quality control and data
management follow international criteria, the international
comparisons will be more convincing. Second, no external
validation was made to assess the performance of the
newly proposed blood pressure tables. A second validation
study would be helpful to compare the accuracy of ageand height-specific blood pressure percentiles from nonoverweight reference sample proposed by the current study
with the existing age-specific percentiles but without excluding overweight subjects [14] in children’s blood pressure assessment.
Yan et al. BMC Pediatrics 2013, 13:195
/>
Page 9 of 9
Conclusion
In summary, the current study proposes the first age
and height corrected blood pressure percentiles for
Chinese children and adolescents aged 7–17 years with
potential for more accurate blood pressure evaluation
for children with extreme height, and in identifying
obesity-related high blood pressure. It is expected that
the proposed new references will be used in clinical individual blood pressure evaluation and governmentsupported annual national regular school-based fitness
and physical survey in China.
6.
Competing interests
The authors declare no financial or non-financial competing interests.
11.
Authors’ contributions
AB carried out the molecular genetic studies, participated in the sequence
alignment and drafted the manuscript. JY carried out the immunoassays. MT
participated in the sequence alignment. ES participated in the design of the
study and performed the statistical analysis. FG conceived of the study and
participated in its design and coordination and helped to draft the
manuscript. All authors read and approved the final manuscript. WY
conceptualized and designed the study, supervised the gamlss modeling
and all the statistical analyses, drafted the manuscript, and approved the final
manuscript as submitted. FL, XL, LW, YZ and YC carried out the conventional
statistical analyses, made the tables, reviewed and revised the manuscript,
and approved the final manuscript as submitted. WZ and GH participated
design, data interpretation, discussion and approved the final manuscript as
submitted.
12.
Acknowledgements
We thank Dr. D. Mikis Stasinopoulos for his kind supervision and help in
modeling blood pressure using GAMLSS program.
Funding sources
This work is supported by Chinese National “Twelfth Five-Year” Plan for
Science & Technology Support (Grant No. 2012BAI03B00); National Natural
Science Foundation of China (Grant No. 81273168).
Author details
1
Department of Clinical Epidemiology, Children’s Hospital of Fudan
University, 399 Wanyuan Road, Shanghai 201102, China. 2Cardiac Center,
Children’s Hospital of Fudan University, Shanghai, P.R. China. 3Department of
Vascular Surgery, The No 5 Hospital of Shanghai, Shanghai, P.R. China.
4
Department of Neonatology, Children’s Hospital of Fudan University,
Shanghai, P.R. China.
Received: 19 June 2013 Accepted: 22 November 2013
Published: 25 November 2013
References
1. McNiece KL, Poffenbarger TS, Turner JL, Franco KD, Sorof JM, Portman RJ:
Prevalence of hypertension and pre-hypertension among adolescents.
J Pediatr 2007, 150(6):640–644. 644 e641.
2. Chiolero A, Cachat F, Burnier M, Paccaud F, Bovet P: Prevalence of
hypertension in schoolchildren based on repeated measurements and
association with overweight. J Hypertens 2007, 25(11):2209–2217.
3. Chiolero A, Paccaud F, Bovet P: Pre-hypertension and hypertension
among adolescents of Switzerland. J Pediatr 2007, 151(6):e24–e25.
4. Cui Z, Huxley R, Wu Y, Dibley MJ: Temporal trends in overweight and
obesity of children and adolescents from nine Provinces in China from
1991–2006. Int J Pediatr Obes 2010, 5(5):365–374.
5. Liang YJ, Xi B, Hu YH, Wang C, Liu JT, Yan YK, Xu T, Wang RQ: Trends in
blood pressure and hypertension among Chinese children and
adolescents: China Health and Nutrition Surveys 1991–2004. Blood Press
2011, 20(1):45–53.
7.
8.
9.
10.
13.
14.
15.
16.
17.
18.
19.
20.
21.
Chen X, Wang Y: Tracking of blood pressure from childhood to
adulthood: a systematic review and meta-regression analysis. Circulation
2008, 117(25):3171–3180.
Lauer RM, Clarke WR: Childhood risk factors for high adult blood pressure:
the Muscatine Study. Pediatrics 1989, 84(4):633–641.
Mahoney LT, Burns TL, Stanford W, Thompson BH, Witt JD, Rost CA, Lauer
RM: Coronary risk factors measured in childhood and young adult life
are associated with coronary artery calcification in young adults: the
Muscatine Study. J Am Coll Cardiol 1996, 27(2):277–284.
Berenson GS, Srinivasan SR, Bao W, Newman WP 3rd, Tracy RE, Wattigney
WA: Association between multiple cardiovascular risk factors and
atherosclerosis in children and young adults. The Bogalusa Heart Study.
N Engl J Med 1998, 338(23):1650–1656.
Lande MB, Carson NL, Roy J, Meagher CC: Effects of childhood primary
hypertension on carotid intima media thickness: a matched controlled
study. Hypertension 2006, 48(1):40–44.
Zhu H, Yan W, Ge D, Treiber FA, Harshfield GA, Kapuku G, Snieder H, Dong
Y: Cardiovascular characteristics in American youth with prehypertension. Am J Hypertens 2007, 20(10):1051–1057.
Rademacher ER, Jacobs DR Jr, Moran A, Steinberger J, Prineas RJ, Sinaiko A:
Relation of blood pressure and body mass index during childhood to
cardiovascular risk factor levels in young adults. J Hypertens 2009,
27(9):1766–1774.
National High Blood Pressure Education Program Working Group on
Hypertension Control in Children and Adolescents: The fourth report on
the diagnosis, evaluation, and treatment of high blood pressure in
children and adolescents. Pediatrics 2004, 114(2 Suppl 4th Report):555–576.
Mi J, Wang T, Meng L, Zhu G, Han S, Zhong Y, Liu G, Wan Y, Xiong F, Shi J,
et al: Development of blood pressure reference standards for Chinese
children and adolescents. Chin J Evid Based Pediatr 2010, 5(1):4–14.
CHNS: China health and nutrition survey: design and methods.
/>Liu H: The China health and nutrition survey: an important database for
poverty and inequality research. J Econ Inequal 2008, 6:373–376.
Popkin BM, Du S, Zhai F, Zhang B: Cohort Profile: the China Health and
Nutrition Survey–monitoring and understanding socio-economic and
health change in China, 1989–2011. Int J Epidemiol 2010, 39(6):1435–1440.
Ji CY: Report on childhood obesity in China (1)–body mass index
reference for screening overweight and obesity in Chinese school-age
children. Biomed Environ Sci 2005, 18(6):390–400.
Cole TJ, Green PJ: Smoothing reference centile curves: the LMS method
and penalized likelihood. Stat Med 1992, 11(10):1305–1319.
Work Group of Physical Fitness and Health Surveillance of Chinese School
Students: Report on the Physical Fitness and Health Surveillance of Chinese
School Students. Chinese high education press. ISBN: 9787040212006).2007
(1st ed).
The IDF consensus worldwide definition of the metabolic syndrome.
/>
doi:10.1186/1471-2431-13-195
Cite this article as: Yan et al.: Blood pressure percentiles by age and
height for non-overweight Chinese children and adolescents: analysis of
the china health and nutrition surveys 1991–2009. BMC Pediatrics
2013 13:195.
Submit your next manuscript to BioMed Central
and take full advantage of:
• Convenient online submission
• Thorough peer review
• No space constraints or color figure charges
• Immediate publication on acceptance
• Inclusion in PubMed, CAS, Scopus and Google Scholar
• Research which is freely available for redistribution
Submit your manuscript at
www.biomedcentral.com/submit