Efficiency of red cell distribution width in identification of children aged 1-3 years with iron deficiency anemia against traditional hematological markers
Bạn đang xem bản rút gọn của tài liệu. Xem và tải ngay bản đầy đủ của tài liệu tại đây (380.5 KB, 6 trang )
Sazawal et al. BMC Pediatrics 2014, 14:8
/>
RESEARCH ARTICLE
Open Access
Efficiency of red cell distribution width in
identification of children aged 1-3 years with iron
deficiency anemia against traditional
hematological markers
Sunil Sazawal1,2,3*, Usha Dhingra2,3, Pratibha Dhingra1,3, Arup Dutta3, Hiba Shabir3, Venugopal P Menon1
and Robert E Black2
Abstract
Background: Current strategy to identify iron deficiency anemia relies on markers involving high costs. Reports
have suggested red cell distribution width (RDW) as a potential screening test for identifying iron deficiency anemia
(IDA) but studies in pediatric populations are lacking. Our study elucidates the discriminative ability of RDW for
detecting IDA among young children.
Methods: 2091 blood reports of children aged 1–3 years from an urban low socio-economic population of Delhi
were analyzed to evaluate the sensitivity of RDW in discriminating IDA using receiver’s operating characteristic
curve. Hemoglobin and RDW were estimated using coulter, zinc protoporphyrin with AVIV fluorometer and serum
ferritin by enzyme linked immunosorbent assay.
Results: A total of 1026 samples were classified as iron deficient anemia using gold standard. As a marker of overall
efficiency, area under the curve for RDW was 0.83 (95% CI, 0.81- 0.84; p < 0.001). Sensitivity of RDW at cut-off of 18%
to detect iron deficiency anemia was 76.5% and specificity 73.1% yielding a positive predictive value of 73% and
negative predictive value of 76%. At a cut-off of RDW 16.4%, the sensitivity was 94% and at a cut-off of 21%, the
specificity was 95%. Combination of hemoglobin ≤10 g/dL and RDW >15%, yielded a sensitivity of 99% and
specificity of 90%. These data suggest that simple coulter analysis estimating hemoglobin and RDW can be used for
identification of children in need for iron therapy.
Conclusions: In India and similar settings, RDW >15% with hemoglobin ≤10.0 g/dL identifies iron deficient anemic
children without need for iron status markers which could help reduce cost of management especially in
poor settings.
Trial registration: Clinicaltrials.gov NCT00255385.
Keywords: Iron deficiency anemia, Red cell distribution width, RDW, Receiver’s operating characteristic curve, ROC,
Screening, Sensitivity, Specificity, Children
* Correspondence:
1
Center for Micronutrient Research, Annamalai University, Annamalai Nagar,
India
2
Department of International Health, Johns Hopkins Bloomberg School of
Public Health, 615, North Wolfe Street, Baltimore, MD 21205-2103, USA
Full list of author information is available at the end of the article
© 2014 Sazawal et al.; licensee BioMed Central Ltd. This is an Open Access article distributed under the terms of the Creative
Commons Attribution License ( which permits unrestricted use, distribution, and
reproduction in any medium, provided the original work is properly cited. The Creative Commons Public Domain Dedication
waiver ( applies to the data made available in this article, unless otherwise
stated.
Sazawal et al. BMC Pediatrics 2014, 14:8
/>
Background
Iron deficiency is the most common micronutrient deficiency among Indian preschool children contributing to
increased burden of morbidity and mortality and the most
significant negative consequence of iron deficiency is
iron deficiency anemia (IDA). Recent NFHS–III surveys
(2005–06) have shown that 70-85% (approx. 79.2%) of Indian young children have anemia [1]. IDA is attributed to
inadequate iron intake, poor bioavailability of iron or high
nutritional needs during childhood which is further exacerbated by chronic intestinal blood losses due to helminth
infections and in many areas due to severe malarial infections [2,3]. Studies have shown that iron deficiency causes
delay in cognitive development and poor motor and sensory system functioning and that iron supplementation in
early years may prevent these complications among children [4]. Conversely, there is an evidence suggesting that
routine iron treatment in non-iron deficient children may
have adverse consequences for morbidity and infections
[5,6]. Therefore, it is very important to detect iron deficiency (ID) at its earliest stage in children especially in a
low resource setting and replenish the iron stores by
proper supplementation, thereby preventing many of the
adverse developmental and behavioral effects caused by
IDA. Currently, the detection of IDA is largely dependent
upon quantification of biochemical markers like serum
ferritin (SFr), serum transferrin (STr) and zinc protoporphyrin (ZnPP) which are not routinely available and affordable in developing countries due to high costs.
Moreover, these tests are altered by inflammation, which
limits their applicability for clinical interpretation, especially in areas with high infection rates. Another limitation
of the commonly used hematological tests is their poor
sensitivity or specificity as they can be modified by conditions other than iron deficiency. Studies have shown that
RDW in addition to other hematological markers like
mean corpuscular volume (MCV) and hemoglobin can be
used as a differential diagnostic tool for identification of
iron deficiency anemia [7-9]. Various studies also show
that the onset of iron deficiency anemia can be predicted
using automated blood analyzers [7], as a low haemoglobin level along with a high level of anisocytosis detectable
by red cell distribution width prove to be good indicators
of changes in blood due to depleted iron stores [8]. It
seems that the earliest hematological manifestation of iron
deficiency is marked by an elevated level of RDW [9] and
reports have shown that it is a cost-effective screening tool
for early diagnosis of IDA in comparison to SFr and ZnPP
[9-11]. The red blood cell (RBC) distribution width, a
measure of variations in the width of circulating RBCs, reported as a part of complete blood count [12] has been
known to be of value in the discrimination of iron deficiency anemia from other causes of microcytic anemia,
but studies in pediatric populations are lacking. Thus, in
Page 2 of 6
the present study we evaluated the discriminative ability of
RDW diagnostic test for detecting iron deficiency anemia
among children aged 1–3 yrs in a low socio-economic setting using receiver’s operating characteristic curve (ROC)
analyses.
Methods
These findings are from a community based double blind
randomized controlled trial conducted in Sangam Vihar, a
peri-urban population in New Delhi, India to evaluate the
effects of fortified milk for one year on common childhood morbidities, hematological markers (anemia/iron
stores), growth and development of young children aged
1–3 years. In this trial we evaluated the effect of 2 separate
interventions in comparison to their respective controls.
The findings of these studies have been published previously [13,14]. The study protocol was approved by the human research and ethical review boards of the Johns
Hopkins Bloomberg School of Public Health, USA and the
Annamalai University, India. Informed written consent
was obtained from the parents of the children who were
willing to participate in the study.
Between April 2002 and April 2003, all eligible consented children were scheduled to visit the clinic for the
baseline evaluation. At the clinic, study physician carried
out detailed physical examination of child and socioeconomic/demographic information of the family was collected. Baseline and end study blood sample reports were
analyzed and a total of 2091 samples were included in this
analysis.
Laboratory investigations
Approximately 3 ml of venous blood sample was collected
using a trace element-free syringe and immediately transferred into ethylenediaminetetraacetic acid (EDTA) vials
and trace element-free heparin vials. Plasma was separated within 15 minutes of blood collection, and the
contents of aliquot were transferred into trace elementfree Eppendorf plastic tubes for storage at −20°C. The
EDTA blood was analyzed on the same day with Coulter
automated flow cytometer (Beckman Coulter, Fullerton,
CA) for a detailed hemogram. One drop of blood was
used for estimating ZnPP using a hematofluorometer
(Aviv Biomedical, Lakewood NJ, USA). The hematoflurometer was calibrated and quality control checks
were routinely performed with controls and calibrators provided by the manufacturer (AVIV Biomedical,
Lakewood, NJ, USA). SFr was estimated using a commercial enzyme linked immunosorbent assay (Ramco
Laboratories, Houston, USA).
In retrospective design, we analyzed hematological parameters of children aged 1–3 years. Anemia was defined
as hemoglobin (Hb) concentration ≤10 g/dL. A lower cutoff was selected instead of the World Health Organisation
Sazawal et al. BMC Pediatrics 2014, 14:8
/>
(WHO) cut-off of 11 g/dL because majority of the iron
deficient anemic children had Hb ≤10 g/dL. In order to
test the sensitivity and specificity of RDW, the gold
standard definition used for categorizing iron deficient
anemia was: Hb concentration ≤10 g/dL and SFr <11 μg/L
or ZnPP >80 μmol/mole of heme [15].
ROC analysis was performed to examine the sensitivity
and specificity of RDW in discriminating IDA. Positive
and negative predictive values and area under the curve
were also calculated. ROC curve analysis was obtained by
plotting sensitivity versus 1-specificity. This method allows
comparison of the sensitivity of a given test to that of another at the same level of specificity. The sensitivity and
specificity along with positive and negative predictive
value at various cut-offs of RDW was calculated against
the gold standard definition for iron deficiency anemia to
arrive at an optimal cut-off value in our population. After
obtaining a cut-off value of RDW a simple algorithm was
used where RDW (cut-off value) and Hb ≤10 g/dL were
used as a predictor for classifying IDA.
All statistical analysis was carried out using SPSS/PC
Statistical ProgramVersion 18.0 (SPSS, Chicago, IL) and
STATA version 10.0 (StataCorp, College Station, TX).
Results
Basic demographic and biochemical characteristics of samples with iron deficient anemia and without iron deficient
anemia are shown in Table 1. Of the 2091 blood reports of
children analyzed, 1026 samples (49.06%) were classified as
iron deficient anemia by gold standard. There was a mark
difference in the values for various biochemical markers in
iron deficient anemic and non-iron deficient anemic children. Mean values of Hb, mean corpuscular hemoglobin
(MCH), MCV and SFr were markedly higher in non iron
deficient anemic children as compared to iron deficient
anemic children. As many studies have found SFr [16,17]
and ZnPP [18] as one of the best biochemical indicators of
iron deficiency anemia hence we used Hb along with SFr
or ZnPP to define IDA for the present analysis.
Page 3 of 6
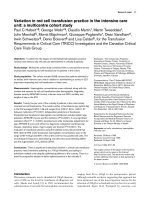
ROC analysis of RDW for detecting iron deficiency
anemia is shown in Figure 1. As a marker of overall efficiency, area under the curve for RDW was 83% (95% CI,
81% - 85%; p < 0.001) (Figure 1). Table 2 shows the sensitivity, specificity, positive and negative predictive values at
various cut-offs of RDW against the gold standard definition for iron deficiency anemia. Sensitivity of RDW at
cut-off of 18% to detect iron deficiency anemia was 76.5%
and specificity of 73.1%. This cut-off yielded a positive predictive value of 73% and negative predictive value of 76%.
At a cut-off of RDW 16.4%, the sensitivity was 94.2%
and at a cut-off of 21%, the specificity was 95%. The algorithm using RDW value of >15% with Hb ≤10 g/dL
was found to be more efficient. A second ROC analysis
was performed using this algorithm as a predictor of
IDA. Combination of Hb ≤10 g/dL and RDW >15%,
yielded a sensitivity of 99% and specificity of 90%. The
positive predictive value was 90% and the negative predictive value was around 99%.
Discussion
The high incidence of IDA in children emphasizes the
need for the cost effective and reliable tool in diagnosing IDA. A number of different indicators, such as
hemoglobin, hematocrit, serum ferritin, transferrin saturation, erythropoietin, erythrocyte protoporphyrin,
serum iron, mean corpuscular volume, mean corpuscular hemoglobin concentration have been used to evaluate IDA [11,19-21]. But the drawbacks of these tests are
that many of them are expensive and require sophisticated laboratories, while others have been found to have
a low specificity. It has been seen that anisocytosis occurs, where the erythrocytes produced are of smaller
than average size and having a large size variation, due
to inadequate iron supply. The morphology and function of erythrocytes at molecular level has been known
to be disturbed due to iron deficiency anemia [22].
Therefore, an increase in RDW values may occur in
IDA allowing an early detection of ID before reduction
in MCV occurs. RDW has been reported to have a high
Table 1 Demographic and biochemical profile of samples with iron deficient anemia and without iron deficient anemia
Variables
Samples with iron deficiency anemia (n = 1026)
Samples without iron deficiency anemia (n = 1065)
Mean age (months)
25.5 ± 8.4
31.6 ± 9.8
Gender: males (%)
522 (50.9)
553 (51.9)
Mean hemoglobin (g/dL)
8.4 ± 1.2
10.9 ± 1.0
Mean MCH (pg)
20.0 ± 3.3
24.2 ± 2.3
Mean MCV (fl)
69.6 ± 8.4
78.9 ± 6.4
Mean RDW (%)
19.9 ± 2.4
16.8 ± 2.5
Mean serum ferritin (μg/L)
6.2 ± 5.8
16.3 ± 14.1
Mean ZnPP (μmol/mole of heme)
229.7 ± 126.3
74.4 ± 45.6
Results are given as the mean ± SD unless specified.
Abbreviations: MCH Mean corpuscular hemoglobin, MCV Mean corpuscular volume, RDW Red cell distribution width, ZnPP Zinc protoporphyrin.
Sazawal et al. BMC Pediatrics 2014, 14:8
/>
Page 4 of 6
Area
Std. Error(a)
Asymptotic Sig.(b)
Asymptotic 95% Confidence
Interval
Lower Bound Upper Bound
0.830
0.009
0.001
0.813
0.847
Figure 1 ROC curve analysis. Receiver operating characteristic
curve analysis for RDW detecting iron deficiency anemia. The
diagonal line represents the ROC curve for a test with no clinical
value (i.e. area under the curve = 0.500).
predictive value for IDA [9,23] and can differentiate
beta-thalassemia from other causes of anemia in populations [24,25]. Our results corroborate the view that
RDW evaluated in a large sample performed very well
as a screening diagnostic test for identifying iron deficiency anemia. These findings are similar to the findings
of earlier studies conducted in other settings and support the usage of RDW as a screening tool for identifying iron deficiency anemia [26].
Other studies found the sensitivity of RDW to be
very high (96 -100%) in detecting iron deficiency
anemia [27,28]. On the contrary, there is a report of a
limited specificity of RDW for diagnosis of IDA among
children with microcytic hypochromic anemia [29]. At
a cut-off value of 17.4%, as obtained from the ROC
curve, the sensitivity and specificity of RDW in diagnosis of IDA were 81.0% and 53.4% and a positive
and negative predictive value of 63.0% and 72.2%,
respectively.
One of the other approaches used to predict IDA is the
use of indexes such as Mentzler’s, discriminant function,
Srivastava’s, Shine and Lal’s, MCV/MCH indices which
are based on many hematological parameters instead of
one [30]. In our study also, when we used Hb and RDW
together the sensitivity and specificity improved considerably with high positive and negative predictive values.
These data suggest that the combined approach of using
Hb ≤10 g/dL and RDW >15% (sensitivity of 99% and specificity of 90%, positive predictive value of 90.5% and negative predictive value of 98.9%) performs well obviating the
need for using expensive biochemical tests for diagnosing
iron deficiency anemia in a low resource setting.
The strengths of the present study include the large
number of standardized measurements and the use of
ROC curves, which can summarize all the sensitivities and
specificities in one diagram and can identify which cut-off/
indicator has the highest sensitivity and specificity for the
predictor variable. The prevalence of thalassaemia trait
was 1.4% and thalassaemia major was 0% in the study
population. Our results suggest very low prevalence of
thalassaemia in our population and can thus be easily extrapolated in other similar settings.
The limitation of the present study is that a higher prevalence of subclinical infections, latent inflammatory disorders and other nutritional deficiencies like folic acid in our
population, unlike the Western population, can falsely raise
SFr levels, thereby suggesting that probably we need to redefine the acceptable normal range of SFr levels among
our population. However, we have in our recent studies
included the estimation of α1-Acid glycoprotein and Creactive protein as markers for infections (Unpublished
data; ClinicalTrials.gov Identifier: NCT00980421). The etiological fraction contributed by positivity of either or both to
overall anemia prevalence was very low and correcting for
it or after eliminating children with positive values did not
change the prevalence estimates for anemia. In addition, although, the subjects of the study were from a randomized
controlled trial for fortified milk, the results reported in this
manuscript are retrospective observations. Retrospective
studies are susceptible to bias in data selection and analysis.
Furthermore, confounding variables may go unrecognized
because of inadequate knowledge of how they interrelate
with the outcome of interest thus rarely establishes the
causal relationships.
Table 2 Sensitivity, specificity, positive and negative predictive values of RDW in diagnosing iron deficiency anemia
Cut-offs (values in %)
Sensitivity (%)
Specificity (%)
PPV (%)
NPV (%)
RDW- 18%
76.5
73.1
73.21
76.4
RDW- 16.4%
94.2
50.7
64.74
90.1
RDW- 21%
28.5
95
84.56
58.03
Hb ≤10 g/dL and RDW >15%
99
90
90.49
98.9
Abbreviations: RDW Red cell distribution width, Hb Hemoglobin, PPV Positive predictive value, NPV Negative predictive value.
Sazawal et al. BMC Pediatrics 2014, 14:8
/>
Conclusions
In conclusion, RDW > 15% and hemoglobin ≤10.0 g/dL
measured using a simple coulter can be used as a valuable
screening tool for identifying children with iron deficiency
anemia in a low socio-economic setting. Although it needs
to be further investigated in other populations, there is no
reason to believe that results will vary from the present
study. If these findings are confirmed in other settings as
well, it offers a very useful tool for screening iron deficient
anemic children without need for more expensive iron
status marker investigations.
Abbreviations
EDTA: Ethylenediamine tetraacetic acid; Hb: Hemoglobin; ID: Iron deficiency;
IDA: Iron deficiency anemia; MCH: Mean corpuscular hemoglobin;
MCV: Mean corpuscular volume; NFHS: National family health survey;
RBC: Red blood cell; RDW: Red cell distribution width; ROC: Receiver’s
operating characteristic curve; SFr: Serum ferritin; STr: Serum transferrin
receptors; ZnPP: Zinc protoporphyrin; WHO: World Health Organisation.
Competing interest
The authors declare that they have no competing interest.
Authors’ contributions
SS, VM and RB coordinated the trial and made a primary contribution to its
development, rationale, design, and undertaking, analysis of data, and
revised the manuscript for important intellectual content. UD and AD
contributed to implementation of the trial, quality control and were
responsible for programming, data management, and analysis. PD
contributed to the analysis of data and manuscript preparation. HS
contributed to revising and analyzing the manuscript. All authors read and
approved the final manuscript.
Acknowledgements
We gratefully acknowledge the contributions and support of participating
children, their parents, and the study team. We acknowledge support
from The Pathlab, East of Kailash, New Delhi, for the analysis of
blood samples.
Page 5 of 6
6.
7.
8.
9.
10.
11.
12.
13.
14.
15.
16.
17.
18.
Author details
1
Center for Micronutrient Research, Annamalai University, Annamalai Nagar,
India. 2Department of International Health, Johns Hopkins Bloomberg School
of Public Health, 615, North Wolfe Street, Baltimore, MD 21205-2103, USA.
3
Center for Public Health Kinetics, New Delhi, India.
19.
20.
Received: 30 September 2013 Accepted: 2 January 2014
Published: 15 January 2014
References
1. Lahariya C, Khandekar J: How the findings of national family health
survey-3 can act as a trigger for improving the status of anemic mothers
and undernourished children in India: A review. Indian J Med Sci 2007,
61(9):535–544.
2. Stoltzfus RJ, Chwaya HM, Montresor A, et al: Low dose daily iron
supplementation improves iron status and appetite but not anemia,
whereas quarterly anthelminthic treatment improves growth,
appetite and anemia in Zanzibari preschool children. J Nutr 2004,
134:348–356.
3. Stoltzfus RJ, Chwaya HM, Tielsch JM, et al: Epidemiology of iron deficiency
anemia in Zanzibari school children: the importance of hookworms.
Am J Clin Nutr 1997, 65:153–159.
4. Lozoff B: Iron deficiency and child development. Food Nutr Bull 2007,
28(4 Suppl):S560–S571.
5. Sazawal S, Black RE, Ramsan M, et al: Effects of routine prophylactic
supplementation with iron and folic acid on admission to hospital and
mortality in preschool children in a high malaria transmission setting:
community-based, randomised, placebo-controlled trial. Lancet 2006,
367:133–143.
21.
22.
23.
24.
25.
26.
27.
Iannotti LL, Tielsch JM, Black MM, Black RE: Iron supplementation in
early childhood: health benefits and risks. Am J Clin Nutr 2006,
84(6):1261–1276.
Uchida T: Change in red blood cell distribution width with iron
deficiency. Clin Lab Haematol 1989, 11(2):117–121.
Dugdale AE: Predicting iron and folate deficiency anemias from
standard blood testing: the mechanism and implications for clinical
medicine and public health in developing countries. Theor Biol Med
Model 2006, 3:34.
Viswanath D, Hegde R, Murthy V: Red cell distribution width in diagnosis
of iron deficiency anemia. Indian J Pediatr 2001, 68:11–17.
Burk M, Arenz J, Glagounidis AA, Schneider W: Erythrocyte indices as
screening tests for the differentiation of microcytic anemia. Eur J Med Res
1995, 1(1):33–37.
van Zeben D, Bieger R, van Wermeskerken RK, Castel A, Hermans J:
Evaluation of microcytosis using serum ferritin and red blood cell
distribution width. Eur J Haematol 1990, 44:106–109.
Patel KV, Ferrucci L, Ershler WB, et al: Red blood cell distribution width and
the risk of death in middle-aged and older adults. Arch Intern Med 2009,
169:515–523.
Sazawal S, Dhingra U, Dhingra P, Hiremath G, Kumar J, Sarkar A, Menon VP,
Black RE: Effects of fortified milk on morbidity in young children in north
India: community based, randomised, double masked placebo
controlled trial. BMJ 2007, 334(7585):140.
Sazawal S, Dhingra U, Hiremath G, Sarkar A, Dhingra P, et al:
Prebiotic and probiotic fortified milk in prevention of morbidities
among children: community-based, randomized, double-blind,
controlled trial. PLoS One 2010, 5(8):e12164. doi:10. 1371/journal.
pone.0012164.
Stoltzfus RJ, Chwaya HM, Albonico M, Schulze KJ, Savioli L, Tielsch JM:
Serum ferritin, erythrocyte protoporphyrin and hemoglobin are valid
indicators of iron status of schoolchildren in a malaria holoendemic
population. J Nutr 1997, 127:293–298.
Dallman PR, Reeves JD: Laboratory diagnosis of iron deficiency. In Iron
nutrition in infancy and childhood. Edited by Stekel A. New York: Raven
Press; 1984:11–44.
Dallman PR, Looker AC, Johnson CL, Carroll M: Influence of age on
laboratory criteria for the diagnosis of iron deficiency anemia and
iron deficiency in infants and children. In Iron nutrition in health and
disease. Edited by Hallberg L, Asp NG. London: John Libbey & Company
Ltd; 1996:65–74.
Siegel RM, Lagrone DH: The use of zinc protoporphyrin in screening
young children for iron deficiency. Clin Pediatr (Phila) 1994, 33(8):473–479.
Demayer EM, Dallman P, Gurney L, Hallberg L, Sood SK, Srikantia SG:
Preventing and controlling iron deficiency anaemia through primary health
care. A guide for health administrators and programme managers. Geneva:
WHO; 1989:22–28.
Yip R, Stoltzfus RJ, Simmons WK: Assessment of the prevalence and the
nature of iron deficiency for populations: the utility of comparing
hemoglobin distributions. In Iron in health and disease. Edited by Hallburg
L, Nils-Georg A. London: John Libbey & Co; 1996:31–48.
Oski F: Iron deficiency in infancy and childhood. N Engl J Med 1993,
15:190–193.
Zhang Y, Zhang W, Wang S, Xie J, Chen X, Xu Y, Mao P: Detection of
erythrocytes in patients with iron deficiency anemia using atomic
force microscopy. Scanning 2012, 34(4):215–220.
doi 10.1002/sca.20296.
Melo MR, Purini MC, Cancado RD, Kooro F, Chiattone CS: The use of
erythrocyte (RBC) indices in the differential diagnosis of microcytic
anemias: is it an approach to be adopted? Rev Assoc Med Bras 2002,
48:222–224.
Qurtom HA, al-Saleh QA, Lubani MM, et al: The value of red cell
distribution width in the diagnosis of anaemia in children. Eur J Pediatr
1989, 148:745–748.
Aslan D, Gumruk F, Gurgey A, Altay C: Importance of RDW value in
differential diagnosis of hypochrome anemias. Am J Hematol 2002,
69:31–33.
McClure S, Cluster E, Bessman JD: Improved detection of early iron
deficiency in anemia subjects. JAMA 1985, 253(7):1021–1023.
Bessman JD, Gilmer PR, Gardner FH: Improved classification of anemias by
MCV and RDW. Am J Clin Pathol 1983, 80(3):322–326.
Sazawal et al. BMC Pediatrics 2014, 14:8
/>
Page 6 of 6
28. Das Gupta A, Hegde C, Mistri R: Red cell distribution width as a measure
of severity of iron deficiency in iron deficiency anemia. Indian J Med Res
1994, 100:177–183.
29. Aulakh R, Sohi I, Singh T, Kakkar N: Red cell distribution width (RDW) in
the diagnosis of iron deficiency with microcytic hypochromic anemia.
Indian J Pediatr 2009, 76(3):265–267.
30. Akai Y, Kubota F, Bichile SK, et al: A study of β Thalassemia screening
using an automated hematology analyzer. Sysmex J Int 1998, 8:110–114.
doi:10.1186/1471-2431-14-8
Cite this article as: Sazawal et al.: Efficiency of red cell distribution width
in identification of children aged 1-3 years with iron deficiency anemia
against traditional hematological markers. BMC Pediatrics 2014 14:8.
Submit your next manuscript to BioMed Central
and take full advantage of:
• Convenient online submission
• Thorough peer review
• No space constraints or color figure charges
• Immediate publication on acceptance
• Inclusion in PubMed, CAS, Scopus and Google Scholar
• Research which is freely available for redistribution
Submit your manuscript at
www.biomedcentral.com/submit