Are the special educational needs of children in their first year in primary school in Ireland being identified: A cross-sectional study
Bạn đang xem bản rút gọn của tài liệu. Xem và tải ngay bản đầy đủ của tài liệu tại đây (623.18 KB, 9 trang )
Curtin et al. BMC Pediatrics 2014, 14:52
/>
RESEARCH ARTICLE
Open Access
Are the special educational needs of children in
their first year in primary school in Ireland being
identified: a cross-sectional study
Margaret Curtin1*, Denise Baker1, Anthony Staines2 and Ivan J Perry1
Abstract
Background: If the window of opportunity presented by the early years is missed, it becomes increasingly difficult
to create a successful life-course. A biopsychosocial model of special educational need with an emphasis on participation
and functioning moves the frame of reference from the clinic to the school and the focus from specific conditions to
creating supportive environments cognisant of the needs of all children. However, evidence suggests that an emphasis
on diagnosed conditions persists and that the needs of children who do not meet these criteria are not identified.
The Early Development Instrument (EDI) is a well-validated, teacher-completed population-level measure of five
domains of child development. It is uniquely placed, at the interface between health and education, to explore the
developmental status of children with additional challenges within a typically developing population. The aim of
this study was to examine the extent to which the special educational needs of children in their first year of formal
education have been identified.
Methods: This cross-sectional study was conducted in Ireland in 2011. EDI (teacher completed) scores were calculated
for 1344 children. Data were also collected on special needs and on children identified by the teacher as needing
assessment. Mean developmental scores were compared using one-way ANOVA.
Results: Eighty-three children in the sample population (6.2%) had identified special educational needs. A further 132
children were judged by the teacher as needing assessment. Children with special needs had lower mean scores than
typically developing children, in all five developmental domains. Children considered by the teacher as needing
assessment also had lower scores, which were not significantly different from those of children with special needs.
Speech, emotional or behavioural difficulties were the most commonly reported problems among children needing
further assessment. There was also a social gradient among this group.
Conclusions: A small but significant number of children have not had their needs adequately assessed. Teacher
observation is an effective means of identifying children with a level of impairment which prevents them from fully
participating in their educational environment and could be integrated into a multi-disciplinary approach to meeting
the needs of all children.
Keywords: Child development, Special educational needs, Population-health, Social determinants of health, Educational
needs assessment
* Correspondence:
1
Department of Epidemiology and Public Health, University College Cork,
Floor 4, Western Gateway Building, Cork, Ireland
Full list of author information is available at the end of the article
© 2014 Curtin et al.; licensee BioMed Central Ltd. This is an Open Access article distributed under the terms of the Creative
Commons Attribution License ( which permits unrestricted use, distribution, and
reproduction in any medium, provided the original work is properly credited.
Curtin et al. BMC Pediatrics 2014, 14:52
/>
Background
If the window of opportunity presented by the early years
is missed, it becomes increasingly difficult, in terms of
both time and resources, to create a successful life course
[1]. The foundations for virtually every aspect of human
development – physical, intellectual and emotional are laid in early childhood [2]. Yet for many children
developmental delay remains undetected until the formal
education years leading to a greater risk of academic failure, behavioural problems and long term socio-economic
disadvantage [3].
An understanding of child development as a social
process of interaction between children and their environment [4] is compatible with a shift from a ‘medical’ to a
‘social’ understanding of disability and special educational
needs [5]. A biopsychosocial model of child development
with an emphasis on participation, functioning and the
child’s ability to interact with their environment underpins
the World Health Organisation’s International Classification
of Functioning (ICF) Disability and Health [6] and has led
to a shift from a deficit model of individual disability to a
focus on inclusive education and interdisciplinary working
between education, health and social services [7]. This
moves the frame of reference from the clinic to the school
and the focus from children identified through a standard,
predominantly biomedical, framework to those identified
by teachers as requiring additional support [8].
Children with special educational needs should be
identified as early as possible. Early intervention is vital
but to obtain this an early assessment is needed. Ideally
children should be assessed in pre-school, as the earlier
the assessment, the greater the chance he or she has of
developing coping strategies [9].
In Ireland, the Education of Persons with Special
Educational Needs (EPSEN) Act of 2004 provides a legislative underpinning for inclusive education for all children
with an identified educational need, not confined to those
with an identifiable disability or diagnosis [10]. However,
the Irish systems and services have not changed in line
with the act resulting in an emphasis on identified medical
conditions instead of participation and functioning [11].
Children with less clearly defined needs are therefore less
likely to benefit [12].
Distinction is also necessary between assessment for the
purpose of identifying children’s learning needs and assessment for the purpose of resource allocation. Where this
distinction becomes blurred, children are at risk of being
prematurely labelled in an attempt to ensure that they
qualify for support [13]. Qualitative studies suggest that,
in Ireland, this emphasis on diagnosis persists [12,14,15].
The Early Development Instrument
This study used the Early Development Instrument (EDI)
to assess the development status of children in their first
Page 2 of 9
year of formal education [16]. The EDI is a well-validated,
teacher-completed population level measure of five domains of child development at school entry age designed at
the Offord Centre for Child Studies, McMasters University,
Hamilton, Ontario in the late 1990s [17]. It is uniquely
placed, at the interface between health and education, to
explore the developmental status children with additional
challenges in the context of a typically developing population. At the same time, the EDI is a population level measure and not a diagnostic tool. It is based on the premise
that universal approaches work best in improving long
term developmental outcome for all children and provides
evidence to establish the incidence and distribution of developmental delay and to identify populations of children
at greater risk [18].
The instrument consists of five domains and 104 questions. The domains are Physical health and well-being (fine
an gross motor skills, physical readiness for the school day
and child health); Social competence (self-confidence, ability
to play, get along with others and share); Emotional
maturity (ability to concentrate, help others, patient,
not aggressive or angry); Language and cognitive development (interest in reading and writing, ability to count and
recognise numbers and shapes); and Communication skills
and general knowledge (ability to tell a story, communicate
with adults and children, articulate themselves) [16].
This study, for the first time, within a typically developing
Irish population, quantified the extent to which the special
educational needs of children in their first year of formal
education are being met. The aim of this study was to
examine, at a population level, using EDI data, the extent
to which children in their first year of formal education
have their developmental and special educational needs
identified.
Methods
This cross-sectional study of child development using
the EDI was implemented with children in their first
year of formal education (in Ireland this is referred to as
‘Junior Infants’) in 42 out of 47 primary schools in Cork
city in April/May 2011 and a further five schools in an
adjoining rural community. Five schools in the city declined
to participate. These declining schools were representative
of a cross section of schools in the city and would not affect
the composition of the study [16]. Parents of all eligible
children in the participating schools were informed about
the study and invited to have their child included. Eligibility
criteria were: being in the latter half of the first year of formal education, being in the class more than one month
and not having left the school.
Ireland is a largely homogenous country and Cork city
is typical of the Irish urban population. Moreover, the
education system is consistent throughout the country,
with all schools adhering to nationally defined curriculum
Curtin et al. BMC Pediatrics 2014, 14:52
/>
and standards. Therefore, the study is representative of
the situation of children in Irish schools.
Data collection
The EDI was used to measure child development at
school entry age. It is a teacher completed questionnaire
based on five months observation of the children from
the date when they start school, and was, therefore,
implemented in the latter half of the first year of formal
education. Prior to completing the questionnaires, the
teachers were given a short training and each issued with
an EDI guide book. Children were not present when the
questionnaire was completed and no individual identifiers
were recorded. Passive consent was used in line with EDI
studies conducted in Canada. The class teacher distributed
an information letter to all parents two weeks before the
study commenced. This contained detailed information on
the study and parents were asked to contact the school
if they did not want their child included (in total seven
parents opted for their child not to be included). A form
ID was assigned to each child which was used on both
the EDI and Parental Questionnaire [16].
Ethics statement
Ethical approval for the study was granted by the Clinical
Ethics Committee of the Cork Teaching Hospitals. Passive
consent (i.e. parents were given information on the study
and asked to contact the school if they did not want their
child included) was used as children were not present
when the questionnaire was completed and no individual
identifiers were provided to the research team. This is in
line with international best practice in EDI studies [19].
Page 3 of 9
filled questionnaire using the Form ID number and
crosschecked using the recorded date of birth and gender.
Questions were constructed in a Likert type response
format - yes, no or three to five response options.
Independent variables
For the purposes of this study three specific groups of
children were identified and compared (see Figure 1).
These were:
1 Children with special needs
Children in the ‘special needs’ group refers to those
who had been identified as needing special
assistance in the classroom through the nationally
recognised assessment process. In Ireland this is
defined as having a ‘Special Education Condition’
which has been recognised through a standardised
assessment procedure [23]. In Section 1 of the EDI
questionnaire teachers reported on whether the
child had a special need identified through the above
process. This did not seek the teacher’s opinion only
information on whether the child had already
received this designation.
2 Needs further assessment
Children who needed further assessment were those
who had not been identified as having a Special
Educational Condition through the standardised
national assessment process but whom the teacher,
Parental questionnaire
In 2003 the Offord Centre developed and tested a parental
questionnaire to complement the results of the EDI and
provide a deeper population level context to the lives of
children [20]. We adjusted the questionnaire to suit the
Irish context and incorporated questions from the Growing
Up in Ireland study [21] and the SLAN Study of Lifestyle,
Behaviour and Nutrition in Ireland [22].
The parental questionnaire provided contextual data
on many aspects of the children’s lives which have been
described elsewhere [16]. However, in this study we were
specifically interested in and only used data collected on
utilisation of developmental support services.
The parental questionnaires were administered at the
same time as the EDI and were distributed in school bags
or homework folders. Each parental pack contained a letter of explanation, questionnaire (again with no individual
identifier) and a blank envelope in which to return the
questionnaire sealed to the school. Parents were reassured
that the envelope would not be opened at the school. Data
from the parental questionnaires was linked to the teacher
Figure 1 Participant flow chart.
Curtin et al. BMC Pediatrics 2014, 14:52
/>
based on her observation in the classroom, believed
were in need of assessment. As part of the EDI
questionnaire the teacher was asked whether, in her
opinion, the child needed assessment.
3 Typically developing children
This refers to children who did not have a previously
identified special need and who were not deemed by
the teacher as needing further assessment.
Page 4 of 9
Canadian normative data. There was a 99% correlation
between ‘vulnerability’ using the Irish and Canadian cut-off
points. In four of the five domains there was 100% correlation between vulnerability using the Irish and Canadian
cut-off points. Moreover, the EDI is a well validated instrument on which extensive psychometric testing has been
conducted in both in Canada and Australia [17,19,25-27].
In the current study the EDI had good internal consistency
by domains with Cronbach's α of between 0.8 and 0.96.
Dependant variables
Children in the three groups outlined above were compared
using a number of variables. Comparisons were primarily
made on EDI mean scores and vulnerability rates but also
in relation to type of impairment, services accessed and
residence in an area of deprivation/affluence. Data on EDI
scores and type of impairment were obtained from the EDI
questionnaire. Data on services accessed came from the
parental questionnaire and data on area-level deprivation
from the Irish National Deprivation Index for Health and
Health Service Research 2013 (SAHRU Index) [24].
The child’s age was calculated using their date of birth
and the date on which the form was completed and reported in years and months. Children for whom English
was a second language (ESL) were those reported by the
teacher to have a first language other than English.
EDI scores
EDI scores were calculated for each developmental domain
i.e. Physical Health and Well-being; Social Competence;
Emotional Maturity; Language and Cognitive Development;
and Communication Skills and General Knowledge. All
questions had either a binary or 2 or 3 point Likert type
response format (yes, no, don’t know; very true, sometimes
or somewhat true, never or not true, don’t know). All
responses had a score of 0 to 10 (2 point answers were
scored 0 and 10; 3 point answers were scored 0, 5 and 10).
'Don’t know' responses were not scored. If 30% of questions in any domain were not scored, that domain is not
included. If more than one domain was excluded then that
child’s score was not considered valid and excluded from
the study. Domain scores referred to the child’s mean
score in that domain - ranging between 0 and 10. Higher
scores indicated better results.
Vulnerability rate
Children who scored in the lowest 10% of the study
population in one or more of the five domains of the
EDI were classed as ‘vulnerable’ [25]. Each domain was
scored separately as children who were vulnerable in
one area could not compensate through competence in
another. Individual vulnerability was not reported rather
vulnerability rates, expressed as percentages are used. In
the absence of an Irish normative sample, to ensure the
validity of the cut-off points, data was also scored against
Impairment (specific problems)
In addition to questions aimed at assessing child development a section of the EDI questionnaire focused on specific
problems. The teacher was asked whether the child had
any impairment which influenced their ability to do regular
classroom work and also whether s/he felt that the child
needed further assessment.
Impairment referred to seven categories of problems
that influenced the child’s ability to do school work in a
regular classroom. These were listed on the EDI questionnaire, namely: physical impairment, visual impairment,
hearing impairment, speech impairment, learning disability,
behaviour problem or emotional problem. These were
based on difficulties experienced by the child, not diagnosis.
If children experience difficulty in more than one category,
each was included.
Services accessed (parental report)
This information was obtained from the parental questionnaire. Parents were asked if their child had received
help from any of a list of seven development support
services: speech and language services; blind or low vision
services; occupational of physical therapy; hearing services;
programmes/ services for behavioural issues; programmes/
services for developmental issues; or mental health programmes/services. Parents were only asked if the child
had ever ‘received help’ from the service and information
was not included regarding the nature or extent of the
support received from that service.
Area-level deprivation
The Irish National Deprivation Index for Health and
Health Service Research 2013 (SAHRU Index) was used
as a measure of deprivation. The index is based on a
score calculated at the level of Electoral Division (3409
EDs in Ireland) using principal components analysis
from a weighted combination of four indicators from
the 2011 census, namely unemployment, low social class,
local authority housing and no car [24]. Children were
identified as residing in one of five quintiles ranging
from most to least deprived based on their electoral
division.
Curtin et al. BMC Pediatrics 2014, 14:52
/>
Page 5 of 9
Data analysis
Data analysis was conducted using SPSS. Initial scoring
of the EDI data was conducted at the Offord Centre for
Child Studies as part of the licensing agreement but all
further analysis was conducted in University College Cork.
Children were categorised into three groups, as outlined
above. The mean scores in each of the five domains of
development measured using the EDI were compared
across the three groups of children using analysis of variance (ANOVA). As equality of variance could not be assumed, we used Tamhane’s T2 post hoc test to evaluate
the mean difference between the groups. Residuals were
tested for normal distribution.
Results
EDI questionnaires were distributed to teachers of 1474
children in their first year of formal education in 47
schools (see Figure 1). A total of 1344 (91%) were completed and valid, 52.3% of which related to boys. Of the
1344 children, 83 (6.2%) had previously been identified
as having special needs, the majority of whom (68%)
were boys. A further 132 children (10%) were judged
by the teacher to need further assessment. Again, boys
predominated at 66%. There was no significant difference
in the mean age between typically developing children,
children who had an identified special need and the third
group of children who were classed by the teacher as in
need of further assessment. Demographic characteristics
of the study population are outlined in Table 1.
Developmental vulnerability
The study showed that 27% of children in the study
population were developmentally vulnerable (i.e. in the
lowest 10% of the population in at least one domain) at
school entry age. The vulnerability rate rose to 78%
among children with an identified special need and 69%
among children who did not have a special need but whom
the teachers identified as needing further assessment. There
was a strong correlation between vulnerability on the EDI
and needing further assessment (correlation coefficient =
0.379, p < 0.001).
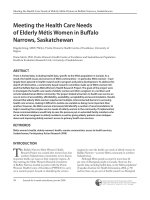
Mean scores for each group
Typically developing children had high mean scores
across all domains (Table 1) and were, therefore, more
likely to be developmentally ready to engage in school
than those children who were identified with special
educational needs or in need of further assessment.
Mean scores across all five domains of development
for each of the three groups are outlined graphically in
Figure 2.
When the mean scores in each domain were compared
across the three groups using ANOVA there was a
significant difference between the score of the typically
developing group and each of the other two groups.
However, there was no significant difference between the
children with identified special needs and those needing
further assessment (see Table 2). As test showed that
equality of variance could not be assumed, Tamhane was
used to examine the mean difference. Residuals were tested
and shown to be normally distributed.
Impairment (specific problems)
One quarter (25%) of all children with identified special
needs had a physical impairment. Almost half (45%) had
a speech impairment, 39% a learning disability, 28% emotional and 24% behavioural problems. Relative to children
with identified special needs, those designated as needing
further assessment were less likely to have physical disability (5%). However, 39% were deemed by the teacher to
have difficulties with speech and language, 22% learning
difficulties, 19% emotional problems and 21% behavioural
problems (Table 3).
Table 1 Demographic characteristics and mean scores on each EDI domain by special needs or needs further assessment
Number (% total population)*
% Boys
Age in years Mean (SD)
% English as a second language
Vulnerable in one or more domain
Typically developing
Special needs
Needs further assessment
898 (67)
83 (6)
132 (10)
53
68
66
5.39 (.40)
5.55 (.52)
5.37 (.43)
11
17
15
17%
78%
69%
Domain scores
Mean (SD)
Mean (SD)
Mean (SD)
Physical well-being
8.99 (1.21)
6.48 (2.24)
7.13 (1.92)
Social competence
8.47 (1.66)
5.91 (2.18)
6.37 (2.01)
Emotional maturity
7.98 (1.44)
5.94 (1.82)
6.17 (1.81)
Language and cognitive development
8.96 (1.50)
6.54 (2.68)
7.16 (2.37)
Communication and general knowledge
7.91 (2.53)
3.82 (2.98)
4.54 (2.83)
*Data on assessment needs were not available on 231 children who did not have a Special Need.
Curtin et al. BMC Pediatrics 2014, 14:52
/>
Page 6 of 9
Mean Score
10.00
9.50
9.00
8.50
8.00
7.50
7.00
6.50
6.00
5.50
5.00
4.50
4.00
3.50
3.00
Physical Wellbeing
Social
competence
Identified Special Needs (N= 83)
Emotional
maturity
Language and Communication
cognitive skills and general
knowledge
Needs further assessment (N = 132)
Typically developing (N = 898)
Figure 2 Mean domain scores by special needs status.
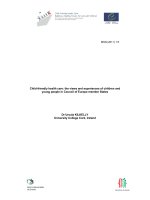
Social gradient
There was evidence of a social gradient among children
needing assessment (Figure 3). Over 15% of children
living in the most deprived area quintile were deemed by
the teacher as needing further assessment compared to
5.8% of those living in the most affluent quintile.
Services accessed
Information on services with which the children had
contact was available on a subset of 963 children on whom
parental questionnaires were returned. Of this subset, 44
(4.6%) were identified as special needs and 85 (8.8%) were
deemed to need further assessment. Children for whom
parental questionnaires were returned also had significantly
higher mean scores in all developmental domains and were
less likely to be scored as vulnerable on the EDI than those
for whom parental data were not available [16].
The majority of children who had special needs (85%)
had accessed at least one support service. However, this
was not the case for children who were identified as
needing further assessment of whom less than half (48%)
had accessed services. The services most commonly
accessed by this group were Speech and Language services
(36.6%) and Hearing Services (19%). They had very limited
Table 2 Difference in mean scores between groups
Domain
Groups compared*
Mean difference
Sig.
95% C.I.
Physical well-being
Typically developing vs needs further assessment
-1.86
.000
(-2.28 to -1.43)
Typically developing vs Special needs
-2.51
.000
(-3.13 to -1.88)
Needs further assessment vs Special needs
-.65
.101
(-1.39 to .09)
Social competence
Emotional maturity
Language and cognitive development
Communication skills and general knowledge
*One-way ANOVA.
Typically developing vs needs further assessment
-2.11
.000
(-2.55 to -1.67)
Typically developing vs Special needs
-2.57
.000
(-3.16 to -1.97)
Needs further assessment vs Special needs
-.46
.331
(-1.17 to .26)
Typically developing vs needs further assessment
-1.81
.000
(-2.2 to -1.41)
Typically developing vs Special needs
-2.04
.000
(-2.54 to -1.54)
Needs further assessment vs Special needs
-.23
.735
(- .85 to .38)
Typically developing vs needs further assessment
-1.80
.000
(-2.31 to -1.29)
Typically developing vs Special needs
-2.42
.000
(-3.15 to -1.70)
Needs further assessment vs Special needs
-.63
.228
(-1.49 to .24)
Typically developing vs needs further assessment
-3.37
.000
(-4.0 to -2.74)
Typically developing vs Special needs
-4.09
.000
(-4.92 to -3.27)
Needs further assessment vs Special needs
-.72
.218
(-1.71 to .26)
Curtin et al. BMC Pediatrics 2014, 14:52
/>
Page 7 of 9
Table 3 Type of Impairment* among children with Special Needs or Needing further assessment
Physical
disability
Visual
impairment
Hearing
impairment
Speech
impairment
Learning
disability
Emotional
problem
Behavioural
problem
%
%
%
%
%
%
%
Identified special needs
25.3
6.0
6.0
44.6
38.6
27.7
24.1
Needs further assessment
5.3
3.0
1.5
39.4
22.0
18.9
21.2
*Teachers were asked to identify if the children had an impairment which prevented them from fully participating in classroom activities.
access to services for behavioural issues (5.1%), developmental issues (5.2%) or mental health (0). Services
accessed are outlined fully in Table 4.
Discussion
This paper illustrates that children who have special
educational needs are at a greater risk of not being ready
to engage in formal education. However, the majority (80%)
do have access to support services. Of concern are the 10%
of children in the study who were deemed by their teacher
to be in need of further assessment. These children showed
an equivalent level of vulnerability across all domains of
development to the children with special needs but less
than half had accessed any services. Learning difficulties,
behavioural and emotional problems were prominent
among this group. Yet they were more likely to have
accessed hearing services than those which deal with
their identified problems.
Children with a physical impairment were more likely
to have had their special need identified. Only 5% of
those who needed further assessment had a physical
disability. Similar results from an evaluation of special
needs referral in a large Head Start programme showed
that children with emotional or behavioural problems
were less likely to be referred for assessment [28]. Failure
to support children experiencing difficulties in the early
years can lead to low self esteem and a sense of worthlessness that can have a profound effect on the mental,
social, emotional and cognitive development for the
child concerned.
18.0%
16.0%
14.0%
12.0%
10.0%
8.0%
6.0%
4.0%
2.0%
.0%
A recent report by the by the National Council for
Special Education (NCSE) in Ireland highlighted a number
of issues regarding the assessment of special educational
needs in Ireland [13]. The assessment process is a continuum from the identification of class room based
supports or in-school supports as assessed by teachers
(for children with mild challenges) to external assessment
of additional support needs where a child is experiencing
more profound difficulty. The report raised concerns
regarding the link between resource allocation and the
diagnosis of a particular category of disability. It appears
as imperative that a child has a label prior to any entitlement to additional supports. Some conditions are easier
to detect than others, for example severe autism, Down’s
syndrome, cerebral palsy and other visible conditions. It
is the so called ‘hidden disabilities’ that also need early
detection if the child is to be afforded every chance at a
productive life. Indeed the necessity of a definitively diagnosed disability prior to recognition of special needs
status is questionable [29].
In the context of truly inclusive education, a strong
focus on participation, functioning and the educational
environment as opposed to diagnosis of particular conditions would ensure that the needs of all children are
met [30,31]. The NCSE report states that while school
principals have responsibility for seeking assessments
when they consider it necessary, very often the number
of assessments available to schools is limited resulting in
long waiting lists and subsequent delays in allocating the
required resources to support the child’s learning needs.
Parents can seek private assessments but these are expensive and therefore not assessable to children in families
Table 4 Services accessed (based on parental reports)
Special needs
Needs further
(N = 44)*
assessment (N = 85)*
15.3%
10.9%
7.9%
7.7%
most
deprived
%
%
65.9
36.6
Blind or low vision services
9.8
2.5
Occupational or physical therapy
61.0
5.1
Hearing services
29.3
19.0
Services for behavioural issues
27.5
5.1
Services for developmental issues
37.5
5.2
Mental health programmes
5.1
0
Speech and language services
Q2
5.8%
Q3
Q4
least deprived
needs further assessment
Figure 3 Percentage of children requiring further assessment by
deprivation quintile.
*Parental data was available only on a sub-set of 963 children.
Curtin et al. BMC Pediatrics 2014, 14:52
/>
with limited financial resources. Where parents can afford
to pay for private assessment, the child will benefit from
more timely allocation of resources and support [15]. The
social gradient in the number of children identified as
requiring assessment in this study supports the assertion.
The strong link between assessment, identification of a
particular ‘condition’ and allocation of resources may not
serve the best interests of the child. The assessment should
involve the development of an individual educational plan
that builds on the child’s strengths and supports their needs
[10]. However, in the pressure to provide a diagnosis with
resultant resources, the need for a process which is inclusive of the views of teachers and parents with the objective
of developing an individually appropriate plan may be
overlooked. This study shows that teachers are well placed
to correctly identify those children requiring additional
support at a very early age.
The study demonstrates that teacher observation is an
effective means of identifying children who have a level of
impairment which prevents them from fully participating
in their educational environment. This is supported by
evidence from studies of teacher-completed rating scales
[32]. Moreover, a recent qualitative study conducted in
Ireland found that teachers felt that they could play a
more active role in the assessment process [15]. A
multi-disciplinary approach towards children with special
educational needs could integrate teacher observation
with other approaches to assessment and support a model
of education which would be inclusive of the needs of
every child.
Limitations
This study of early development outcomes was conducted
with 1344 children in 47 schools and has examined special
educational needs in the context of a typically developing
population. However, as only 132 children needed further
assessment and only 83 were identified as having special
educational needs, it was not possible to examine in depth
the underlying factors which may determine why some
children’s support needs are not identified or met. Factors
at the individual and family level that may contribute to
developmental vulnerability are not explored in this paper
but have been previously published [16].
Parents were asked to recall which of the services their
children had attended from a list provided. This may
have led to some degree of recall bias. Moreover, parents
were not asked if the child received the necessary support
from these services therefore we do not know to what
extent the needs of the children were addressed by accessing
these services.
Conclusions
A small but significant number of children have not had
their needs adequately assessed. Teacher observation is
Page 8 of 9
an effective means of identifying children with a level of
impairment which prevents them from fully participating
in their educational environment and could be integrated
into a multi-disciplinary approach to meeting the needs of
all children.
Competing interests
The authors do not have any competing interests financial or otherwise with
regard to this manuscript.
Authors’ contribution
MC conducted the data collection and analysis and drafted the manuscript.
DB conducted the data collection and assisted with drafting the manuscript.
AS contributed to overall project and study design, data analysis and edited
and approved the manuscript. IJP was responsible for the overall
conceptualisation of the project, study design and edited and approved the
manuscript. All authors read and approved the final manuscript.
Acknowledgements
We would like to acknowledge the support of Professor Magdalena Janus
and Eric Duku of the Offord Centre for Child Studies, McMaster’s University,
Hamilton, Ontario for their assistance in the study design and data analysis.
Funding for this study was provided by the Health Research Board in Ireland
under grant number PHD/2007/16 as part of the PhD Scholars Programme
in Health Service Research.
Author details
1
Department of Epidemiology and Public Health, University College Cork,
Floor 4, Western Gateway Building, Cork, Ireland. 2School of Nursing and
Human Sciences, Dublin City University, Dublin 9, Ireland.
Received: 31 July 2013 Accepted: 13 February 2014
Published: 19 February 2014
References
1. Irwin LG, Siddiqi A, Hertzman C: Early Child Development: A Powerful
Equaliser. World Health Organisation: WHO Commission on Social
Determinants of Health; 2007.
2. Hertzman C, Boyce T: In How Experience Gets Under the Skin to Create
Gradients in Developmental Health, Annual Review of Public Health, Volume
31. Palo Alto: Annual Reviews; 2010:329–347.
3. Handbook of early childhood intervention. Edited by Shonkoff JP, Meisels SJ.
Cambridge University Press; 2000.
4. Maggi S, Irwin LJ, Siddiqi A, Hertzman C: The social determinants of early
child development: an overview. J Paediatr Child Health 2010, 46:627–635.
5. Florian L, McLaughlin MJ (Eds): Disability Classification in Education: Issues
and Perspectives. California: Corwin Press; 2008.
6. WHO: International Classification of Functioning, Disability and Health - Children
and Youth Version. ICF-CY. World Health Organisation; 2007.
7. Cook BG: A comparison of teachers' attitudes toward their included
students with mild and severe disabilities. J Spec Educ 2001, 34:203–213.
8. Ainscow M: Developing inclusive education systems: what are the levers
for change? J Educ Chang 2005, 6:109–124.
9. Brookes G: Dyspraxia. London: Continuum International Publishing Group;
2005.
10. Education of Persons with Special Educaitonal Needs Act. Government of
Ireland; 2004.
11. O'Donovan M-A, Good A: Towards comparability of data: using the ICF to
map the contrasting definitions of disability in Irish surveys and census,
2000-2006. Disabil Rehabil 2010, 32:S9–S16.
12. Banks J, McCoy S: A Study on the Prevalence of Special Educational Needs.
National Council for Special Education: Economic and Social Research
Institute; 2011.
13. NCSE: Supporting students with special educational needs in schools. National
Council for Special Education; 2013.
14. Rose R, Shevlin M, Winter E, O’Raw P: Special and inclusive education in
the Republic of Ireland: reviewing the literature from 2000 to 2009.
Eur J Spec Needs Educ 2010, 25:359–373.
Curtin et al. BMC Pediatrics 2014, 14:52
/>
Page 9 of 9
15. Shevlin M, Winter E, Rose R, O'Raw P: Investigating perceptions of the
assessment process for pupils with special educational needs within an
Irish context. Irish Educ Stud 2013, 32:121–137.
16. Curtin M, Madden J, Staines A, Perry IJ: Determinants of vulnerability in
early childhood development in Ireland: a cross-sectional study. BMJ
Open 2013, 3:e002387. doi:10.1136.
17. Janus M, Brinkman S, Duku E: Validity and psychometric properties of the
early development instrument in Canada, Australia, United States, and
Jamaica. Soc Indic Res 2011, 103:283–297.
18. Brinkman S, Sayers M, Goldfeld S, Kline J: Population monitoring of
language and cognitive development in Australia: the Australian early
development index. Int J Speech Lang Pathol 2009, 11:419–430.
19. Janus M, Brinkman S, Duku E, Hertzman C, Santos R, Sayers M, Schroeder J,
Walsh C: The Early Development Instrument: A Population-based Measure for
Communities. Offord Centre for Child Studies, McMaster University; 2007.
20. Janus M: Transition to school: child, family and community level
determinants. In Transitions to Early Care and Education, Volume 4. Edited
by Laverick DM, Jalongo MR. Netherlands: Springer; 2011:177–187.
21. Williams J, Greene S, Doyle E, Harris E, Layte R, McCoy S, McCrory C, Murray
A, Nixon E, O'Dowd T, et al: Growing up in Ireland national longitudinal study
of children. The lives of 9 year olds. Government of Ireland: The Stationery
Office; 2009.
22. Morgan K, McGee H, Watson D, Perry I, Barry M, Shelley E, Harrington J,
Molcho M, Layte R, Tully N, et al: SLAN 2007: Survey of Lifestyle, Attitudes &
Nutrition in Ireland: Main Report. Government of Ireland: Department of
Health and Children; 2008.
23. Carey DJ: The Essential Guide to Special Education in Ireland. Primary ABC:
Dublin; 2005.
24. Kelly A, Teljeur C: The National Deprivation Index For Health & Health Services
Research, SAHRU Technical Report. SAHRU; 2013.
25. Janus M, Offord DR: Development and psychometric properties of the
Early Development Instrument (EDI): a measure of children's school
readiness. Can J Behav Sci Rev Canad Des Sci Du Comportement 2007,
39:1–22.
26. Brinkman S, Silburn S, Lawrence D, Goldfeld S, Sayers M, Oberklaid F:
Investigating the validity of the Australian early development index.
Early Educ Dev 2007, 18:427–451.
27. D'Angiulli A, Warburton W, Dahinten S, Hertzman C: Population-level
associations between preschool vulnerability and grade-four basic skills.
PLoS One 2009, 4:e7692.
28. Fantuzzo J, Stoltzfus J, Noone Lutz M, Hamlet H, Balraj V, Turner C, Mosca S:
An evaluation of the special needs referral process for low-income
preschool children with emotional and behavioral problems. Early Child
Res Q 1999, 14:465–482.
29. Desforges M, Lindsay G: Procedures used to Diagnose a Disability and to
Assess Special Educational Needs: An International Review. The National
Council for Special Education; 2010.
30. Almqvist L, Granlund M: Participation in school environment of children
and youth with disabilities: a person-oriented approach. Scand J Psychol
2005, 46:305–314.
31. Ainscow M, Dyson A, Goldrick S, West M: Making schools effective for all:
rethinking the task. Sch Leader Manag 2012, 32:197–213.
32. Salvesen KÅ, Undheim JO: Screening for learning disabilities with teacher
rating scales. J Learn Disabil 1994, 27:60–66.
doi:10.1186/1471-2431-14-52
Cite this article as: Curtin et al.: Are the special educational needs of
children in their first year in primary school in Ireland being identified: a
cross-sectional study. BMC Pediatrics 2014 14:52.
Submit your next manuscript to BioMed Central
and take full advantage of:
• Convenient online submission
• Thorough peer review
• No space constraints or color figure charges
• Immediate publication on acceptance
• Inclusion in PubMed, CAS, Scopus and Google Scholar
• Research which is freely available for redistribution
Submit your manuscript at
www.biomedcentral.com/submit