A new variant of radial visualization for supervised visualization of high dimensional data
Bạn đang xem bản rút gọn của tài liệu. Xem và tải ngay bản đầy đủ của tài liệu tại đây (406.5 KB, 11 trang )
Transport and Communications Science Journal, Vol. 70, Issue 3 (09/2019), 162-172
Transport and Communications Science Journal
A NEW VARIANT OF RADIAL VISUALIZATION FOR
SUPERVISED VISUALIZATION OF HIGH DIMENSIONAL DATA
Nguyen Dinh Thi1, Tran Van Long2
1
Nam Dinh University of Technology Education, Namdinh, Vietnam.
2
University of Transport and Communications, No 3 Cau Giay Street, Hanoi, Vietnam.
ARTICLE INFO
TYPE: Research Article
Received: 22/7/2019
Revised: 16/8/2019
Accepted: 16/8/2019
Published online: 15/11/2019
/>*
Corresponding author
Email: ; Tel: 0971661238
Abstract. Radial Visualization technique is a non linear dimensionality reduction method. Radial
Visualization projects multivariate data in the 2-dimensional visual space inside the unit circle. Radial
Visualization supports display both the samples and the attributes that provides useful information of
data structures. In this article, we introduced a new variant of Radial Visualization for visualizing high
dimensional data set that named Arc Radial Visualization. The new proposal that modified Radial
Visualization supported more space to display high dimensional datasets. Our method provides an
improvement in visualizing cluster structures of high dimensional data sets on the Radial
Visualization. We present our proposal method with two quality measurements and proved the
effectiveness of our approach for several real datasets.
Keywords: radial visualization, high-dimensional data, quality visualization.
© 2019 University of Transport and Communications
1. INTRODUCTION
High-dimensional data are one of the most important roles in data mining, machine
learning, biology, and other fields. Data visualization methods support the exploration of
high-dimensional data structures. Visualizing of high-dimensional data typically transforms
the data into a visual form that supports user understanding structure of data. Traditional data
visualization projects high-dimensional data to lower dimensional space that display in a
visual space. This approach generates a large of number of candidate projections for high162
Transport and Communications Science Journal, Vol. 70, Issue 3 (09/2019), 162-172
dimensional data. One of the challenging tasks is find the best projection for discovery
structure of data. An overview of visualizing high-dimensional data is provided many
visualization techniques [15].
Star Coordinates [11, 12] is a linear dimensionality reduction. Star Coordinates supports
several interactive teachniques for discovery structure of high dimensional data. Radial
Visualization (RadViz for shortly) method is one of the most common information
visualization techniques used in medical analysis [13, 4, 16]. RadViz is a powerful method
that is effective for exploring clusters in a high dimensional data. The disadvantages of
RadViz is that all high-dimensional points differ by a multiplicative constant that project into
the same location in the visual space [3, 5] and the position of the mapping points depend on
the the position of dimensional anchors. Sanchez et al. [20] introduced some comparison
between RadViz and Star Coordinates. Lehmann et al.[14] proposed an unified technique
between RadViz and Star Coordinates.
The traditional RadViz [9] and the PolyViz [10] maps high dimensional data set fall
inside the convex hall of dimensional anchors. We introduced a modified RadViz and
PolyViz, that projected high dimensional data that lie inside the unit circle. The new variant of
Radial Visualization provides more visual space for visualizing high dimensional data.
In this article, we propose a new enhanced RadViz for high dimensional data. Inspired by
PolyViz, we introduced the Arc Radial Visualization (ArcViz for shortly) for high
dimensional data visualization. Firstly, we determined the anchor dimensions in the unit circle
as the traditional RadViz. Each high dimensional data point used new anchors on the unit
circle. The anchor positions are found on each arc of the unit circle corresponding data values
in anticlockwise direction. Secondly, the position of this data point was calculated as the same
as traditional RadViz.
The remainder of this paper is organized into five sections. In Section 2, we present
previous related work with dimensionality reduction, quality measurement, and optimal for
multivariate function. The traditional of RadViz, the PolyViz, and a new variant of the
RadViz method was presented in Section 3. We presented two quality measurements for
visualization that named as the nearest centroid classification and the k nearest neighbors
classification in Section 4. In Section 5, we show the effectiveness of our proposal method
with some well-known data sets. In Section 6, we describe our study of conclusion and future
work.
2. RELATED WORK
RadViz is a non-linear dimensionality reduction method that maps data on highdimensional space to a two-dimensional visual space. RadViz is an information visualization
technique that places dimensions by dimensional anchors around the perimeter of a circle 9.
Spring constants are utilized to represent relational values among points - one end of a spring
163
Transport and Communications Science Journal, Vol. 70, Issue 3 (09/2019), 162-172
is attached to a dimensional anchor, the other is attached to a data point. The values of each
dimension are usually normalized to [0,1]. Each high dimensional data point is visualized at
the position where the sum of all spring forces equals zero. The location on the visual space
depends largely on the arrangement of attributes around the unit circle.
PolyViz [10, 8] is an extension of the RadViz with each attribute anchored as a line
instead a point. Spring constants are utilized along the line that corresponds to all the values
the attribute has. High-dimensional data point is projected as in the RadViz. PolyViz is more
informatic than RadViz by giving a view of the distribution of the data for each attribute.
GridViz [7, 6] is another extension of RadViz that places the dimensional anchors on a
rectangular grid instead of on the perimeter of a circle. The system of springs is the same as in
the Radviz, i.e., multivariate data points are positioned where the springs force is reached
equilibrium.
SpringView [1] is proposed for combining the RadViz and parallel coordinates. The two
methods able to handle multivariate data sets while exploiting their structure of datasets. The
SpringView allows for simultaneously visualizing both RadViz and parallel coordinates.
RadViz supports data manipulation directly and parallel coordinates supports seeing
distribution of data attributes.
DualRadviz [2] uses two RadViz with concentric cirlces, one for data dimensions and
another for classes of data set. The high dimensional data sets are mapped into the visual
space that combined both the data dimensions and the probability for classifier. DualRadviz
supports a contribution factor c [0,1]. If the contribution factor set value equal 0, it means
only using the probability of classifier for projections. If the contribution factor set value
equals 1, it means only using the data dimensions for mapping.
Recently, several extended of RadViz have been proposed. Concentric Radviz [17] is used
for multi-label classification. Voronoi RadViz [21, 22] maps data points based on barycentric
coordinates. Zhou et al. [24] introduced an extending dimension in RadViz. The data
dimensions are partitioned into several new dimensions based on mean shift algorithm. The
optimal of visual quality is found by dimensions ordering based on Dunn's index. Van Long
[23] introduced the inversion of RadViz for class separation.
3. ARC RADIAL VISUALIZATION-ARCVIZ
In this section, we describe more precisely the RadViz, PolyViz, and ArcViz for mapping
a high-dimensional point to two-dimensional space. Given angle of dimensional anchors are
α0, α1,…, αn-1. The dimensional anchors are placed on the unit circle at points Sj
=(cosαj,sinαj), j=0,1,…,n-1. Assuming, x = ( x0 , x1 ,..., xn −1 ) is a high-dimensional points that
belongs the unit hypercube [0,1]n. We defined the weights for each dimenional anchors as
given belows
164
Transport and Communications Science Journal, Vol. 70, Issue 3 (09/2019), 162-172
xj
w j ( x) =
, j = 0,1,..., n − 1
n −1
x
j =0
j
RadViz The RadViz mapped the high-dimensional point x into the visual space at position
p=
1
j =0
n −1
j =0
j =0
x j S j = wj ( x) S j
n −1
x
n −1
j
The projection point p falls inside the convex hull of the dimensional anchor points {S0,
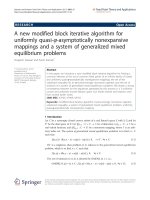
S1,…, Sn-1}. Figure 1 (left) showed the point x =(0.1,0.8,0.7,0.4) on the RadViz.
PolyViz The PolyViz determined a new dimensional anchors for the high-dimensional point
x . The new anchor point for the jth dimension is defined by
C j = x j S j + (1 − x j ) S j +1 , j = 0,1,..., n − 1
where Sn = S0. As the same RadViz, PolyViz mapped the point x into the visual space at the
location inside the convex hull of set of points {C0, C1,…, Cn-1}. The projection point p was
defined as follows:
p=
1
n −1
xj
n −1
x C
j =0
j
j
j =0
This formula can be rewritten as:
n −1
n −1
j =0
j =0
p = w ( x j ) x j S j + w j ( x )(1 − j ) S j +1
Figure 1 (middle) showed the point x =(0.1,0.8,0.7,0.4) on the PolyViz.
ArcViz The ArcViz is an extended of the PolyViz method with each of the dimension anchors
as an arc neither a point or a line. We defined a new anchor point for the jth attribute by
C j = ( cos j ,sin j ) where
j = x j j + (1 − x j ) j +1 ,
j = 0,1,..., n − 1
and n = 0 . The new dimensional anchors for the high-dimensional point x are placed on
the unit circle. The ArcViz mapped the high-dimensional data point x into the visual space,
as follows:
n −1
p = wj ( x ) C j
j =1
165
Transport and Communications Science Journal, Vol. 70, Issue 3 (09/2019), 162-172
Figure 1 (right) showed the point x =(0.1,0.8,0.7,0.4) on the ArcViz.
Figure 1. Visualization of a four dimensional point.
4. QUALITY VISUALIZATION MEASUREMENTS
Suppose data set X = xi :1 i N was classified into K classes and each class labelled
by C = {1, 2,…, K}. We denote nk is the number of data point in the kth class. In this section,
we presented some methods to measure quality metric on the visual space for visualizing
supervised data. Without loss of general, we also denoted data set that was projected in the
visual space by Y = yi :1 i N ¡ 2 , where yi = P ( xi ) , i = 1, 2,..., N.
4.1. The Nearest Centroid Classification
For each class, we denote mk as the centroid of the kth class. A data point y belongs to a
particular class if the distance from the data point y to the centroid of this class is smallest.
Hence, we denote
c ( y ) = arg min1 k K y − mk
A data point y was correctly represented if its label was the same as its class, otherwise
the data point y missed. The quality of visualization of given dataset X = xi :1 i n was
defined as the number of correctly represented data points, i.e.,
Q ( X , P) =
xi : label ( xi ) = c ( yi )
n
,
where label ( xi ) is the label of the observation xi .
4.2. The k nearest neighbors classification
The k nearest neighbors (kNN) is a non-parametric method used for classification. A data
point was classified by a majority vote of its neighbors, with the object being assigned to the
class most common among its k nearest neighbors. In this paper, we selected the parameter
k=5 for all experiments. For each data point y in the visual space, we computed k nearest
neighbors (except y ). The measurement of the quality visualization was defined as number of
data points, that is corrected classifier.
166
Transport and Communications Science Journal, Vol. 70, Issue 3 (09/2019), 162-172
4.3. Optimize Visualization
We apply the differential evolution (DE) algorithm to find an approach optimal position
of dimensional anchors [19]. One of the most advantages can enable handling nondifferentiable, discontinuous, non-linear, and multimodel for objective function with
constraints and non-constraints. The objective function for quality measurement is suitable
using the DE algorithm.
The DE algorithm is a stochastic algorithm that explores candidate solutions (population).
The DE algorithm creates uniform random initializes the population in the search space.
Candidate solution evolve over each successive steps to find locate of maxima in the search
space of the objective function. At each generation, a new candidate solution is generated
based on two basic operations that is called as mutation and crossover. The best solution of
the objective at each generation was derived the selection operator.
We implemented the DE algorithm [18] with DE/rand/1/exp strategy, and parameters
NP=75, CR = 0.8803, F = 0.4717, and the maximum number of generation MaxGen=50.
5. RESULTS
5.1. Data sets
We prove the efficiency of our method for six data sets. The data sets are given in Table 1.
The first data set was a synthetic data that named as Y14c. The Y14c contains 480
observations with 10 attributes and classified into 14 groups. The last five data sets were well
known data set in UCI1 that called as Iris, Wine, Olive, Ecoli, and Auto-mpg, respectively.
Table 1. Description of Data Sets.
Data sets
Number of
Instrances
Number of
Attributes
Number of
Classes
Y14c
480
10
14
Iris
150
4
3
Wine
178
13
3
Olive
572
8
9
Ecoli
336
8
8
Auto-mpg
398
8
3
5.2 Nearest centroid classification
Table 2 showed the quality of visualization for six supervised data sets. This result
proved that the new ArcViz had surpassed quality visualization more than RadViz and
PolyViz.
1
/>167
Transport and Communications Science Journal, Vol. 70, Issue 3 (09/2019), 162-172
Table 2. Quality measurements of RadViz, PolyViz and ArcViz based on the nearest centroid
classification.
Data sets
Y14c
Iris
Wine
Olive
Ecoli
Auto-mpg
RadViz
93.75%
85.33%
96.08%
87.76%
74.70%
76.02%
PolyViz
93.13%
94.67%
95.51%
86.01%
69.94%
70.92%
ArcViz
100%
98.00%
94.94%
91.01%
77.98%
74.23%
Figure 2. Visualization of Y14c data set-Nearest centroid classification.
Figure 3. Visualization of Iris data set- Nearest centroid classification.
Figure 4. Visualization of Wine data set-Nearest centroid classification.
Figure 2 showed the optimal for nearest centroid classification of RadViz, PolyViz, and
ArcViz for the Y14c data set. Classes were encoded by different colors. Figure 2 (left)
showed all classes of data sets perfectly separated.
168
Transport and Communications Science Journal, Vol. 70, Issue 3 (09/2019), 162-172
The Iris data set was visualized on RadViz, PolyViz, and ArcViz in Figure 3. The
different colors represented different groups of the Iris data set. Two classes Versicolor and
Virginica were overlapped in the RadViz, and PolyViz visualization and separated with
another class Setosa. In Figure 3 (left), the ArcViz display the Iris data set were perfectly
separated into three classes.
The third data set was named the Wine data set. The Wine data set contained 178
instances with 13 attributes. The Wine data set if partitioned into three classes. Each class was
presented by different color. Figure 4 showed the class visualization using RadViz, PolyViz,
and ArcViz respectively. Figure 4 (right) showed the highest quality for class separation.
5.3. K nearest neighbors classification
Table 3 showed results of K nearest neighbors (KNN) classifier. The quality visualization
measurements of six data sets for the RadViz, PolyViz, and ArcViz archived the highest score
with Y14c, Iris, Olive, and Ecoli with the ArcViz method and the RadViz also archived
highest score with two remaining data sets Wine and Auto-mpg.
Table 3. Quality measurements of RadViz, PolyViz, and ArcViz based on K nearest neighbors
classification.
Data sets
Y14c
Iris
Wine
Olive
Ecoli
Auto-mpg
RadViz
96.88%
89.33%
96.07%
89.69%
80.36%
80.61%
PolyViz
95.21%
97.33%
94.94%
87.06%
81.84%
78.06%
ArcViz
99.38%
98.00%
89.89%
85.66%
82.74%
77.55%
Figure 5 showed the Radviz, PolyViz, and ArcViz visualizing the Y14c data sets
respectively based on the k nearest neighbors classification of quality visualization
measurements. Figure 6 visualized the Iris data set on the RadViz, PolyViz, and ArcViz,
respecttively. Figure 7 display the Wine data sets on the RadViz, PolyViz, and ArcViz,
respectively.
Figure 5. Visualization of Y14c data set - The k nearest neighbors classification.
169
Transport and Communications Science Journal, Vol. 70, Issue 3 (09/2019), 162-172
Figure 6. Visualization of Iris data set - The k nearest neighbors classification.
Figure 7. Visualization of Wine data set - The k nearest neighbors classification.
6. CONCLUSION AND FUTURE WORK
We presented a new method for visualizing high-dimensional data based on force-based
technique. Our proposed method ArcViz supported users choosing a suitable view for highdimensional datasets. We proved the effectiveness of our method versus Radviz, PolyViz for
several supervised data sets. For future work, we want to improve our methodology to
enhance class structures in subspaces with supervised datasets. Moreover, we want to develop
other quality visualization measurements for supervised datasets and integrate interactive
techniques to moving the arc on the unit circle.
REFERENCES
[1] E. Bertini, L.D. Aquila, G. Santucci, Springview, Cooperation of radviz and parallel coordinates
for view optimization and clutter reduction, In Proceedings Third International Conference on
Coordinated and Multiple Views in Exploratory Visualization, London, England, UK, 2005, 22–29.
[2] I. B. Correa, A. de Carvalho, Dual-radviz, Preserving context between classification evaluation and
data exploration with radviz, In Proceedings 5th Brazilian Conference on Intelligent Systems, Recife,
Brazil, 2016, 241–246. DOI: 10.1109/BRACIS.2016.052
[3] K. Daniels, G. Grinstein, A. Russell, M. Glidden, Properties of normalized radial visualizations,
Information Visualization, 11 (2012) 273–300.
[4] J. Demsar, G. Leban, B. Zupan, Freeviz, An intelligent multivariate visualization approach to
170
Transport and Communications Science Journal, Vol. 70, Issue 3 (09/2019), 162-172
explorative analysis of biomedical data, Journal of Biomedical Informatics, 40 (2007) 661–671.
[5] L. di Caro, V. Frias-Martinez, E. Frias-Martinez, Analyzing the role of dimension arrangement for
data visualization in radviz, In Pacific-Asia Conference on Knowledge Discovery and Data Mining,
Advances in Knowledge Discovery and Data Mining, Hyderabat, India, 2010, 125–132.
[6] G. Dzemyda, O. Kurasova, J. Zilinskas, Multidimensional Data Visualization: Methods and
Applications, Springer Publishing Company, Incorporated, 2012.
[7] U. Fayyad, G. Grinstein, A. Wierse, Information Visualization in Data Mining and Knowledge
Discovery, Morgan Kaufmann Publishers Inc., San Francisco, CA, USA, 2002.
[8] G. Grinstein, M. Trutschl, U. Cvek, High-dimensional visualizations, In Proceedings of the Visual
Data Mining KDD Workshop 2001, 2 (2001) 7–19.
[9] P. Hoffman, G. Grinstein, K. Marx, I. Grosse, E. Stanley, DNA visual and analytic data mining, In
Proceedings of the 8th conference on Visualization’97, pp. 437–441. IEEE Computer Society Press,
1997.
[10] P. Hoffman, G. Grinstein, D. Pinkney, Dimensional anchors: a graphic primitive for
multidimensional multivariate information visualizations, In Proceedings of the 1999 workshop on
new
paradigms
in
information
visualization
and
manipulation,
9–16,
1999.
/>[11] E. Kandogan, Star coordinates, A multidimensional visualization technique with uniform
treatment of dimensions, In Proceedings of the IEEE Information Visualization Symposium, Hot
Topics, 4–8, 2000.
[12] E. Kandogan. Visualizing multi-dimensional clusters, trends, and outliers using star coordinates,
In Proceedings of the Seventh ACM SIGKDD International Conference on Knowledge Discovery and
Data Mining, 107–116, 2001.
[13] G. Leban, B. Zupan, G. Vidmar, I. Bratko, VizRank, Data visualization guided by machine
learning, Data Mining and Knowledge Discovery, 13 (2006) 119–136. />[14] D.J. Lehmann, H. Theisel, General projective maps for multidimensional data projection,
Computer Graphics Forum, 35 (2016) 443–453. />[15] S. Liu, D. Maljovec, B. Wang, P.T. Bremer, V. Pascucci, Visualizing highdimensional data:
Advances in the past decade, IEEE Transactions on Visualization and Computer Graphics, 23 (2017)
1249–1268. />[16] J.F. Mccarthy, K.A. Marx, P. Hoffman, A.G. Gee, P. O’neil, M.L. Ujwal, J. Hotchkiss,
Applications of machine learning and high-dimensional visualization in cancer detection, diagnosis
and management, Annals of the New York Academy of Sciences, 1020 (2004) 239–262.
[17] J.H. Ono, F. Sikansi, D.C. Corrêa, F.V. Paulovich, A. Paiva, L. G. Nonato, Concentric radviz:
visual exploration of multi-task classification, In Conference on Graphics, Patterns and Images, 165–
172, 2015
[18] M. Erik, H. Pedersen, Good parameters for differential evolution, Technical Report HL1002,
Hvass Laboratories, 2010.
[19] K. Price, R.M. Storn, J.A. Lampinen, Differential Evolution: A Practical Approach to Global
Optimization (Natural Computing Series), Springer-Verlag New York, Inc., 2005.
[20] M.R. Sanchez, L. Raya, F. Diaz, A. Sanchez, A comparative study between radviz and star
171
Transport and Communications Science Journal, Vol. 70, Issue 3 (09/2019), 162-172
coordinates, IEEE transactions on visualization and computer graphics, 22 (2016) 619–628.
/>[21] A. Russell, K. Daniels, G. Grinstein, Voronoi diagram based dimensional anchor assessment for
radial visualizations, In 16th International Conference on Information Visualisation, Vienna, Austria
229–233, 2012.
[22] A. Russell, R. Marceau, F. Kamayou, K. Daniels, G. Grinstein, Clustered data separation via
barycentric radial visualization, In Proceedings of the 2014 International Conference on Modeling,
Simulation and Visualization Methods (MSV), Las Vegas, USA, 101-107, 2014.
[23] V.L. Tran, Another look at radial visualization for class-preserving multivariate data
visualization, Informatica (Slovenia), 41 (2017) 159–168.
[24] F. Zhou, W. Huang, J. Li, Y. Huang, Y. Shi, Y. Zhao, Extending dimensions in radviz based on
mean shift, In IEEE Pacific Visualization Symposium (PacificVis), Hangzhou, China, 111–115, 2015.
/>
172