Perspectives on social LCA contributions from the 6th international conference
Bạn đang xem bản rút gọn của tài liệu. Xem và tải ngay bản đầy đủ của tài liệu tại đây (3.16 MB, 133 trang )
SPRINGER BRIEFS IN ENVIRONMENTAL SCIENCE
Marzia Traverso
Luigia Petti
Alessandra Zamagni
Perspectives on
Social LCA
Contributions
from the 6th
International
Conference
SpringerBriefs in Environmental Science
SpringerBriefs in Environmental Science present concise summaries of cutting-edge
research and practical applications across a wide spectrum of environmental fields,
with fast turnaround time to publication. Featuring compact volumes of 50 to 125
pages, the series covers a range of content from professional to academic. Monographs of new material are considered for the SpringerBriefs in Environmental
Science series.
Typical topics might include: a timely report of state-of-the-art analytical techniques, a bridge between new research results, as published in journal articles and a
contextual literature review, a snapshot of a hot or emerging topic, an in-depth case
study or technical example, a presentation of core concepts that students must
understand in order to make independent contributions, best practices or protocols
to be followed, a series of short case studies/debates highlighting a specific angle.
SpringerBriefs in Environmental Science allow authors to present their ideas and
readers to absorb them with minimal time investment. Both solicited and unsolicited
manuscripts are considered for publication.
More information about this series at />
Marzia Traverso • Luigia Petti
Alessandra Zamagni
Editors
Perspectives on Social LCA
Contributions from the 6th International
Conference
Editors
Marzia Traverso
Institute for Sustainability in Civil
Engineering
RWTH Aachen University
Aachen, Germany
Luigia Petti
Dipartimento di Economia
University of Chieti-Pescara
Pescara, Italy
Alessandra Zamagni
Ecoinnovazione srl
Spin-off ENEA
Bologna, Italy
ISSN 2191-5547
ISSN 2191-5555 (electronic)
SpringerBriefs in Environmental Science
ISBN 978-3-030-06564-5
ISBN 978-3-030-01508-4 (eBook)
/>Library of Congress Control Number: 2019933900
© The Author(s), under exclusive license to Springer Nature Switzerland AG 2020
This work is subject to copyright. All rights are reserved by the Publisher, whether the whole or part of the
material is concerned, specifically the rights of translation, reprinting, reuse of illustrations, recitation,
broadcasting, reproduction on microfilms or in any other physical way, and transmission or information
storage and retrieval, electronic adaptation, computer software, or by similar or dissimilar methodology
now known or hereafter developed.
The use of general descriptive names, registered names, trademarks, service marks, etc. in this publication
does not imply, even in the absence of a specific statement, that such names are exempt from the relevant
protective laws and regulations and therefore free for general use.
The publisher, the authors, and the editors are safe to assume that the advice and information in this
book are believed to be true and accurate at the date of publication. Neither the publisher nor the authors or
the editors give a warranty, express or implied, with respect to the material contained herein or for any
errors or omissions that may have been made. The publisher remains neutral with regard to jurisdictional
claims in published maps and institutional affiliations.
This Springer imprint is published by the registered company Springer Nature Switzerland AG.
The registered company address is: Gewerbestrasse 11, 6330 Cham, Switzerland
Preface
The Social Life Cycle Assessment (S-LCA) is officially recognised to be part of Life
Cycle Thinking (LCT), and since May 2018, it is again a topic under the umbrella of
the UN Environment Life Cycle Initiative activities. In fact, the current guidelines,
published by UNEP Life Cycle Initiative in 2009, are under revision, in the framework of a project sponsored by the Life Cycle Initiative, and their launch with
relative pilot projects, is expected at LCM2019 Conference in September 2019. In
the last 10 years, several S-LCA developments and implementations have been
carried out, increasing the importance of the S-LCA in both private and public
sectors. Given the economic crisis, attention has been brought on the social component of the sustainability both in Europe and in the developed countries more in
general, highlighting that the management of the social issues is not only a need but
also an opportunity, because it further qualifies the product/service on the market. In
addition, it is an opportunity to reward those organisations that are already creating
social value through the reinvestment of their profits into cultural and social initiatives for the community. In other words, organisations can be the leverage for social
value creation, and their competitiveness can benefit from it. For this reason, the
interest of the policy-makers has increased in order to identify the positive and
negative social hotspots generated by a product or a company in different local
contests.
The S-LCA conferences have today reached the sixth version and it is today an
international event that allows experts and non-experts from the academy, industry
and policy to meet and exchange on this topic and to discuss its challenges. Several
improvements and more interest from stakeholders outside the scientific community
have been registered since the first seminar held in Lyngby at the Technical
University of Denmark on 31 May 2010, promoted by Dr. Louise Camilla Dreyer.
The aim of the sixth International Conference on S-LCA People&Places4Partnership
is to discuss about the key role of S-LCA as a decision-making tool in the definition
of strategies for social sustainability, thus supporting both public and private businesses in making more informed decisions. In this conference, three sessions have
been organised: scientific presentations, industry sessions and a policy workshop to
v
vi
Preface
underline the necessity to discuss the potentials, challenges and gaps of S-LCA at
different levels. The conference has registered more than 130 participants and more
than 60 contributions, whose abstracts are reported in the conference proceedings. A
limited number of full papers have been selected to be published in this book to
represent the state of the art and some of the current initiatives and implementations
of S-LCA. The book starts with few examples on further developments of the S-LCA
phases, in particular: the definition of the functional unit, in the framework of the
goal and scope phase (Arzoumanidis et al. 2018), and the definition and development of impact pathway and weighting approaches in the impact assessment phase
(Weidema 2018, Di Cesare et al. 2018, Benoit-Norris et al. 2018 and Breno et al.
2018). Then, some examples of alternative approaches are presented, developed in
the industrial context to measure the social impact (Baumann et al. 2018, Saling et al.
2018, and Vuaillat et al. 2018). Finally, three contributions are focusing on practical
implementations of S-LCA to different activity sectors: waste management (IbañezForés et al. 2018), automotive components (Zanchi et al. 2018) and agriculture
system (Frank 2018).
Aachen, Germany
Bologna, Italy
Pescara, Italy
M. Traverso
A. Zamagni
L. Petti
Contents
1
Functional Unit Definition Criteria in Life Cycle Assessment
and Social Life Cycle Assessment: A Discussion . . . . . . . . . . . . . . .
Ioannis Arzoumanidis, Manuela D’Eusanio, Andrea Raggi,
and Luigia Petti
2
Towards a Taxonomy for Social Impact Pathway Indicators . . . . .
Bo P. Weidema
3
A New Scheme for the Evaluation of Socio-Economic Performance
of Organizations: A Well-Being Indicator Approach . . . . . . . . . . . .
Silvia Di Cesare, Alfredo Cartone, and Luigia Petti
4
Structure of a Net Positive Analysis for Supply Chain
Social Impacts . . . . . . . . . . . . . . . . . . . . . . . . . . . . . . . . . . . . . . . . .
Catherine Benoit Norris, Gregory A. Norris, Lina Azuero,
and John Pflueger
5
Weighting and Scoring in Social Life Cycle Assessment . . . . . . . . .
Breno Barros Telles do Carmo, Sara Russo Garrido, Gabriella Arcese,
and Maria Claudia Lucchetti
6
Beyond a Corporate Social Responsibility Context Towards
Methodological Pluralism in Social Life Cycle Assessment:
Exploring Alternative Social Theoretical Perspectives . . . . . . . . . . .
Henrikke Baumann and Rickard Arvidsson
7
8
1
11
25
35
45
53
Sustainable Guar Initiative, Social Impact Characterization
of an Integrated Sustainable Project . . . . . . . . . . . . . . . . . . . . . . . .
Marie Vuaillat, Alain Wathelet, and Paul Arsac
65
Generation, Calculation and Interpretation of Social Impacts
with the Social Analysis of SEEbalance® . . . . . . . . . . . . . . . . . . . . .
Peter Saling, Ana Alba Perez, Peter Kölsch, and Thomas Grünenwald
75
vii
viii
9
Contents
Proposal of Social Indicators to Assess the Social Performance
of Waste Management Systems in Developing Countries:
A Brazilian Case Study . . . . . . . . . . . . . . . . . . . . . . . . . . . . . . . . . .
Valeria Ibañez-Forés, María D. Bovea,
and Claudia Coutinho-Nóbrega
95
10
Social Assessment in the Design Phase of Automotive Component
Using the Product Social Impact Assessment Method . . . . . . . . . . . 105
Laura Zanchi, Alessandra Zamagni, Silvia Maltese,
Rubina Riccomagno, and Massimo Delogu
11
Social Life Cycle Assessment in Agricultural Systems – U.S. Corn
Production as a Case Study . . . . . . . . . . . . . . . . . . . . . . . . . . . . . . . 119
Markus Frank, Thomas Laginess, and Jan Schöneboom
Chapter 1
Functional Unit Definition Criteria in Life
Cycle Assessment and Social Life Cycle
Assessment: A Discussion
Ioannis Arzoumanidis, Manuela D’Eusanio, Andrea Raggi, and Luigia Petti
Abstract The definition of a Functional Unit (FU) is essential for building and
modelling a product system in Life Cycle Assessment (LCA). A FU is a quantified
description of the function of a product that serves as the reference basis for all
calculations regarding impact assessment. A function may be based on different
features of the product under study, such as performance, aesthetics, technical
quality, additional services, costs, etc. Whilst the FU definition is typical in LCA,
this does not seem to be a common practice in Social Life Cycle Assessment
(S-LCA), even though a FU definition is required. Unlike LCA, where quantitative
data are mainly collected and processed, the assessment of the social and socioeconomic impacts in S-LCA is based on a prevalence of qualitative and semiquantitative data, a fact that renders the assessment to be somehow unfriendly.
Moreover, whilst in LCA a product-oriented approach is typical, S-LCA tends to
be a business-oriented methodology, where the emphasis of the social assessment
lies on the behaviour of the organisations that are involved in the processes under
study rather than on the function that is generated by a product. Indeed, several SLCA case studies were found in the literature in which the FU is not discussed, let
alone defined. The objective of this article is to contribute to analysing the criteria
used for the definition of a FU in LCA and verifying whether these criteria can be
suitable for S-LCA case studies applications. For this reason, a literature review was
carried out on LCA in order to identify whether and how this issue has been tackled
with so far. In addition, a second literature review was performed in order to verify
how the FU has been introduced in the framework of the S-LCA methodology.
Finally, an investigation of the analysis results, in terms of the selected FU, is
proposed in view of an ever-growing need for a combination of the LCA and SLCA methodologies into a broader Life Cycle Sustainability Assessment (LCSA).
I. Arzoumanidis (*) · M. D’Eusanio · A. Raggi · L. Petti
Department of Economic Studies (DEc), University “G. d’Annunzio”, Pescara, Italy
e-mail:
© The Author(s) 2020
M. Traverso et al., Perspectives on Social LCA, SpringerBriefs in Environmental
Science, />
1
2
1.1
I. Arzoumanidis et al.
Introduction
With the definition of Sustainable Development at the Conference of Rio in 1992,
sustainability has become an inseparable part of the core decision-making processes
and a strategic objective for business and governance. A product may be considered
to be sustainable if there is an equilibrium between the three dimensions: economic,
environmental and social [1, 2]. In order for the sustainability of a product, an
organisation or a process to be assessed, Life Cycle Thinking (LCT) methods and
tools can be implemented. Amongst these, LCA focuses on the environmental
issues, whilst S-LCA analyses the social ones. Both methodologies draw from the
ISO 14040:2006 framework [3], but have different application characteristics [4].
Indeed, whilst LCA is based on the physical flows of a product system [3], S-LCA
considers the behaviour of the companies involved in the related processes [5].
Moreover, the nature of the assessed impacts and the presence of both qualitative and
semi-qualitative data in S-LCA, render the assessment to be strongly context-related
[6]. On the other hand, LCA uses quantitative product-related data [3]. As already
known, the framework of the two methodologies consists in the following phases:
(1) Goal and Scope Definition (GSD); (2) Life Cycle Inventory (LCI); (3) Life Cycle
Impact Assessment (LCIA); (4) Interpretation [3, 7].
This article focuses on the first phase of the LCT methodologies (GSD) and
specifically on the FU definition. ISO 14040:2006 defines FU as the “quantified
performance of a product system for use as a reference unit” [3; p. 4]. This definition
is also adopted by the S-LCA methodology [7], the guidelines of which explicitly refer
to the ISO 14040:2006 standard. The FU describes and quantifies the features of a
product (functionality, aspect, stability, durability, ease of maintenance, etc.), which
are market-driven [8]. The objective of this study is to analyse the FU definition and
identification in LCA and S-LCA, in order to highlight differences and similarities and
to ascertain whether it is reasonable and possible to extend the typical LCA FU
definition criteria to the social evaluation of a product. For this purpose, the scientific
literature for both methodologies to identify the criteria for defining FU was analysed.
Since the two methodologies present a different development level, the two literature
reviews were performed using partially dissimilar approaches, as described in Sects.
1.3–1.4. This article is structured as follows: Sects. 1.2–1.4 describe the literature
review methodologies and Sect. 1.5 the results for LCA and S-LCA. In Sect. 1.6, the
elements of similarity and differentiation between LCA and S-LCA regarding the FU
identification are discussed, and in Sect. 1.7, some conclusions are drawn.
1.2
Methodology
Given that the two analysed methodologies present a different level of development,
the two literature reviews were performed using partially dissimilar approaches. The
relevant search strategies will be described in Sects. 1.3 and 1.4; however, both
searches were carried out using the same research engine (EBSCO Discovery
Service available at the Univ. “G. d’Annunzio” Library‘s website) [9] and without
1 Functional Unit Definition Criteria in Life Cycle Assessment and. . .
3
imposing any initial time limit (the end of the time interval was set at the end of
October 2017). The review was performed by searching for words such as “functional unit”, “function*”, “reference flow”, “reference” and “flow” within the identified articles. Finally, in order to render the two analyses more homogeneous, the
same sectorial categorisation was used, i.e., based on the NACE (Nomenclature
statistique des Activités économiques dans la Communauté Européenne) codes [10].
1.3
Literature Review on LCA
LCA evaluates the environmental impacts throughout the entire life cycle of a
product and is an ever more applied methodology for improving the environmental
performance of products and services [11]. Given the great number of published case
studies, concerning different sectors, the literature review was limited to considering
only case studies and methodological reviews. The search used the terms (“LCA”
OR “Life Cycle Assessment”) AND “review” in the field of the title (of the articles).
In this way, all possible sectors of products and services were considered. 326 results
initially emerged; these were subsequently restricted by means of a screening
procedure to 111 review articles for various sectors (excluding those papers related
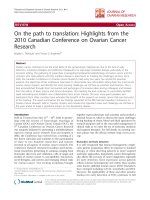
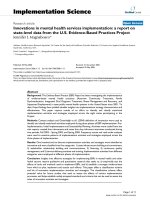
to phases other than GSD). Fig. 1.1 presents the distribution of the publications per
sector, whilst Fig. 1.2 the temporal one.
35
LCA
30
25
20
15
10
5
A1
A3
A(only)
B7
C10
C11
C14
C16
C17
C19
C20
C22
C23
C24
C26
C27
C28
C29
C31
C32
C(only)
D35
E36
E38
E39
E41
E42
F43
F(only)
H49
I55
J61
J63
J(only)
P85
N/A
0
Fig. 1.1 LCA – Distribution of the reviewed publications per sector (NACE code)
4
I. Arzoumanidis et al.
18
16
14
12
10
8
6
4
2
2017
2016
2015
2014
2013
2012
2011
2010
2009
2008
2007
2006
2005
2004
2003
2002
2001
2000
1999
1998
1997
1996
1995
0
Fig. 1.2 LCA – Temporal distribution of the reviewed publications
1.4
Literature Review on S-LCA
The S-LCA literature research was conducted using the terms “Social Life Cycle
Assessment”, “Social LCA”, “S-LCA” and “S-LCA” and the OR operator, resulting
in 7129 articles. Given the high number of results, a filter was applied in the
“subject” field, thus considering only the articles that dealt with “Social Life Cycle
Assessment”, “S-LCA” and “social impacts”, thus arriving at 133 results. Subsequently, the articles were divided into three macro-areas: methodological, reviews
and case studies. The literature review showed that the publications distribution by
type is made up of 52.63% of case-studies, followed by methodological articles
(34.59%) and reviews (12.78%). Here, only S-LCA case studies were considered in
order to identify the FU selection criteria. The first S-LCA studies emerged in 2006
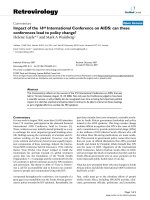
(Fig. 1.4). The frequency of the case studies per year shows that since 2009 there has
been an increase in S-LCA articles, probably following the publication of the
Guidelines [7]. Figure 1.3 presents the distribution of the publications per sector,
whilst Fig. 1.4 the temporal one.
1.5
Results
The results of the findings are presented hereafter, whilst a detailed description of the
FU quantities used in the various sectors, along with their frequency of presence, is
presented in Table 1.1. Please note that in order to categorise the identified sectors,
these were brought to the first level of detail of the NACE codes (e.g., C10.1.5 was
1 Functional Unit Definition Criteria in Life Cycle Assessment and. . .
5
Fig. 1.3 S-LCA – Distribution of the reviewed publications per sector (NACE codes)
Case Studies
20
18
16
14
12
10
8
6
4
2
0
2006
2007
2008
2009
2010
2011
2012
2013
2014
Fig. 1.4 S-LCA- Temporal distribution of the reviewed publications
2015
2016
2017
6
I. Arzoumanidis et al.
Table 1.1 Summary of the review results (the number of publications found for that quantity, if
more than one, is in parenthesis)
Sectors
Agriculture, forestry
and fishing
Mining and quarrying
Manufacturing
NACE
code
A1
A3
A
(only)
B7
C10
No. of
identified
articles
SLCA LCA
3
8
2
1
1
9
C16
C17
C19
C20
C22
C23
2
1
5
1
1
1
3
C24
C26
1
1
C27
C28
2
Mass; N/A
N/A
Volume (3); mass (2); distance
(2); product unit (2); N/A
N/A
N/A
1
S-LCA
N/A (3);
mass (3);
product
unit, area
Mass (4);
N/A
Volume
N/A (2);
economic
value
Product unit
Person time
N/A
Mass (3)
Product unit
(2); N/A (2)
N/A
N/A; product unit; area; distance, volume
3
C32
D35
4
N/A
Mass (7); volume (6); nutritional value (3); area (3); economic value (2); energy; profit;
N/A (2)
1
C29
Electricity, gas, steam
and air conditioning
supply
5
1
3
C
(only)
LCA
Mass (3); area (3); energy (2);
product unit; economic value;
volume
Mass (2); calorific value
N/A
C11
C14
C31
FU quantity
2
Product unit
2
7
1
31
9
N/A (3); mass (3); product unit
(2); volume; energy; environmental impact
Energy (20); mass (17); area
(10); distance (8); N/A (8);
volume (6); product unit (3);
environmental impact (2); time
(2); service; yield; calorific
value
Product unit
(2); N/A
N/A; product unit
Product unit
(2)
Product unit
N/A (3);
mass (3);
volume;
distance;
area
(continued)
1 Functional Unit Definition Criteria in Life Cycle Assessment and. . .
7
Table 1.1 (continued)
Sectors
Water supply; sewerage; waste management and remediation
activities
Construction
Transporting and
storage
Accommodation and
food service activities
Information and
communication
Education
Not available/not
identifiable
NACE
code
E36
E38
No. of
identified
articles
SLCA LCA
3
1
10
6
E39
F41
1
15
F42
F43
F
(only)
H49
1
LCA
Volume (3)
Mass (4); N/A (3); volume (3);
volume (3); environmental
impact (2); quantity; quality
Mass; volume
Area (12); product unit (7);
mass (4); energy (4); volume
(3); time (2); value (2); insulating value (2); N/A (2);
environmental impact
N/A
2
2
I55
J61
J63
J
(only)
P85
N/A
1
3
FU quantity
Area (2)
Mass; N/A
1
Mass
1
Time
1
N/A
1
2
9
S-LCA
Mass
Mass (4);
N/A; person
time
Mass
Product
unit; N/A;
mass
Person time
Product unit; N/A
1
3
N/A (6); mass (3); energy;
volume
N/A
N/A (3)
brought to C10), whilst the zero-level codes -- e.g., A (only) -- refer to sectors for
which the first level of detail was not available within the reviewed articles.
1.5.1
LCA
As expected, the literature review showed an increase in published reviews in recent
years [12]. The most cited sector in the analysed reviews is the energy-related one
(sector D35), followed by the construction of buildings (sector F41). Some of the
analysed reviews provided details for the different identified FUs (Table 1.1). In 76
out of 111 review articles (68.47%) the FU is discussed and defined in different ways
(e.g., for the manufacturing of food products (sector C10), the FU is identified in
terms of mass, product unit, energy, area, volume, nutritional or economic value,
8
I. Arzoumanidis et al.
etc.), whilst for the remaining 31.53% no FU definition was given (e.g., for sector
C10, the FU was not examined at all in two reviews). Moreover, a detailed description of the FU was provided only in 59.46% of the articles examined (even if, not
always in an adequate way), whilst an attempt to give a description of the function of
the product was provided in even fewer cases (10.81% of the articles). Furthermore,
Table 1.1 shows the prevailing FU quantities for each sector. Regarding the energyrelated sector (D35), the most commonly used quantity to define the FU is obviously
energy, followed by mass (e.g., of a specific fuel). In general, the most used quantity
is mass, followed by energy, volume and area (Table 1.1). Finally, whilst for some
sectors, specific FUs are found (e.g., the economic value for the manufacturing of
food products and insulating value for the buildings sector), it is noted that most of
the defined FUs (e.g., mass, volume and energy) are common for several sectors.
1.5.2
S-LCA
FU identification is considered to construct and model the product-system and thus
identify the context and the stakeholders involved in the study itself [7]. Since SLCA evaluates the social aspects of the products, it uses mainly qualitative data and
indicators, which, in the LCIA phase, do not allow an immediate link of the results to
the FU (ibid.).The most cited sector in the S-LCA analysed articles is the energyrelated one (sector D35), followed by agriculture (A1). The analysed papers provided details for the different identified FUs (Table 1.1). The review showed a nonnegligible presence of case studies where a FU was not identified, let alone discussed
(24.72%), whilst for the remaining (75.28%) the FU was taken into consideration. In
the papers where the FU is discussed, the most common FU refers to mass (23
papers), followed by the product unit (9 papers) (Table 1.1). The choice of both mass
and product unit as a quantity is found in different sectors (e.g., agriculture,
manufacturing). On the other hand, mass was selected for the energy, waste management and transport sectors, whilst product unit was selected for the construction
sector. Moreover, Table 1.1 shows that the most commonly analysed sector is
manufacturing, which includes different specific sub-sectors i.e., food, electronics,
textile products, etc.
1.6
Discussion
This analysis showed that the recurring economic sectors in the case studies are
different for LCA and S-LCA. A comparison of the different FUs was possible only
between the sectors present in both cases (11 sectors). For instance, for the manufacture of food products, a mass-based FU is prevalent in both methodologies
(Fig. 1.1). Table 1.1 shows the quantities mainly used. It can be noted that, for
6 out of 11 sectors, the same quantity is used: mass in 5 sectors (A1 – crop and
1 Functional Unit Definition Criteria in Life Cycle Assessment and. . .
9
animal production, hunting and related service activities; C10 – manufacture of food
products; C20 – manufacture of chemicals and chemical products; E38 – waste
collection, treatment and disposal activities; materials recovery; E39 – remediation
activities and other waste management services); product unit for one sector (sector
C31 – manufacture of furniture). On the other hand, for four sectors (C only –
manufacturing; D35 – electricity, gas, steam and air conditioning supply; E36 –
water collection, treatment and supply; F41 – construction of buildings) different
FUs are used. Furthermore, this comparison cannot be made for the C26 sector
(manufacture of computer, electronic and optical products) as no reference to the FU
was found in the LCA review.
Regarding the presence of a FU definition, although it is an important aspect for
the individual case studies of LCA, it does not seem to have received the same
attention in the review articles. Indeed, only 68.47% of the reviews reported the FU
definition, taken from the analysed case studies (see Sect. 2.1). As regards S-LCA,
even if the FU is identified in 75.28% of the case studies (see Sect. 2.2), this
definition does not go further than the FU definition in the UNEP/SETAC [7].
Hosseinijou et al. [13], Yıldız-Geyhan et al. [14], Raffiani et al. [15] highlight the
difficulty of linking the FU to the LCIA phase, being data in S-LCA qualitative and
semi-quantitative. Consequently, the social impacts are evaluated with regard to the
behaviour of the company rather than to the input and output flows of processes.
1.7
Conclusions and Future Developments
This article represents a preliminary phase of investigation regarding the GSD phase
of an LCT study. The FU definition is an important aspect of the LCA methodology
when it comes to the modelling of the product system under analysis and thus it is a
common practice. On the other hand, the FU in S-LCA does not seem to be easily
identifiable. This article analysed the FU definition in case studies in both LCA and
S-LCA via a literature review in order to detect its selection criteria.
The results of the study showed that the FU can be defined in a similar way for
both methods in the various analysed sectors. This statement can therefore show that
the FU selection depends on the product rather than on the orientation of the analysis
(environmental or social). In addition, the results showed a prevalence of the use of
mass as a quantity for FU identification in both methodologies. Considering that the
FU should focus on the functional aspects, the prevalence of mass can be open to
criticism. However, this can be justified, e.g., since it is one of the simplest quantities
to be applied or because it is influenced by the choice of the reference flow. This
aspect should be studied extensively, also in view of the differences between a standalone and a comparative analysis. Indeed, in the latter, the FU selection can strongly
influence the results and, therefore, the selection of an “easy” FU is not always
adequate. Furthermore, with a view to carrying out a sustainability assessment (Life
Cycle Sustainability Assessment), it is necessary to combine the results of S-LCA
and LCA and to identify a single FU. For these reasons, further developments of this
10
I. Arzoumanidis et al.
work will include in the analysis the results of the various case studies (from the
LCIA phase) with respect to the used FU. In this way, it will be possible to identify
the way in which the results in both methodologies can be influenced by the choice
of the FU. Therefore, it will be possible to acquire a complete picture of the
dynamics of FU definition and application in the case studies of LCT.
References
1. Finkbeiner M, Schau EM, Lehmann A, Traverso M. Towards life cycle sustainability assessment. Sustainability. 2010;2(10):3309–22.
2. Kloepffer W. Life cycle sustainability assessment of products. Int J Life Cycle Assess. 2008;13
(2):89–95.
3. ISO 14040. Environmental management – life cycle assessment – principles and framework.
Geneva, 2006.
4. D’Eusanio M, Zamagni A, Petti L. La social life cycle assessment a supporto del supply chain
management, 11th conference of the Italian LCA network, resource efficiency e sustainable
development goals: il ruolo del life cycle thinking, Siena, 2017, p. 279–287.
5. Macombe C, Feschet P, Garrabé M, Loeillet D. 2nd International seminar in social life cycle
assessment – recent developments in assessing the social impacts of product life cycles. Int J
Life Cycle Assess. 2011;16(9):940–3.
6. Di Cesare S, Silveri F, Sala S, Petti L. Positive impacts in social life cycle assessment: state of
the art and the way forward. Int J Life Cycle Assess. 2016:1–16.
7. United Nations Environment Programme and Society for Environmental Toxicology and
Chemistry, Guidelines for social life cycle assessment of products, Paris, 2009.
8. Weidema B, Wenzel H, Petersen C, Hansen K. The product, functional unit and reference flows
in LCA, environmental news 70, 2004, Danish Ministry of the Environment – Environmental
Protection Agency.
9. Accessed 30 Oct 2017.
10. Accessed 10 Apr 2018.
11. Arzoumanidis I, Raggi A, Petti L. Environmental assessment of beekeeping products and
services – a life cycle assessment case study including honey and pollination, proceedings of
the 10th congress of the Hellenic Society of Agricultural Engineers, Athens, 2017, p. 426–435.
12. Bjørn A, Laurent A, Owsianiak M, Olsen SI, History LCA. In: Hauschild MZ, Rosenbaum RK,
Olsen SI, editors. Life cycle assessment – theory and practice. Cham: Springer; 2018. p. 17–41.
13. Hosseinijou SA, Mansour S, Shirazi MA. Social life cycle assessment for material selection: a
case study of building materials. Int J Life Cycle Assess. 2014;19(3):620–45.
14. Yıldız-Geyhan E, Altun-Çiftçioğlu GA, Neşet Kadırgan MA. Social life cycle assessment of
different packaging waste collection system. Resour Conserv Recycl. 2017;124:1–12.
15. Raffiani P, Kuppens T, Van Deal M, Azadi H, Lebailly P, Van Passel S. Social sustainability
assessments in the biobased economy: towards a systemic approach. Renew Sust Energ Rev.
2018;82(2):1839–53.
Chapter 2
Towards a Taxonomy for Social Impact
Pathway Indicators
Bo P. Weidema
Abstract A conceptually complete taxonomy is proposed at three levels of the
impact pathway: Elementary flows, midpoint impacts, and endpoint impacts. The
completeness is ensured conceptually by including unspecified residuals and by the
use of fully quantifiable indicators that can be traced from source to sink, so that
completeness can be verified by input-output balances and against measured totals.
Each category in the taxonomy has a definition and at the lowest level also a unit of
measurement. Examples of category definitions and units are illustrated in an impact
pathway model with starting point in the midpoint impact category “Undernutrition”. This model also demonstrates the role of the taxonomy in the development of
characterisation factors.
2.1
Introduction
The purpose of taxonomy is to provide structure and conceptual clarity to a scientific
domain through clear definitions of hierarchically organised concepts. By reducing
confusion and supporting harmonisation of terminology, the ultimate purpose is to
improve monitoring, knowledge-generation, and decision-making. For social impact
pathway indicators an important aspect of this is to ensure consistency in modelling,
so that similar impacts are treated in a similar way.
Social impacts are here understood in the wider sense of welfare economics, as all
impacts that affect human wellbeing, including ecosystem, health and socio-economic impacts.
The concept of impact pathway indicators has its own taxonomy, with the most
well-known being the DPSIR framework of EEA [1], dividing indicators in Driving
Force, Pressure, State, Impact, and Response indicators. Within the field of Life
Cycle Assessment, as standardised in the ISO 14040 series, the same impact
pathway indicators have different names as shown in Table 2.1 Here, the latter
B. P. Weidema (*)
Danish Centre for Environmental Assessment, Aalborg University, Aalborg, Denmark
e-mail:
© The Author(s) 2020
M. Traverso et al., Perspectives on Social LCA, SpringerBriefs in Environmental
Science, />
11
12
B. P. Weidema
Table 2.1 Classes of impact pathway indicators in the EEA and LCA
DPSIR [1]
Driving
force
Pressure
State
Impact
Response
LCA (ISO 14040 series)
Functional unit, Reference flow or Intermediate flow (between economic processes)
Elementary flow
(no parallel, except when describing a baseline, reference, or background situation)
Impact category endpoint (often shortened to “impact” with indicators divided in
midpoint indicators and endpoint indicators, the latter often classified in Areas of
Protection)
(no direct parallel; Responses may be formulated as new Functional Units of
different improvement scenarios)
terminology is applied, except for the use of the term “pressure” in the example in
Sect. 2.9.
Contributions towards a taxonomy for social impact pathway indicators have
been made by:
• Jolliet et al. [2], in particular for Areas of Protection;
• Bare & Gloria [3], who presented a very detailed taxonomy, however limited to
physical impacts and introducing a concept of “mode of contact” as a midpoint
between elementary flows and midpoint impacts, although this did not play a
central role in structuring their taxonomy;
• Simões [4], who collected 1450 social indicators from 51 documents from more
than 30 scientific journals and classified these into 54 indicator families, further
classified according to the 22 social aspects of the Global Reporting Initiative – a
classification that is most relevant at the level of elementary flows, but which does
not consider the further cause-effect relations required for linking to midpoint and
endpoint indicators;
• UNECE [5] providing a very comprehensive set of sustainability indicators and a
very clear description of the relationship between these indicators and the national
accounting framework, particularly pointing out that for each aspect to be covered, both a geographical (imports/exports) and a temporal (transfer to future
generations) perspective need to be covered.
The taxonomy presented here extends these contributions by suggesting a conceptually complete taxonomy at three levels of the impact pathway: Elementary
flows, midpoint impacts, and endpoint impacts. The completeness is ensured conceptually by including unspecified residuals, but also and more importantly by the
use of fully quantifiable indicators that can be traced from source to sink, so that
completeness can be verified by input-output balances and against measured totals.
A distinction between biophysical, economic and social indicators has been
maintained at the level of elementary flows, while for midpoint impacts the social
and economic melts together as socio-economic indicators. When values are introduced at the level of endpoints (areas of protection), it is no longer meaningful to
maintain the distinction between biophysical and socio-economic, even though some
impacts can still be measured in physical units.
2 Towards a Taxonomy for Social Impact Pathway Indicators
2.2
13
Equity-weighted Welfare (“Utility”) as Single-score
Endpoint
In accordance with welfare economics, the taxonomy applies equity-weighted welfare (or “Utility” for short) as single-score endpoint indicator. The equity-weighting
(also known as utility-weighting, welfare-weighting, or distributional weighting) is
necessary to take into account that the same impact is more burdensome (and that a
similar improvement is more valuable) for individuals with lower income, and also
allows a distinction between the weights given to impacts that directly affect
wellbeing versus impacts that affect wellbeing indirectly via changes in productivity
[6]. Thus, utility is measured in equity-weighted and purchasing-power-corrected
monetary units. When communicating values, the most appropriate unit should be
chosen, depending on the audience. The use of monetary units for communicating
values should be limited to those situations where it is desired by the audience.
Single-score results may, e.g., also be expressed in sustainability-points or QualityAdjusted person-Life-Years. Monetary units are simply preferred for convenience
by many decision-makers. The advantage of a single-score endpoint is that it allows
explicit trade-offs to be made between the indicators of the different Areas of
Protection. The inclusion of a single-score endpoint in the taxonomy does not
imply that single-score methods have to be used in order to benefit from the
remaining part of the taxonomy.
2.3
Areas of Protection
A conceptually complete organisation of “areas of protection” was suggested by the
UNEP/SETAC Working Group on Impact Assessment [2]. Table 2.2 shows this
with a few modifications. What is meant here by conceptually complete is that any
item must be either human or non-human; any non-human item must be either biotic
or non-biotic; any item must have either intrinsic value (be valuable in itself) or
instrumental value (be valuable as a means to an end). What is here called “Instrumental” may also be called “Resources” or “Capital”.
In the definition of the WHO [7], human health is “a state of complete physical,
mental and social well-being and not merely the absence of disease or infirmity”,
Table 2.2 Areas of protection in the SETAC/UNEP LCIA framework from [2], slightly modified
by Weidema [8] by adding the terms in brackets
Objects considered
! Endpoint value #
Intrinsic
Instrumental
Humans
Human health
(and well-being)
Human
productivity
Biotic environment (natural
and artificial)
Biodiversity (and well-being
of animals in human care)
Ecosystem productivity
Abiotic environment
(natural or artificial)
Natural and cultural
heritage
Natural resources and
man-made capital
14
B. P. Weidema
implying that the term also covers human wellbeing in a wider sense. However, in
practice, the definition is used in the more narrow sense of mortality and morbidity as
reflected in the use of DALY (Disability-Adjusted Life-Years) as a unit of measurement (e.g., in the Global Burden of Disease studies). DALY is also the typical unit
used for the human health impact category indicator in most LCIA methods. Some
models, especially those including social impact pathways, instead use the unit of
QALY (Quality-Adjusted Life-Years), to reflect the wider wellbeing perspective.
The term “endpoint” for the indicators of the areas of protection implies that these
are seen as independent and non-interacting. For the impact pathways, this implies
that a midpoint impact that ultimately affects more than one endpoint should have an
impact pathway to each of these endpoints. For example, a disease will typically
both have a pathway to human health and a separate pathway to human productivity
(lost workdays and health care costs). When a single-score endpoint is applied, the
“areas of protection” endpoints effectively become midpoints towards the singlescore endpoint. The use of the term “endpoint” is thus context-dependent.
2.4
Midpoint Impact Categories
Midpoint impacts can both affect endpoints and other midpoint impact categories. In
Table 2.3, midpoint impact categories at the two top levels are listed. In the full
taxonomy, a third level exists for many midpoint impact categories, and the taxonomy is open for further refinement. For example, the level 2 category “Inadequate
maternity support” has a sub-category “Food insecurity” at level 3, defined as
“Prevalence of insufficient amount and quality of individual food intake among
children and women of childbearing age” and measurement unit: “Dimensionless
ratio representing affected fraction of population (prevalence)”. Further examples of
definitions and units are provided in Sect. 2.9.
The majority of the midpoint impact categories in Table 2.3 are relatively selfexplanatory. However, the one named “market distortion” is an aggregate of many
more specific midpoint impact categories, and may therefore need to be explained
here. It can be differentiated by the more specific nature of inequality of opportunity
and transaction conditions (e.g., information inequality, discrimination, trade barriers) and by market (which includes markets for production factors). What is
common for all of these is that different market actors are treated unequally or
even completely prevented from access to a specific market.
2.5
Elementary Flow Categories
For the elementary flows, the top levels (see Table 2.4) are relatively aggregated,
especially for the biophysical pressures, where level 3 (not shown in Table 2.4)
contains 37 categories, and many more, e.g., specific substance emissions, at level
2 Towards a Taxonomy for Social Impact Pathway Indicators
15
Table 2.3 Top-level midpoint impact categories
Level 1
Biophysical impacts
–
–
–
–
–
–
–
–
–
Socio-economic
impacts
–
–
–
–
–
–
–
–
–
–
–
–
–
–
–
–
Level 2
Acidification
Antibiotic resistance
Aquatic oxygen depletion
Eutrophication
Global warming, ecosystem impact
Global warming, human impact
Human disease from respiratory particulates
Human toxicity
Other human diseases
Other physical impacts*
Absolute poverty
Capital market failure
Government failure
Human migration, forced
Inadequate access to pensions or social security
Inadequate maternity support
Inadequate conservation of cultural heritage
Inadequate social infrastructure*
Insufficient health care system
Insufficient skills
Market distortion, except capital markets
Underinvestment in education
Underinvestment in health care
Underinvestment in natural disaster damage prevention and mitigation
Underinvestment in physical infrastructure
Unemployment and underemployment
Unwanted pregnancy
*
Unspecified residuals are indicated with an asterisk
4. For the economic and social pressures, level 3 categories are shown in Table 2.5.
Each flow category has a definition and at the lowest level also a unit of
measurement.
2.6
Modelling the Impact Pathways
Impact pathway modelling can take its starting point in an elementary flow, a
midpoint or an endpoint, and thus model both forwards and/or backwards in the
impact pathway. Modelling backwards in the direction of elementary flows ensures
that the full impact can be allocated to its causes, and is thus recommendable. Causal
relationships can best be expressed as marginal characterisation factors (unit of
16
B. P. Weidema
Table 2.4 Top-level elementary flow categories
Level 1
Biophysical pressures
–
–
–
–
–
Economic pressures
–
–
Social pressures
–
–
Level 2
Biological contamination
Direct physical changes to environment
Dissipative use of natural resources
Energy emissions
Overconsumption
Substance emissions
Human time (labour & leisure hours)
Insufficient payment of labour or taxes
Monetary expenditure, except wages
Illegitimate resource acquisition and control
Inadequate work environment
Violence
endpoint indicator per unit of midpoint indicator or elementary flow indicator, unit of
resulting midpoint indicator per unit of causing midpoint indicator or elementary
flow indicator), allowing direct calculations of impacts by matrix inversion [9].
2.7
An Example of a Social Impact Pathway Model:
Undernutrition
The principle of the impact pathway modelling is illustrated in Fig. 2.1 with a
starting point in the midpoint “Undernutrition” (level 3 midpoint category under
“Other human diseases”) and its two further sub-categories: “Sub-optimal infant
feeding practices” and “Childhood and maternal undernutrition”. The extent of
undernutrition is know from statistics, which allows a complete breakdown to causal
factors, using on the one hand known cause-effect relationships and on the other
hand a residual pathway. In the case of “Sub-optimal infant feeding practices” this
residual pathway is “Insufficient health care system”, and for “Childhood and
maternal undernutrition” it is “Food insecurity”, both having “Underpayment of
labour or taxes” as the ultimate residual elementary flow.
2.8
Pressure Categories and Indicators (1–5) for
Undernutrition
This Section provides definitions of the five pressure categories and indicators, in
LCA terminology known as inventory indicators, that contribute to undernutrition.
The first four occurs in productive activities, while the last (household gender